Evaluation of Psychiatric Residential Treatment Facility Use by North Carolina Youth for Fiscal Years 2009-2011
Johna H. Bruton, MSW Alana R. Blackmon, MPH Cynthia M. Wiford, MRC, Principal Investigator Behavioral Healthcare Resource Program, School of Social Work, University of North Carolina
at Chapel Hill
Barbara J. Burns, Ph.D., Principal Investigator Linda Maultsby Services Effectiveness Research Program, Department of Psychiatry and Behavioral Sciences,
Duke University School of Medicine
Acknowledgments: This project is funded through a contract with the NC DMHDDSAS with Federal Mental Health Block Grant funds provided by SAMHSA to the Behavioral Healthcare Resource Program, School of Social Work, University of North Carolina at Chapel Hill and a subcontract with the Services Effectiveness Research Program, Department of Psychiatry and Behavioral Sciences, Duke University School of Medicine.
Background
A dramatic rise over recent years in both the number of North Carolina youth being admitted to psychiatric residential treatment facilities (PRTFs) and the high costs for their treatment in these intensive residential facilities became a concern for both the Division of MH/DD/SAS (DMH) and the Division of Medical Assistance (DMA) within the Department of Health and Human Services (DHHS). This occurred during a period when there was also a serious shortfall in Medicaid funds. Trend data compiled by DMA included in a report prepared by Catharine Goldsmith (DMA) and Mark O’Donnell (DMH) highlighted the increased PRTF use with a concurrent decrease in use of Level III and IV Group Homes and only a slight
increase in the use of less restrictive Treatment Foster Care. The drop in use of Level III and IV Group Homes observed in FY2010 was a result of the state policy to close those restrictive residential placements with the expectation and goal of treating these youth in the community instead. The impact of that policy was also evaluated by this group of investigators and their final report was submitted on April 1, 2011.
The impetus for this new report requested by DMH was twofold: first, to determine whether youth placed in these residential facilities truly needed this high level of care; and second, to understand what caused the unexpected shift to greater PRTF utilization and higher costs. While limitations in Medicaid data do not allow for a full clinical picture of youth, the data do provide an available source of information to characterize these youth overall, to examine several indicators and risk factors for PRTF placement, and to identify patterns of care and costs in PRTFs paid by Medicaid. Of additional interest was to explore any role that the state policy to close Level III and IV Group Homes may have been related to the decrease in available
residential facilities, and/or their subsequent reclassification to PRTFs. Of further interest was to identify patterns of care and costs in all PRTFs that bill Medicaid based on facility location, i.e.,
In State, Border, and Out of State.
In summary, all youth who received care in PRTFs between July 1, 2008 and June 30, 2011 are described over a range of variables. These include their demographic and clinical characteristics, services received, placement shifts, and costs. The source of information for analysis is Medicaid data provided to UNC by the Division of Mental Health (Adam Holtzman). The data were organized in two different ways.
First, youth with any PRTF admission during the study years (FY2009-FY2011) were examined as a group and characterized by their service use and costs pre-PRTF admission, during a PRTF stay, and post-discharge from a PRTF. A total of 2,157 youth received PRTF care and 327 (15.2%) of these youth were readmitted after a discharge. Extensive use of other residential services is reported “during the PRTF stay” related to the Medicaid monthly billing practice. If, in any given month, a placement change occurred and a further placement occurred, both placements show up in billing for that month. Thus, the “During PRTF Stay” category in some cases includes other residential care in addition to PRTF. This also accounts for months in which the youth was admitted to PRTF from a residential level of care or discharged from PRTF to another residential level of care.
The second approach to analysis examines youth receiving PRTF care by fiscal year, allowing for a historical comparison related to state policy changes and showing a increase in admissions to PRTF care for each year (479 in FY2009, 643 in FY2010, and 762 in FY2011 resulting in an unduplicated total of 1,884 over three years). The duplicated total (N = 3,205) representing continued stays and admissions, however, presents a different picture. That approach shows a doubling of youth in PRTF service from fiscal year 2009 with 752; 1,043 in FY2010; and 1,410 in FY2011; a total duplicated count of youth across the three years is 3,205. The average number of admissions for the 1,884 youth was 1.14 per child.
A year, adm youth in During F over the on July 1 discharge 648 and t Figure 1 T are: (1) a A brief summ missions, and PRTF place FY2009, ther course of the 1, 2009; an a ed. By July there were 7 below). Three importa all new adm
mary of the p d discharges ments on Ju re were 479 n e year and 3 additional 64 1, 2010, the 762 new adm
ant total num issions equa pattern of you (except not uly 1, 2008, a new admissi 52 of them w 43 were admi e total numbe missions for a mbers across als 1,884 you uth in PRTF available fo at the beginn ions. Thus, were dischar itted for a to er of youth r a total of 1,4
s the three fis uth; (2) the to F care at the b or FY2011) f ning of the th a total of 75 rged. Four h otal of 1,043 remaining in 410 in PRTF scal years se otal of 2,157 beginning o follows: Th hree-year stu 52 youth wer hundred rem ; 395 of thes n PRTF care F care over F een througho 7 includes th f each fiscal ere were 273 udy period. re in PRTF c mained in PR se youth wer had increase FY2011 (see
out this repor he 273 censu l 3 care RTFs re ed to rt us
youth already in care in FY2009 and is the unduplicated count of youth who received care in a PRTF; and (3) 3,205 is the sum of youth in PRTF service annually, namely all youth already in care at the beginning of a year plus admissions. What is observed is that many youth stay in care across fiscal years.
Selected data are reported in the text and some graphs. Detailed data can be found in the Appendices.
Findings Appropriateness of PRTF Placement
The central question raised by DMH, to be addressed with Medicaid data, was “Are the youth who receive care in PRTFs the right ones?” The criteria for admission to a PRTF are clearly specified in the latest DMA Clinical Coverage Policy (May 1, 2007). Those which can be partially assessed with the data made available include: (1) a DSM-IV-TR (Axes 1-5) diagnosis which can reasonably be expected to respond to therapeutic intervention; (2) the child/adolescent has a history of multiple hospitalizations or other treatment episodes; and (3) use of less restrictive and intensive levels of treatment have been tried.
Diagnosis. With respect to diagnosis, all youth met this criterion. One-fourth received
two or more diagnoses. The proportion with multiple diagnoses increased each year. Most dramatically, the new admissions from 18% in FY2009, to 24% in FY2010, to 36% in FY2011, suggesting greater clinical complexity. The most frequent diagnostic category, disruptive behavior (includes ADHD, ODD, and CD), was recorded for 46% of youth admitted in FY2009 and dropped slightly over the next two years. This set of conditions is typical of youth admitted to residential treatment centers across the country, as is the second most common diagnosis, bipolar disorder, where the rate increased over time among youth in service from 23% to 29%, also a similar pattern for the total population. Other fairly common conditions were
PTSD/trauma (10.4%) and depression (6.8%). Given recent attention to reactive attachment disorder, and although a fairly small proportion (3.5%) of the population, there were 76 youth with this diagnosis. There was very low use across the years (duplicated N over the 3 years = 50, unduplicated N = 32) of PRTFs by youth with autism spectrum disorders or Rett’s disease. The low prevalence of anxiety disorders, which usually can be treated in outpatient settings, was a good sign.
Overall, this picture of both multiple and serious conditions seems to indicate that this level of care was appropriate, a pattern also likely to be observed in lower level placements.
History of Multiple Hospital Admissions or Other Treatment Episodes. The Medicaid
data analyzed only cover a three-year history and do not account for earlier service use, a service use pattern which is likely to have preceded what is reported here. Nonetheless, for youth (N = 2,157) receiving PRTF care, at least 45% were in a psychiatric inpatient setting prior to a PRTF admission. For youth discharged and later readmitted to a PRTF, 75% had a psychiatric hospital admission at some point in the study period. In addition to experience in an inpatient psychiatric hospital, the use of other residential placements was typical, i.e., one-third to a Level III Group Home, and 23% to treatment foster care. The pre-PRTF placements demonstrated the use of more intensive services (hospital), and considerable exposure to less restrictive ones. These observations support a finding that youth met the criteria for a PRTF admission based on hospital admissions and other treatment episodes.
Less Restrictive Use of Intensive Levels of Care Have Been Utilized. Prior to a PRTF
placement, in addition to the group home and treatment foster care findings above, youth later admitted to a PRTF had received an extensive array of community-based services. Most notably, more than two-thirds of them had received community support, outpatient therapy, and clinical assessment. Another one-third received substance abuse treatment and a fourth received
intensive in-home services, while a fifth of them received day treatment. In sum, the service use figures represent multiple efforts to provide less restrictive community-based services. A discrepancy may be the very low rate (3.5%) of use of multisystemic treatment, an intervention which potentially could have prevented PRTF placement or readmission.
Summary
In summary it appears, based on the Medicaid information available, that these 2,157 youth met the criteria for a PRTF. This is confirmed for all three criteria for admission
addressed here; namely diagnosis, multiple hospitalizations, other treatment episodes, and trials of less restrictive care. In addition, but not related to the criteria above, the use of the other residential services cost $58,451,973 and community-based services $30,021,010 for a total of $88,473,095, documenting a significant Medicaid investment in the youth (from July 2008 through the date of their admission to PRTF) before moving into a PRTF (see Appendix Table 3A). The overall conclusion is that the youth who were later admitted to a PRTF met the criteria for admission and were those who needed this level of care.
Accounting for PRTF Use, Other Residential, and Community-Based Services and Costs Having described the severity of youth admitted to a PRTF, the second major thrust of this report is an investigation of the increased service use and costs for youth receiving PRTF care. The DMA Budget Office documented these trends in a series of month-by-month and year-by-year analyses. A major observation over time was that as use of Level III and Level IV Group Home placements diminished, admissions to PRTFs increased dramatically. This report led our group to consider the following questions:
1. Was the PRTF increased use related to the Division policy to close Level III and Level
2. Was the PRTF increased use associated with conversion of former Level III or Level IV
Group Homes to PRTF beds or the opening of new PRTF facilities in response to an expected need for more restrictive care?
3. Were the PRTF increased use and cost related to facility location (In State, Border, or
Out of State)?
4. For youth who received PRTF care, what is the relationship between all types of services
received and escalating costs?
Question 1: Effect of the Policy. In the year prior to implementation of the higher level
group home reduction policy (FY2009), there were 479 youth admitted to a PRTF. During the policy implementation year (FY2010), there was an increase of 164 youth admitted to PRTFs, and in the year after policy implementation (FY2011), the number admitted continued to rise by 119 for a total of 762 admissions. This would seem to indicate that the policy change did contribute to PRTF admissions.
Without respect to fiscal year, and not surprisingly, youth, prior to a PRTF admission, had considerable exposure to Level III care (one-third) and 4% to Level IV; somewhat less, but still meaningful during a PRTF stay (23.4%) and post-discharge (19.5%). However, when looking at patterns of group home use by fiscal year for new admissions to PRTFs, the use of Level III decreases minimally and Level IV actually increases by a factor of almost three (N = 14 to 49). What is a more pronounced observation is that among all youth in a PRTF in a fiscal year, Level III was used for 45.2% in FY2009, 28% in FY2010, and 21.6% in FY2011. While a steady decline over the years, the continued significant use of the Level III Group Home raises a question about how effectively the policy was implemented. Level IV use increased (from 23 in FY2009 to 61 in FY2010) during the policy implementation year and then dropped down to 10 youth by FY2011. The extent of influence which the Level III and Level IV policy had on PRTF
admissions remains unclear. While it is known that most youth in Level III and almost all in Level IV were discharged in FY2010, what seems to have occurred is that youth in PRTFs were subsequently admitted to Level III and IV Group Homes and thus is not an indication that the policy contributed to a higher number of youth admissions to PRTFs, although a partial
explanation. Other factors might also have contributed, such as increased clinical acuity among the youth, (e.g., an increased rate of bipolar disorder and an increased proportion of youth with multiple disorders over the three years), or admissions generated from the removal of all children receiving NC Medicaid from The Pines in Virginia (52 of them were discharged to another PRTF).
Question 2: Conversion of Level III and IV Group Homes to PRTFs. In response to the
second question about the conversion of those beds to PRTF ones or that additional beds were created by new PRTF organizations coming into the state; there is anecdotal information about conversions in a few agencies. Efforts to obtain further information have not been successful. The alternative hypothesis was that new agencies which provide this level of care might have moved into the state in anticipation of greater need for PRTF services. Based on our perusal of the list of agencies providing PRTF care, all on the current list were already located in the state by FY2009, although some agencies have opened additional cottages.
Question 3: The Effect of PRTF Location on Use and Costs. The question about PRTF
location on use and costs is examined from three perspectives: the role of client characteristics; a change in reimbursement rates; and overall increases in admissions and lengths of stay already described.
A comparison of youth characteristics from In State, Border (within a 40 mile radius of the NC border), and Out of State locations are similar with few exceptions. The average age of youth In State was 13.5 years while youth in Border programs were thirteen months older. A
higher proportion of males (75%) were Out of State. The racial distribution across locations was roughly equal with one-third of the youth Black and 60% White and slightly more Black youth placed In State than in the other two locations. In the small group who were placed Out of State, three-fourths of them were male. With respect to clinical status, youth placed In State (31.1%) were twice as likely to have multiple diagnoses recorded as youth in the other two location types. The diagnostic patterns across the three facility location types are barely distinguishable. This includes the small group placed Out of State. Possibly of interest is that youth with reactive attachment disorder and PTSD are mostly treated In State while youth with autism and Rett’s disease are split between In State and Border.
Other influences more likely dictate placement location. For example, use of the Border sites may result from there being fewer In State residential services in both the Northeast and the most western part of North Carolina. Such placements may keep youth closer to home.
Alternatively, Border sites may be used because there are not enough PRTF beds In State.
A second factor that was examined to identify cost increases was the average cost per day across location types. The daily rates actually decreased for In State and Border sites each year, and increased slightly across years for Out of State, thus also not accounting for the increases.
What did increase were the dollars associated with the number of days of care. Most dramatic was the rise from $11,310,575 in FY2009 to $19,331,417 in FY2010, and to
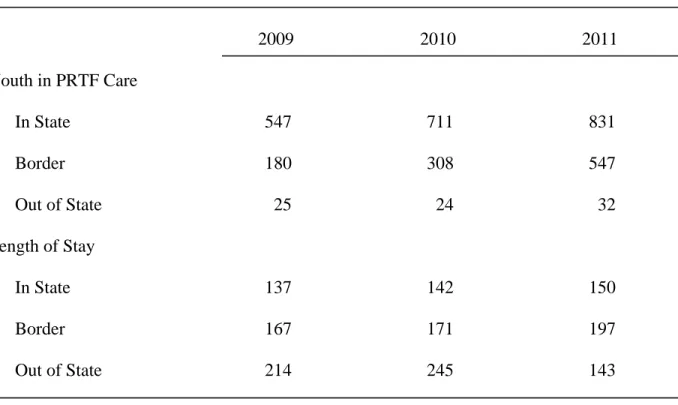
$39,252,885 in FY2011 in Border sites, followed by a more incremental increase of close to $10 million dollars a year for In State facilities. The Out of State costs for FY2009 at $2,142,798 just increased by $271,000 in FY2010 and decreased by $481,000 in FY2011. These reported costs correspond to a huge increase in admissions and length of stay for In State and Border sites. The
decreased cost in Out of State programs is explained by a greatly reduced length of stay, despite more admissions by FY2011 (see Table 1 below).
Table 1. Youth in PRTF Care and Length of Stay (LOS) by PRTF Location
2009 2010 2011 Youth in PRTF Care In State 547 711 831 Border 180 308 547 Out of State 25 24 32 Length of Stay In State 137 142 150 Border 167 171 197 Out of State 214 245 143
Question 4: Service Use and Costs. The big picture is that 2,157 youth received PRTF
care across three years (FY2009- FY2011), with the number of youth in a PRTF increasing from 752 inFY2009 to 1,043 in FY2010, to 1,410 in FY2011, for a total Medicaid expenditure of $390,536,713, which in FY2009 was $115,542,477, $128,446,836 in FY2010, and was $146,547,399 by FY2011. What contributed to the escalating costs is related to the use of multiple types of services (PRTF, other residential, community-based, and medication), increased admissions to PRTFs, and longer lengths of stay over the three-year study period.
Addressing first the combination of service types, in addition to PRTF, youth received care in other residential services. Most prominent was Level III Group Homes, 45% in FY2009,
28% in FY2010, and 21.6% in FY2011. The second type of high utilization was inpatient hospital care for 40.9% in FY2009, 35.3% in FY2010, and 33.3% in FY2011. Treatment Foster Care use was less likely, but increasing over time from 18.4% to 24.3% to 26.2%. The total costs of these other residential services diminished over time from $38,819,978 to $22,181,134. Use of community-based services saw a similar decline with the most costly initially being community support ($7,819,750) dropping by FY2011 to $1,089,510 and consistent with the policy to eliminate this service. Outpatient therapy was provided to the majority of youth and up to 91% by FY2011. Prescription drugs cost from nine to ten million dollars a year, rising
slightly each year.
While demonstrating some decrease in costs for other residential service use, little change in community-based services, and a minimal decrease in medications, the PRTF costs rose each year from $49,674,685 to $67,471,597 to $96,930,319. These costs claimed an increasingly greater proportion of total expenses each year, raising a question about the cause. The total costs for all services by year are shown in Figure 2 below and Figure 3 compares the average cost per youth by year for the 2,157 youth in PRTF placement during FY2009-2011.
H these you increased compares residentia in FY200 Having descr uth, length o d admissions s the average al services. 09 to 93 day
ribed the incr f stay (LOS) s over time, b e length of s As the LOS s in FY2011 rease in PRT ) offered ano but about as stay for youth
in other res 1, a smaller, TF admission other topic fo critical may h while in a idential plac but substant ns previousl for examinati y be the LOS PRTF and w cements drop tial increase ly and other ion. Not on S over time. while placed pped dramat in PRTF day service costs ly were ther Figure 4 be d in other tically (235 d ys occurred. s for re elow days .
A 168 in FY treatment costly, ob school ye continue observed costs ove PRTF ad As seen abov Y2011. The t center care bservation, a ear. Since th across fisca d in the estim An alt er the full stu dmission (N =
ve, the averag ese average n e. The somew as it may con he LOS days al years (see mates above. ternative to L udy period. = 1,830); (2) ge LOS per y number of da what longer ntribute to gr s are organiz Figure 1), th LOS by fisc To do so, th ) PRTF disc youth was 1 ays fall into length of sta reater stabili zed by fiscal he actual ind
al year was t hey were divi harge and re 47 days in F the ‘short st ay may actu ity of care, o year, and it dividual stay to characteri ided into thr eadmission ( FY2009, 156 tay’ category ually be a pos or even comp is clear that is likely to b
ize the youth ree groups: (N = 327); an 6 in FY2010, y of resident sitive, albeit pletion of a t stays in a P be longer tha h experience (1) a single nd (3) PRTF , and tial t PRTF an e and F
discharge and not readmitted (N = 1,152). The single admission group, because it includes 678 youth who were still in a PRTF at the end of FY2011 were not included in the comparison.
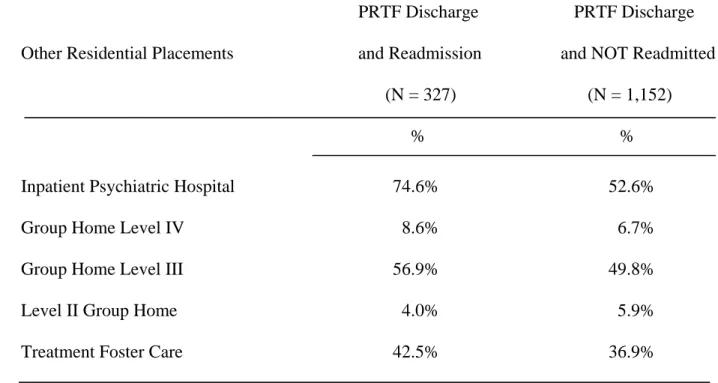
The expectation was that the group which was readmitted to a PRTF would cost more than the group that was not, and in fact, that was so. The readmitted youth cost an average of $249,859 over three years, in contrast to $156,130 for youth who were discharged and not readmitted to a PRTF. The much greater cost in the first group is accounted for by 68% of expenditures for PRTF, 21% for other residential, and 11% for community-based services. The proportions of expenditures for the youth not readmitted were 56% PRTF, 28% other residential, and 16% community-based services. The latter pattern reflects greater use of community-based services. The picture of admissions to other residential placements for both groups is
concerning, especially that three-fourths of those readmitted had at least one psychiatric hospitalization or that 57% were in a Level III Group Home. That group, in addition to two PRTF stays in three years, were also admitted twice (on average) to two additional residential facilities. (See Table 2 below and Appendix Table 3B.)
Table 2. Use of Other Residential Services by Youth with a PRTF Discharge and Readmission
and Youth with a PRTF Discharge Only (FY 2009, 2010, 2011)
PRTF Discharge PRTF Discharge
Other Residential Placements and Readmission and NOT Readmitted
(N = 327) (N = 1,152)
% %
Inpatient Psychiatric Hospital 74.6% 52.6%
Group Home Level IV 8.6% 6.7%
Group Home Level III 56.9% 49.8%
Level II Group Home 4.0% 5.9%
Treatment Foster Care 42.5% 36.9%
Conclusions and Implications
There are two major conclusions from this analysis based on Medicaid data. First, PRTF utilization appeared to be based on need associated with meeting the criteria for admission. Second, increased PRTF use is not fully explained by the closing of Level III and IV Group Homes. The increased PRTF use encompassed both increased admissions over time and an increased length of stay. Greater clinical acuity is one possibility based on their diagnosis profile and their history of multiple placements including psychiatric hospitalizations. A second
hypothesis is that the failure of community-based and other residential services is contributing to this increase.
What is of serious concern is the impact of multiple placements on youth with little stability or continuity in their lives. What is most disturbing about this pattern is the inability to develop significant roots in a family, form long-term relationships with peers, and/or become involved with a school system where their presence might have resulted in educational gains. This lack of benefit for youth is associated with huge expenditures of public dollars for a broken service system. In that vein, what is not clear from this analysis are many unanswered questions not limited to the following:
Does the quality of care across PRTFs vary and influence subsequent readmissions
and outcomes?
Were some youth without a second PRTF admission subsequently more stable in a
group home or TFC?
Could earlier community-based intervention, especially intensive work with a
parent(s), have made a difference in youth placement outcomes?
Could an intensive home-based intervention with an evidence-based approach (such
as multisystemic therapy or functional family therapy) have made a difference or would families have been open to this?
To what extent were community-based providers in contact and coordinating with
the PRTF throughout the admissions process, treatment, and discharge?
To what extent were community services and PTRFs involved with educational
planning pre-discharge?
To what extent was there active involvement of families in the treatment of their
child before PRTF admission, during their stay, and follow-up after discharge?
Do the results reported differ by facility related to the policies of the facilities, or
How is PRTF care managed, i.e., community mental health, managed care
companies, the family?
Medicaid data are very useful for identifying services patterns and policy implications, but not in explaining the causes of the findings. Answers to the questions above might be obtained by a more thorough evaluation at the PRTF facility level and a study of the youth and family experience with PRTF care; this is recommended. For example, an analysis of variation in readmission rates by facility could provide one quality indicator followed by an in-depth review of the structure, program, staff qualifications, treatment provided, and discharge planning. A recent PRTF facility survey was conducted to collect information about them, but did not include an assessment of quality. A follow-up study of youth and families to identify factors associated with failed and successful treatment is also recommended. Given an extensive history of residential and community-based service use, a major examination of the comprehensiveness and quality of community-based services early in the career of such youth is also indicated.
In conclusion, the critical priority is to learn how to reduce the pathways of these youth from multiple community-based and residential treatment alternatives to more effective clinical intervention in the community and residential care, if indicated. The aim is to increase
placement stability, especially because that is such a strong predictor of positive long-term outcomes for youth. An opportunity to address this need may exist in implementation soon of the Enhanced Level III Group Homes and the enriched Therapeutic Family Services, while a State Plan for Child Mental Health is being developed.
Table and Figure Legends
Table 1. Youth in PRTF Care and Length of Stay (LOS) by PRTF Location
Table 2. Use of Other Residential Services by Youth with a PRTF Discharge and Readmission
and Youth with a PRTF Discharge Only (FY 2009, 2010, 2011)
Figure 1. Census, Admissions, and Discharges by Year for Youth in PRTF Placements Figure 2. Total Costs for Services for 2,157 Youth in PRTF Placement During FY2009-2011 Figure 3. Average Costs per Youth Receiving PRTF Care per Year (FY2009-2011)
Figure 4. Average Length of Stay in Days in PRTF Care and Other Residential Services per Youth in PRTF Care per Year (FY2009-2011)
Appendix Tables
Appendix Table 1A: Characteristics of Youth Admitted to a PRTF (FY2009-2011) Appendix Table 1B: Characteristics of Youth (Census Plus Admissions) in a PRTF (FY2009-2011)
Appendix Table 2A: Total Service Use by Category and Percent of Use by Youth Admitted to a PRTF in Each Year (FY2009-2011)
Appendix Table 2B: Total Service Use by Category for All Youth (Census Plus Admissions) Served in PRTF Care (FY2009-2011)
Appendix Table 3A: Service Use and Cost History for Youth in a PRTF Placement (FY2009-2011)
Appendix Table 3B: Youth Characteristics and Service Use for Single Admissions, Discharge and Readmission, and Discharge Only
Appendix Table 4: Cost by Service Category for Youth in PRTF Placement (FY2009-2011)
Appendix Table 5: Youth Characteristics by PRTF Location (FY2009-2011)
Mean Range Mean Range Mean Range Mean Range Age 13.60 5-18 13.84 5-18 13.89 5-19 13.80 5-19 N % N % N % N % Gender Male 267 55.8% 380 59.1% 483 63.4% 1130 59.9% Female 212 44.2% 263 40.9% 279 36.6% 754 40.0% Race Black 144 30.1% 207 32.2% 268 35.2% 619 32.9% White 293 61.3% 383 59.6% 446 58.5% 1122 59.5% Native American 7 1.4% 7 1.1% 8 1.0% 22 1.2% Other or Unknown 35 7.3% 46 7.2% 40 5.2% 121 6.4% Primary Diagnosis Anxiety 5 1.1% 13 2.0% 14 1.8% 32 1.7% Bipolar 116 24.1% 194 30.2% 223 29.3% 533 28.3% Disruptive Behavior 232 48.6% 281 43.7% 323 42.4% 836 44.4% Depression 33 6.8% 40 6.2% 54 7.1% 127 6.7%
PDD (Autism and Rett's) 5 1.1% 10 1.6% 10 1.3% 25 1.3%
Reactive Attachment Disorder 22 4.6% 17 2.6% 19 2.5% 58 3.1%
PTSD/Trauma 46 9.6% 60 9.3% 78 10.2% 184 9.8% Schiz/Psychotic 7 1.4% 9 1.4% 22 2.9% 38 2.0% Sexual Disorder 1 0.2% 4 0.6% 3 0.4% 8 0.4% Substance Abuse 1 0.2% 3 0.5% 13 1.7% 17 0.9% Other 11 2.3% 12 1.9% 3 0.4% 26 1.4% Number of Diagnoses 1 393 82.0% 492 76.5% 490 64.3% 1375 73.0% 2 22 4.6% 77 12.0% 133 17.5% 232 12.3% ≥3 64 13.4% 74 11.5% 139 18.2% 277 14.7%
Characteristics of Youth Admitted to a PRTF (FY2009-2011)
Youth Characteristic FY2009
(N = 479) FY2010 (N =643) TOTAL (N =1,884) FY2011 (N =762)
Mean Range Mean Range Mean Range Mean Range Age 14.15 5-19 14.32 6-20 14.47 6-21 14.35 5-21 N % N % N % N % Gender Male 411 54.7% 606 58.1% 869 61.6% 1886 58.8% Female 341 45.3% 437 41.9% 541 38.4% 1319 41.2% Race Black 235 31.3% 326 31.3% 472 33.5% 1033 32.2% White 457 60.8% 635 60.9% 845 59.9% 1937 60.4% Native American 11 1.5% 12 1.2% 14 1.0% 37 1.2% Other or Unknown 49 6.5% 70 6.7% 79 5.6% 198 6.2% Primary Diagnosis Anxiety 12 1.6% 18 1.7% 25 1.8% 55 1.7% Bipolar 175 23.3% 290 27.8% 407 28.9% 872 27.2% Disruptive Behavior 348 46.3% 462 44.3% 600 42.6% 1410 44.0% Depression 54 7.2% 70 6.7% 95 6.7% 219 6.8%
PDD (Autism and Rett's) 12 1.6% 18 1.7% 20 1.4% 50 1.6%
Reactive Attachment Disorder 40 5.3% 33 3.2% 45 3.2% 118 3.7%
PTSD/Trauma 74 9.8% 109 10.5% 150 10.6% 333 10.4% Schiz/Psychotic 15 2.0% 14 1.3% 34 2.4% 63 2.0% Sexual Disorder 5 0.7% 5 0.5% 8 0.6% 18 0.6% Substance Abuse 5 0.7% 4 0.4% 15 1.1% 24 0.7% Other 12 1.6% 20 1.9% 11 0.8% 43 1.3% Number of Diagnoses 1 618 82.2% 839 80.4% 1003 71.1% 2460 76.8% 2 39 5.2% 88 8.4% 197 14.0% 324 10.1% ≥3 95 12.6% 116 11.1% 210 14.9% 421 13.1%
* In the total (N = 3,205), youth are duplicated across years when PRTF care overlaps with fiscal years
Characteristics of Youth (Census Plus Admissions) in a PRTF (FY2009-2011)
N % N % N % N % Use of PRTF by Location: In State 355 74.2% 476 74.0% 457 60.0% 1288 68.4% Border 109 22.8% 160 24.9% 298 39.1% 567 30.1% Out of State 15 3.0% 7 1.1% 7 0.9% 29 1.5% Total PRTF 479 100.0% 643 100.0% 762 100.0% 1884 100.0%
Use of Other Residential Placements:
Inpatient Psychiatric Hospital 241 50.3% 263 40.9% 323 42.4% 827 43.9%
Group Home Level IV 14 3.0% 49 7.6% 5 0.7% 68 3.6%
Group Home Level III 238 49.7% 208 32.4% 161 21.1% 607 32.2%
Level II Group Home 8 1.6% 11 1.7% 22 2.9% 41 2.2%
Treatment Foster Care 96 20.0% 147 22.9% 210 27.6% 453 24.0%
Use of Community-Based Services
Partial Hospitalization 0 0.0% 1 0.2% 9 1.2% 10 0.5% Day Treatment 118 24.6% 141 21.9% 162 21.3% 421 22.3% Multisystemic Treatment 8 1.6% 17 2.6% 23 3.0% 48 2.5% Intensive In-Home 48 10.0% 183 28.5% 273 35.8% 504 26.8% Community Support 462 96.4% 565 87.9% 336 44.1% 1363 72.3% Outpatient Therapy 349 72.9% 485 75.4% 721 94.6% 1555 82.5%
Substance Abuse Services 107 22.3% 166 25.8% 414 54.3% 687 36.5%
Clinical Assessment 311 64.9% 464 72.2% 535 70.2% 1310 69.5%
Crisis/Mobile Crisis/Respite Care 44 9.1% 80 12.4% 122 16.0% 246 13.1%
Total Service Use by Category and Percent of Use by Youth Admitted to a PRTF in Each Year (FY2009-2011)
Service Categories FY2009
(N = 479) FY2010 (N =643) FY2011 (N =762) TOTAL (N =1,884)
N % N % N % N % Use of PRTF by Location: In State 547 72.7% 711 68.2% 831 58.9% 2089 65.2% Border 180 23.9% 308 29.5% 547 38.8% 1035 32.3% Out of State 25 3.3% 24 2.3% 32 2.3% 81 2.5% Total PRTF 752 100.0% 1043 100.0% 1410 100.0% 3205 100.0%
Use of Other Residential Placements:
Inpatient Psychiatric Hospital 308 40.9% 368 35.3% 469 33.3% 1145 35.7%
Group Home Level IV 23 3.1% 61 5.8% 10 0.7% 94 2.9%
Group Home Level III 340 45.2% 292 28.0% 305 21.6% 937 29.2%
Level II Group Home 8 1.1% 22 2.1% 39 2.8% 69 2.2%
Treatment Foster Care 138 18.4% 253 24.3% 370 26.2% 761 23.7%
Use of Community-Based Services
Partial Hospitalization 0 0.0% 1 0.1% 16 1.1% 17 0.5% Day Treatment 178 23.7% 208 19.9% 264 18.7% 650 20.3% Multisystemic Treatment 10 1.3% 27 2.6% 44 3.1% 81 2.5% Intensive In-Home 67 8.9% 269 25.8% 421 29.9% 757 23.6% Community Support 718 95.5% 933 89.5% 779 55.3% 2430 75.8% Outpatient Therapy 518 68.9% 706 67.7% 1290 91.5% 2514 78.4%
Substance Abuse Services 151 20.1% 233 22.3% 659 46.7% 1043 32.5%
Clinical Assessment 468 62.2% 704 67.5% 929 65.9% 2101 65.6%
Crisis/Mobile Crisis/Respite Care 60 8.0% 108 10.4% 181 12.8% 349 10.9%
Total Service Use by Category for All Youth (Census Plus Admissions) Served in PRTF Care (FY2009-2011)
Service Categories FY2009
(N = 752) FY2010 (N = 1,043) FY2011 (N = 1,410) TOTAL (N = 3,205)
N $ % N $ % N $ % Use of PRTF by Location: In State 0 $0.00 0.0% 1,492 $121,092,540.00 98.7% 257 $25,489,548.30 9.9% Border 0 $0.00 0.0% 629 $58,032,495.18 1.2% 64 $4,056,231.37 6.2% Out of State 0 $0.00 0.0% 36 $4,680,547.64 0.2% 6 $725,240.52 0.7% Total PRTF 0 $0.00 0.0% 2,157 $183,805,582.82 100.0% 327 $30,271,020.19 16.8%
Use of Other Residential Placements:
Inpatient Psychiatric Hospital 961 $10,985,172.17 44.6% 394 $2,427,597.16 18.3% 379 $4,077,338.18 17.6%
Group Home Level IV 87 $5,600,254.89 4.0% 36 $130,955.70 1.6% 38 $1,544,120.30 1.8%
Group Home Level III 711 $31,240,987.05 33.0% 506 $1,904,768.47 23.4% 421 $14,901,001.67 19.5%
Level II Group Home 60 $1,169,318.69 2.8% 26 $43,222.82 1.2% 51 $743,898.66 2.4%
Treatment Foster Care 498 $9,456,241.11 23.1% 394 $554,330.35 18.3% 429 $7,760,130.15 19.9%
Total Other Residental Placements $58,451,973.91 $5,060,874.50 $29,026,488.96
Use of Community-Based Services
Partial Hospitalization 8 $21,738.22 0.4% 4 $5,805.86 0.2% 10 $23,898.54 0.5% Day Treatment 457 $7,285,070.33 21.2% 295 $463,261.43 13.7% 326 $5,821,744.88 15.1% Multisystemic Treatment 76 $1,056,417.21 3.5% 22 $32,916.24 1.0% 56 $733,226.04 2.6% Intensive In-Home 549 $7,752,370.80 25.5% 340 $668,479.80 15.8% 456 $5,784,834.40 21.1% Community Support 1,447 $8,758,824.44 67.1% 1,396 $2,713,214.23 64.7% 772 $2,389,221.71 35.8% Outpatient Therapy 1,450 $2,754,918.98 67.2% 1,390 $1,611,745.01 64.4% 1,141 $1,655,289.45 52.9%
Substance Abuse Services 688 $1,267,921.36 31.9% 478 $320,971.58 22.2% 502 $660,989.30 23.2%
Clinical Assessment 1,406 $890,179.04 65.2% 733 $220,170.38 34.0% 944 $390,217.23 43.8%
Crisis/Mobile Crisis/Respite Care 309 $233,570.36 14.3% 56 $22,692.61 2.6% 144 $117,912.42 6.7%
Total Community-Based Services $30,021,010.74 $6,059,257.14 $17,577,333.97
Grand Total $88,472,984.65 $190,419,170.31 $76,874,843.12
Service Categories Pre-Admission
(N = 1,884) During PRTF Stay (N = 2,157) Post-PRTF Discharge and Readmitted (N = 327)
Mean Range Mean Range Mean Range Age 13.97 5-19 13.04 5-18 14.12 5-19 N % $ N % $ N % $ Gender Male 1,115 60.9% 159 48.6% 683 59.3% Female 715 39.1% 168 51.4% 469 40.7% Race Black 604 33.0% 106 32.4% 389 33.8% White 1,087 59.4% 199 60.9% 673 58.4% Native American 23 1.3% 3 0.9% 15 1.3% Other or Unknown 116 6.3% 19 5.8% 75 6.5% Primary Diagnosis Anxiety 33 1.8% 6 1.8% 21 1.8% Bipolar 504 27.5% 88 26.9% 311 27.0% Disruptive Behavior 809 44.2% 143 43.7% 513 44.5% Depression 122 6.7% 26 8.0% 79 6.9%
PDD (Autism and Rett's) 24 1.3% 8 2.4% 16 1.4%
Reactive Attachment Disorder 64 3.5% 12 3.7% 41 3.6%
PTSD/Trauma 181 9.9% 31 9.5% 108 9.4% Schiz/Psychotic 39 2.1% 7 2.1% 24 2.1% Sexual Disorder 12 0.7% 0 0.0% 9 0.8% Substance Abuse 21 1.2% 0 0.0% 13 1.1% Other 21 1.1% 6 1.8% 17 1.5% Number of Diagnoses 1 1,344 73.4% 256 78.3% 905 78.6% 2 232 12.7% 17 5.2% 112 9.7% ≥3 254 13.9% 54 16.5% 135 11.7% Use of PRTF by Location: In State 1,235 67.5% $98,165,100.43 257 78.6% $39,527,689.98 826 71.7% $67,016,507.53 Border 565 30.9% $55,578,826.38 64 19.6% $14,316,051.22 305 26.5% $31,159,171.62 Out of State 30 1.6% $4,701,697.72 6 1.8% $1,787,237.28 21 1.8% $3,124,586.44 Total PRTF 1,830 100.0% $158,445,624.53 327 100.0% $55,630,978.48 1,152 100.0% $101,300,265.59
Use of Other Residential Placements:
Inpatient Psychiatric Hospital 986 53.9% $12,172,998.97 244 74.6% $5,169,223.96 606 52.6% $7,425,703.91
Group Home Level IV 99 5.4% $5,908,394.14 28 8.6% $1,366,936.75 77 6.7% $4,315,083.45
Group Home Level III 815 44.5% $39,856,423.09 186 56.9% $8,121,687.50 574 49.8% $27,675,122.72
Level II Group Home 99 5.4% $1,834,942.27 13 4.0% $121,497.90 68 5.9% $1,076,245.27
Treatment Foster Care 663 36.2% $15,428,792.08 139 42.5% $2,341,909.53 425 36.9% $9,619,865.73
Total Other Residental Placements $75,201,550.55 $17,121,255.64 $50,112,021.08
Use of Community-Based Services
Partial Hospitalization 14 0.8% $35,510.26 5 1.5% $14,582.16 8 0.7% $13,231.96 Day Treatment 572 31.3% $11,079,512.85 134 41.0% $2,490,563.79 368 31.9% $7,337,026.65 Multisystemic Treatment 114 6.2% $1,612,261.29 17 5.2% $210,298.20 78 6.8% $1,149,157.41 Intensive In-Home 772 42.2% $12,094,520.20 149 45.6% $2,094,898.20 475 41.2% $7,508,371.80 Community Support 1,580 86.3% $11,332,083.39 309 94.5% $2,518,798.78 1,079 93.7% $7,472,815.61 Outpatient Therapy 1,689 92.3% $5,095,162.93 303 92.7% $922,584.13 1,048 91.0% $2,837,710.77 Substance Abuse Services 1,012 55.3% $1,871,969.29 181 55.4% $374,169.89 595 51.6% $1,231,276.35 Clinical Assessment 1,608 87.9% $1,254,925.94 300 91.7% $245,092.38 1,025 89.0% $727,794.29 Crisis/Mobile Crisis/Respite Care 371 20.3% $293,581.53 96 29.4% $80,593.86 213 18.5% $172,380.09
Total Community-Based Services $44,669,527.68 $8,951,581.39 $28,449,764.93
Grand Total $278,316,702.76 $81,703,815.51 $179,862,051.60
N Mean Total Cost N Mean Total Cost N Mean Total Cost
1,830 $152,085.63 327 $249,858.76 1,152 $156,130.25
Youth Characteristics and Services PRTF Single Admission(N =1,830)
PRTF Discharged and Re-Admitted (N =327) PRTF Discharged and Not Readmitted (N=1,152)
# Units Total $
Mean $
per Unit # Units Total $
Mean $
per Unit # Units Total $
Mean $
per Unit # Units Total $ Use of PRTF by Location:
In State 75,033 $36,221,311.49 $482.74 101,167 $45,726,693.88 $451.99 124,762 $55,744,785.04 $446.81 300,962 $137,692,790.41
Border 30,226 $11,310,575.35 $374.20 52,594 $19,331,417.13 $367.56 108,010 $39,252,885.12 $363.42 190,830 $69,894,877.60
Out of State 5,342 $2,142,798.78 $401.12 5,871 $2,413,486.63 $411.09 4,587 $1,932,649.59 $421.33 15,800 $6,488,935.00
Total PRTF 110,601 $49,674,685.62 159,632 $67,471,597.64 237,359 $96,930,319.75 507,592 $214,076,603.01
Use of Other Residential Placements:
Inpatient Psychiatric Hospital 12,367 $5,712,960.89 $461.95 13,707 $6,291,881.82 $459.03 12,201 $5,485,264.80 $449.58 38,275 $17,490,107.51
Group Home Level IV 11,814 $4,006,782.34 $339.16 8,172 $2,611,151.96 $319.52 2,459 $657,396.59 $267.34 22,445 $7,275,330.89
Group Home Level III 98,098 $23,744,125.26 $242.04 66,135 $15,614,892.38 $236.11 37,368 $8,687,739.55 $232.49 201,601 $48,046,757.19
Level II Group Home 3,564 $484,796.54 $136.03 5,391 $704,103.68 $130.61 5,955 $767,539.95 $128.89 14,910 $1,956,440.17
Treatment Foster Care 51,062 $4,871,313.90 $95.40 69,127 $6,316,193.94 $91.37 72,831 $6,583,193.77 $90.39 193,020 $17,770,701.61
Total Other Residential 176,905 $38,819,978.93 162,532 $31,538,223.78 130,814 $22,181,134.66 470,251 $92,539,337.37
Use of Community-Based Services
Partial Hospitalization $0.00 $1,350.20 $50,092.42 $51,442.62 Day Treatment $4,608,921.06 $5,118,344.94 $3,842,810.64 $13,570,076.64 Multisystemic Treatment $453,438.00 $682,060.29 $687,061.20 $1,822,559.49 Intensive In-Home $1,837,867.60 $5,860,729.20 $6,507,088.20 $14,205,685.00 Community Support $7,819,750.80 $4,951,998.79 $1,089,510.79 $13,861,260.38 Outpatient Therapy $1,610,626.16 $1,499,565.54 $2,911,761.74 $6,021,953.44
Substance Abuse Services $748,927.35 $708,035.48 $792,919.41 $2,249,882.24
Clinical Assessment $465,528.82 $545,330.17 $489,707.66 $1,500,566.65
Crisis/Mobile Crisis/Respite Care $102,366.16 $118,908.50 $152,900.73 $374,175.39
Total Community-Based Services $17,647,425.95 $19,486,323.11 $16,523,852.79 $53,657,601.85
Use of Prescription Drugs $9,400,387.16 $9,950,691.84 $10,912,092.10 $30,263,171.10
Grand Total $115,542,477.66 $128,446,836.37 $146,547,399.30 $390,536,713.33
Service Categories FY2009
(N = 752) FY2010 (N = 1,043) FY2011 (N = 1,410) TOTAL YOUTH (N = 2,157)
Mean Range Mean Range Mean Range Mean Range Age 13.50 5-18 14.61 5-19 13.92 9-19 13.83 5-19 N % N % N % N % Gender Male 886 59.4% 361 57.4% 27 75.0% 1,274 59.1% Female 606 40.6% 268 42.6% 9 25.0% 883 40.9% Race Black 513 34.4% 188 29.9% 9 25.0% 710 32.9% White 867 58.1% 396 63.0% 23 63.9% 1,286 59.6% Native American 19 1.3% 6 1.0% 1 2.8% 26 1.2% Other or Unknown 93 6.2% 39 6.2% 3 8.3% 135 6.3% Primary Diagnosis Anxiety 28 1.9% 10 1.6% 1 2.8% 39 1.8% Bipolar 392 26.3% 188 29.9% 12 33.3% 592 27.4% Disruptive Behavior 669 44.8% 272 43.2% 11 30.6% 952 44.1% Depression 103 6.9% 44 7.0% 1 2.8% 148 6.9%
PDD (Autism and Rett's) 13 0.9% 17 2.7% 2 5.6% 32 1.5%
Reactive Attachment Disorder 65 4.4% 9 1.4% 2 5.6% 76 3.5%
PTSD/Trauma 152 10.2% 56 8.9% 4 11.1% 212 9.8% Schiz/Psychotic 30 2.0% 13 2.1% 3 8.3% 46 2.1% Sexual Disorder 2 0.1% 10 1.6% 0 0.0% 12 0.6% Substance Abuse 13 0.9% 8 1.3% 0 0.0% 21 1.0% Other 25 1.7% 2 0.3% 0 0.0% 27 1.3% Number of Diagnoses 1 1,028 68.9% 541 86.0% 31 86.1% 1,600 74.2% 2 213 14.3% 35 5.6% 1 2.8% 249 11.5% ≥3 251 16.8% 53 8.4% 4 11.1% 308 14.3% Total (N = 2,157) Youth Characteristics by PRTF Location (FY2009-2011)
Youth Characteristics and Service Use In State (N = 1,492)
Border (N = 629)
Out of State (N=36)