http://www.sciencepublishinggroup.com/j/ajomis doi: 10.11648/j.ajomis.20180304.12
ISSN: 2578-8302 (Print); ISSN: 2578-8310 (Online)
Queuing Theory and Its Application Analysis on Bus
Services Using Single Server and Multiple Servers Model
Maryam Abubakar Koko
1, Muhammad Sani Burodo
2, Shamsuddeen Suleiman
3, *1
Department of Business Administration, Usmanu Danfodiyo University, Sokoto, Nigeria
2
Department of Business Administration and Management, Federal Polytechnic, Kaura Namoda, Nigeria
3
Department of Mathematics, Usmanu Danfodiyo University, Sokoto, Nigeria
Email address:
*Corresponding author
To cite this article:
Maryam Abubakar Koko, Muhammad Sani Burodo, Shamsuddeen Suleiman. Queuing Theory and Its Application Analysis on Bus Services Using Single Server and Multiple Servers Model. American Journal of Operations Management and Information Systems.
Vol. 3, No. 4, 2018, pp. 81-85. doi: 10.11648/j.ajomis.20180304.12
Received: December 3, 2018; Accepted: December 14, 2018; Published: January 2, 2019
Abstract:
This research work is based on queuing theory and its application analysis on bus services using single server and multiple servers’ models, a case study of Federal Polytechnic transport system, Kaura Namoda. The aim of this paper is to compare the parameters of single server and multiple servers’ models. Primary data was employed using observation method in the course of conducting this research. The data was analyzed, using manual computations to validate the results. The research revealed that the traffic intensity, average number of customers in the system, average number of customers in the queue, average time spent in the system, Average time spent in the queue of a single server and multiple servers are 0.9355,14.5, 13.5645,0.25, 0.2339 and 0.4677, 1.1974, 0.2619, 0.0206,0.0045 respectively. This therefore indicates that the multiple servers’ model is more efficient than single server model as it minimizes these parameters. It is therefore recommended that the management should provide more school buses in order to reduce the traffic congestion.Keywords: Servers, Queue, Service Rate, Arrival Rate, Exponential Distribution and Poisson Distribution
1. Introduction
Promoting the use of public transit can be an effective way to reduce urban traffic congestion, fossil fuel depletion, and greenhouse gas emissions. In many cities of the world, however, the service quality of transit, especially bus systems, is very poor, which discourages travelers from choosing this more sustainable mode. A major cause of this poor service quality is that buses often experience severe congestion at busy bus stops.
While serving passengers at a bus stop, buses can interact in ways that limit bus discharge flow from the stop and create large bus delays. This can significantly degrade the bus system’s overall service quality [1-3]. Moreover, the disruptive bus maneuvers at these stops will often impede adjacent car traffic, and thus create more congestion. Hence, an important question in bus system planning is: how should one design a busy bus stop and manage bus operations in and
around the stop to increase the rate that buses can discharge from the stop, and to mitigate the induced bus and car congestion?
out by [6].
Consequently, in an attempt to acquire vehicles to enable individuals travelling faster and carry out daily activities easily, cities in the world now witness tremendous motorization, especially since 1988 global car population have exceeded 400 million [7]. The reason for this phenomenon is that in both the Transportation "currently accounts for 23 percent of the world's greenhouse-gas emissions," and according to Brad Plumer who writes at the Washington Post “and most of that unconventional oil is significantly dirtier, from a CO2 perspective, than the traditional stuff [8]. If people in the developing world keep buying vehicles then simple upgrades in fuel-efficiency alone are not going to be enough to stop a steady uptick in global temperatures [9].
2. Literature Review
Traffic congestion using Queuing Theory to Vehicular Traffic at Signalized Intersection in Kumasi-Ashanti Region, Ghana were modeled. The results showed that traffic intensity, ρ<1 for all sessions, a condition that suggests a perfect traffic system. Consequently, smooth flow of traffic was shown since the server at each channel was able to serve more than the cars in waiting queue when servers resume work. Again, it was found that heavy traffic occurs in the evening. Stakeholders can task Motor Traffic Transport Unit (MTTU) to check that drivers desist from such practices so that there will be free flow of traffic in the evening and also promote the use of bikes, which apart from serving as a form of exercise also helps to reduce fuel consumption thereby saving money for the Government to tackle problem of other sectors of the economy. Finally, the government of Ghana could introduce a public transport system so that people do not travel with private cars to their places of work to reduce congestion on the roads, which in turn boosts productivity [10].
Queuing model was applied to assess the performance of Multi-Channel Multi-Servers Motor Spirit Filling Station. The performance measure of this adopted queue model was carried out to be able to know numbers of customers waiting in the queue and in the system, waiting time of the customers in the queue and in the system as well as the utilization factor for the servers in this case study. Based on this, management decision was taken from the revelation of the performance assessment of this filling station and policy for running this filling station was formulated. Application of this adopted queue model by using data collected from Nigeria National Petroleum Corporation (NNPC) Mega Station revealed that as number of servers increases, customers’ average arrival rate decreases; increase in average service rate reduces the average waiting time in this system; as average customer in the system reduces so also average customers in the queue. Also as the probability of the system being busy reduced, the probability of idleness increases. The case study is using 7 attendants presently, which gave utilization factor of 32% bringing the idleness probability to 68%. Though service rate
increases while the system and queue time reduces; queue formed in the system was negligible. The calculated mean for the servers’ utilization factor is 0.46 (46%) as concerned this study. The 0.47 (47%) obtained is closest to this value and hence selected as the minimum benchmark. This minimum benchmark of 47% was to select the number of attendant required for this system. At utilization of 0.682 and idleness of 0.292, 3 attendants will be required. The waiting time in the system Ws = 0.20 hr, waiting time on the queue Wq = 0.13 hr, average customers’ queue Lq = 1, service rate µ = 15 with arrival rate of 10 customers per hour. The selected number of attendant is five (5). Incentives can be given to create overtime that will increase the utilization factor of these five attendance. Any value below this benchmark is not encouraged for this system [11].
The problem of optimizing traffic light phases on signal-controlled road intersections was mathematically formulated and solved. The flow of vehicles on multi-lane roads is described by Poisson processes. In this paper the concept of the effective number of lanes is used which indicates the maximum flow of cars with different modes of traffic lights. Methods of queuing theory helped to obtain explicit solutions of the problem of minimizing delays at signal-controlled road intersection [12].
Queuing theory was employed to model tobacco supply, This research used PT XYZ which supplies dried tobacco (chopped Madura) of the local name tobacco collectors as known as bandol. The queues were quite long and bandol experiencing frequent obscurity of time to be served during the waiting time shortage and obscurity. This has an impact on the cost and time to bandol. Therefore, this research aims are (1) to obtain a supply of tobacco queuing system (2) to obtain a proper queuing system in the supply of tobacco (3) to obtain a minimal cost to the queuing system in the supply of tobacco.
Data analysis was performed according to the queuing models in the PT XYZ. The results of the study are (1) queuing systems in the form PT XYZ path queuing system with a multiple channel, the waiting time to be served short enough that 0.003 minutes, the average time of 2.877 minutes in the system, the queue length 0.0006 unit of transportation service is equivalent to one unit of transportation, long queues in the system are 0.605 units of transportation that equal to 21units of transportation (2) the actual occurrence of a long queue outside the queuing system, because the transportation carrying tobacco wants to earn their turn to enter the warehouse and immediately served (3) minimal costs for bandol incurred amounted to Rp 450,000.00 for one unit of transportation (pick up) that it brought 2 workers. Minimal costs incurred amounted to Rp 700,000.00 for other unit of transportation (truck) that it brought two workers to the difference in labour and rental costs [13].
3. Methodology
model.
Some of the assumptions made on the system include: i. Single channel queue
ii. There is an infinite population from which customers originate.
iii. The waiting areas of customer is adequate iv. Exponential distribution of service time v. Poisson arrival (Random arrival)
vi. Arrival in groups at the same time (Bulk arrival is treated as a single arrival
vii. The queue discipline is first come first served (FCFS) Queuing theory model has two types of model under it which include the multiple servers and single models.
Queuing theory model has two types of models under it which include the multiple servers and single server model.
3.1. Single Server Queuing Model
This model is based on the following assumptions:
i. The arrival follow Poisson distribution with a mean arrival rate
ii. The service time has exponential distribution, average service rate µ.
iii. Arrival are infinite population a
iv. customer are served on a first in, first out basis (FIFO) v. There is only a single server.
Line, single – phase system, the following assumptions are made when we model this environment:
i. The customers are petie (No balking, reneging, or jockeying) and come from population that can be considered infinite.
ii. Customer arrivals are described by a Poisson distribution with a mean arrival rate of λ (Lamda). This means that the time between successive customers arrivals follow an exponential distribution with an average of 1/λ.
iii. The customer service rate is described by a Poisson distribution with a mean service rate of µ. This means that the service time for one customer follows an exponential distribution with an average of 1/µ.
iv. The waiting time line priority rate used is first – come, first – serve.
Using these assumptions, we can calculate the operating characteristics of a waiting line system using the following formula:
λ = mean arrival rate of customer (average number of customers arrival per unit of time)
µ = means service rate (average number of customer that can be served per unit of time)
P = = the average utilization of the system.
LQ = = the average number of customer in the service
system.
LQ = Pl = the average number of customers waiting in line.
3.2. Multiple Servers Queuing Model
Mean customers arrival rate=
λ
Mean customers service rate=
µ
Utilization factor, P =
λ
µ
Probability of zero customers in the system,
Po = 1
∑ ( ! ) + ( ! ) ∙
( )
Probability of having n customers, Pn = (1 – P)Pn
Average number of customers in the system, Lq = Lq +
λ
µ
Average number of customers in the queue, Lq = !(( ))
Average time spent in the system, Ws = Wq +
µ
Average time spent in the queue, Wq =
λ
4. Results and Discussion
1) Analysis of the parameters of the queuing model for the Monday congestion
Number of servers=1
Mean customers arrival rate, λ = 25 per trip. Mean service rate, µ = 32 per trip
Utilization factor, P = = 0.7813
Probability of having zero students in the system, P(0) = 1 – P = 0.2187
Average number of students in the system,
Ls =
λ
= 3.5714 studentsAverage number of students in the queue,
Lq = Ls -
λ
=2.7901Average time spent in the system, Ws = = 0.1429
Average time spent in the queue, Wq = = 0.1116
2) Analysis of the parameters of the queuing model for the Tuesday congestion.
Number of servers=1
Mean customers arrival rate, λ = 29 per trip. Mean service rate, µ = 32 per trip
Utilization factor, P = = 0.9063
Probability of having zero students in the system, P(0) = 1 – P = 0.0937 students
Average number of students in the system,
Ls =
λ
= 9.6667 studentsAverage number of students in the queue,
Lq = Ls -
λ
=8.7604Average time spent in the system, Ws = = 0.3333
Average time spent in the queue, Wq = = 0.3021
Wednesday congestion. Number of servers=1
Mean customers arrival rate, λ = 58 per trip. Mean service rate, µ = 62 per trip
Utilization factor, P = = 0.9355
Probability of having zero students in the system, P(0) = 1 – P = 0.0645
Average number of students in the system,
Ls =
λ
= 14.5Average number of students in the queue,
Lq = Ls -
λ
=13.5645Average time spent in the system, Ws = = 0.25
Average time spent in the queue, Wq = = 0.2339
Table 1. Comparison of the Parameters of the m/m/i Model for the Three Days.
Parameters Monday Tuesday Wednesday
λ
25 29 58Μ 32 32 62
P 0.7813 0.9063 0.9355
P(0) 0.2187 0.0937 0.0645
Ls 3.5714 9.6667 14.5
Lq 2.7901 8.7604 13.5645
Ws 0.1429 0.3333 0.25
Wq 0.1116 0.3021 0.2339
Table 2. Comparison of the Single Server Model with a Proposed Multi-Server Model.
Parameters m/m/1 m/m/2
λ
58 58Μ 62 62
P 0.9355 0.4677
P(0) 0.0645 0.3626
Ls 14.5 1.1974
Lq 13.5645 0.2619
Ws 0.25 0.0206
Wq 0.2339 0.0045
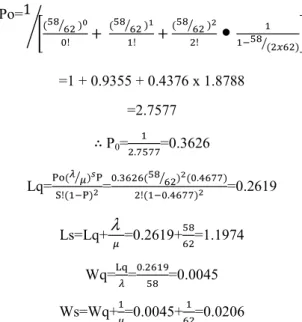
MULTI-SERVER MODEL (m/m/2)
λ
=58,µ=62P= =P= #$ !" =!" %=0.4677
Po= 1
∑ ( )
! + ( )
! ∙ ( )
Taking the denominator
Po=1
∑ ( ! ) + ( ! ) ∙
( )
S=2, n=0,and n=1
Po=1
(!" $ )&
! + (!" $ )
'
! +(!" $ ) !
•
!"( #$ )=1 + 0.9355 + 0.4376 x 1.8788
=2.7577
∴ P0= .*!**=0.3626
Lq= !(( )) = .+$ $(!" $ ) ( .%$**) !( .%$**) =0.2619
Ls=Lq+
λ
=0.2619+!"$ =1.1974Wq= = . $ ,!" =0.0045
Ws=Wq+ =0.0045+$ =0.0206
From table 2 above, the result has shown that the efficiency parameters under two different queuing models. The traffic intensity has reduced significantly from 93.55% to 46.77%. This shows that as more servers (school bus) are introduced, then the bus stop becomes less busy; this may attract more students.
5. Conclusions
In case of the school bus stop selected as a case study, the results throw light on some important issue about the operation mode of the waiting line. The students have to wait on Monday, Tuesday and Wednesday at an average of 0.1429 mins, 0.3333 mins and 0.25 mins respectively in the system. The average numbers of students who have to wait are 2.7901, 8.7604 and 13.5645. And 78.13% and 93.55% on Monday, Tuesday and Wednesday respectively of arriving students have to wait to be served. The results show that there is a need to improve the operators that occur within the waiting line. If the school management continues to provide few buses to operate at the bus stop, the number of waiting students will increase. In a note shell, there is need to improve the serve rate.
References
[1] Fernandez, R., 2010. Modelling public transport stops by microscopic simulation. Transportation Research Part C: Emerging Technologies 18(6), 856-868.
[2] Fernandez, R., Planzer, R., 2002. On the capacity of bus transit systems. Transport Reviews 22(3), 267-293.
[3] Gibson, J., Baeza, I., Willumsen, L. G., 1989. Bus stops, congestion, and congested bus stops. Traffic Engineering and Control 30(6), 291-302.
[5] Intikhab, QA., Huapu, L., & Shi Y. (2008). Urban Transportation and Equity: A Case Study of Beijing and Karachi. In Transportation Research Part A: Policy and Practice, 42: 1.
[6] Wane, H. R. (2001). Urban Mobility and Emissions : Towards Accurate Standards for Sub-Saharan Africa. A ResearchProgram and Results on a Sahelian Case: The District of Bamako. At the Session on Air Pollution, Accra, Ghana, April 18-20, 2001. Retrieved November 03, 2008http://www.worldbank.org/transport/utsr/accra/wane.pdf. [7] Walsh, M. (1990). Global Trends in Motor Vehicle use and
Emissions. In Annual Review of Energy, Volume 15, pp. 217-243.
[8] Dimitriou, HT. (1990). Transport Planning for Third World Cities. Editor Routelege, Chapman and Hall, Inc., 1990. 432 pp. + xxii. ISBN 0-415-00448-9.
[9] Tencer, Daniel (2011). Number Of Cars Worldwide Surpasses 1 Billion; Can The World Handle This Many Wheels?
Retrieved February 07, 2013 from
http://www.huffingtonpost.ca/2011/08/23/car-population_n_934291.html.
[10] Anokye M., Abdul Aziz A. R., Annin K. and Oduro F. T. (2013) Application of Queuing Theory to Vehicular Traffic at Signalized Intersection in Kumasi-Ashanti Region, Ghana, American International Journal of Contemporary Research, 3.(7), 23-29.
[11] Akinnuli B. O. and Olugbade T., (2014) Application of Queue Model for Performance Assessment of Channel Multi-Servers Motor Spirit Filling Station, International Journal of Engineering and Innovative Technology (IJEIT), 3(7), 74-81. [12] Babicheva T. S.(2015). The use of queuing theory at research
and optimization of traffic on the signal-controlled road intersections, Procedia Computer Science, 55 , 469 – 478. [13] Arifin M. Z., Probowati B. D., Hastuti S., (2015). Applications
of Queuing Theory in the Tobacco Supply, Agriculture and Agricultural Science Procedia , 255 – 261.