Investigation the Relationship among Mobile Value-added Services Quality, Customer Satisfaction and the Continuance Intention:
Case Study, Hamrah Avval Operator
Dr. A. Ansari Assistant Professor
Faculty of Administrative Sciences Economics University of Isfahan, Iran
A. Kheirabadi
Master Student of (MBA-marketing) Isfahan University, Iran azadehkheirabadi@gmail.com
S. Ghalamkari
PhD. Student of Shakhes Pajouh Institute, Isfahan, Iran
Shermineh.Ghalamkari@gmail.com
A. R. Khanjari
Master Student of (MBA-strategic), Science and Research Campus Islamic Azad University
Khanjari.alireza@gmail.com
Abstract
Understanding the antecedents and consequences of customer satisfaction in the mobile communications market is important. This study explores the effects of service quality, trust and perceived value on customer satisfaction, which, in turn, affects continuance intention of mobile services. Service quality and customer satisfaction were measured by multiple dimensions. A research model was developed based on this multidimensional approach and was empirically examined with data collected from about one 237 users of mobile value-added services in Tehran university. Results show that all two dimensions of service quality (interaction quality and outcome quality) and perceived value have significant and positive effects on customer satisfaction while only one dimension of service quality (environment quality) and trust have no effect on customer satisfaction.
Keywords: service quality, trust, perceived value, customer satisfaction, continue intention
Introduction
new revenue sources (Anita et al., 2007; Olsen and Johnson, 2003). The telecommunication industry regularly mounts campaigns to improve customer value by offering new products to existing customers. In response, the industry is shifting its strategic focus away from attracting new customers. Instead, the focus is now on retaining existing customers through the promotion of customer loyalty.
Mobile value-added services are digital services added to mobile phone networks other than voice services in which the contents included can be either self-produced by mobile telecom service providers or provided through strategic alliances with content providers. These services include games, icons, ringtones, messages, web browsing, SMS (short message service) coupons, and electronic transaction. They can bring five values to consumers: time-critical needs and arrangement, spontaneous needs and decisions, entertainment needs, efficiency needs and ambitions, and mobility-related needs (Anckar and D‘Incau, 2002). Thus, mobile value-added services will become new opportunities for telecom service providers. However, mobile value-added services provided by telecom service providers can be classified into four types, namely information, communication, transaction, and entertainment, and this classification applies to almost all the providers. Although new services are being released at all times, whether they are appealing to consumers and can induce positive post-purchase intention after consumers have used them so as to effectively increase revenue and sustainable development will be an important issue for telecom service providers.
Moreover, as new mobile value-added services are released, service providers need to focus on if these new services appeal to customers and on the willingness of customers to continue to use the services. Therefore, understanding the antecedents and consequences of customer satisfaction in regard to mobile value-added services is important. This study aims to investigate three factors that are closely related to customer satisfaction, service quality, trust and perceived value. Although they are frequently investigated in service marketing and customer behavior research, these three factors are rarely examined at the same time in information technology (IT) use studies.
In summary, the contributions of this study are threefold. First, we incorporate three factors (service quality, trust and perceived value) that have been rarely investigated together in technology adoption/acceptance studies into our research model and then examine their possible influence on customer satisfaction and continue intention.
Literature review Service quality
subsequent service marketing studies. Subsequent studies, however, suggested the limitations of the SERVQUAL instrument (Van Dyke et al., 1997), thus leading to the emergence of several alternative instruments. Rust and Oliver (1994) recommended a three-component service quality model and proposed that service quality should be measured by three dimensions, i.e., service product, service delivery and service environment. Dabholkar et al. (1996) suggested a multilevel model in which service quality is assessed by five primary dimensions (physical aspects, reliability, personal interactions, problem solving, and policy) and six sub-dimensions (appearance, convenience, promises, doing it right, inspiring confidence, and being courteous and helpful). They found support for the model by conducting empirical tests. Brady and Cronin (2001) constructed a hierarchical model to measure service quality. In their model, service quality has three dimensions (i.e., interaction quality, physical environment quality and outcome quality) and each of these primary dimensions has three sub-dimensions, including attitude, behavior, and expertise for interaction quality; ambient conditions, design, and social factors for physical environment quality; waiting time, tangibles and valence for outcome quality. Through qualitative and empirical research, they obtained strong support that their multidimensional, hierarchical model measured service quality. Many subsequent studies on service quality, both in the physical and virtual environments, have used this three-dimensional model and found strong supporting evidence (Caro and García, 2008, Lu et al., 2010).All these studies indicate that the measurement of service quality varies across the type of service.
More recently, based on Brady and Cronin's (2001) model, Lu et al. (2010) developed a multidimensional and hierarchical model to measure mobile service quality. They proposed that mobile service quality was composed of three primary dimensions, interaction quality, environment quality and outcome quality, and each primary dimension further included sub-dimensions. An instrument was developed and empirically tested using data collected from mobile brokerage service users. Strong empirical support for the model and the instrument was obtained (Lu et al., 2010). In our study, we use multidimensional model of mobile service quality proposed by Lu et al. (2010). We chose this model because it was developed in a mobile services context and it was shown to be empirically valid.
According to Lu et al. (2010), interaction quality reflects the ―quality of a customer's interaction with the mobile service provider during the service delivery‖ (Lu et al., 2010). This dimension consisted of attitude, expertise, problem solving and information. Environment quality refers to the consumer's evaluation of the quality of equipment that is used, the extent to which the interface is well designed, and the extent to which the service is delivered under proper contexts. Outcome quality was defined as ―what the customer is left with when the production process is finished (Grönroos, 1984)‖. Many studies have shown that outcome quality significantly affected the perceived service quality (Carman, 1990; Fullerton, 2005; Grönroos, 1984; Rust and Oliver, 1994).
Interaction Quality
research has shown that interaction quality has the most significant effect on service quality (Grönroos, 1984; Hartline and Farrell, 1996). The interaction quality consists of such sub-dimensions as attitude, expertise, problem solving, and information. Gronroos (1990) pointed out that employee attitude and skills influenced customers‘ perception of service quality. Czepiel et al. (1985) suggested that the attitude and skills of service employees defined service quality. Similarly, both Brady and Cronin (2001) and Martinez Caro and Martinez Garcia (2007) included attitude and expertise as sub-dimensions of interaction quality. In addition to attitude and expertise, the problem solving is sub-dimension because it was shown as being important by previous research. Westbrook (1981) posited that consumers were concerned about the handling of problems and complaints during the interaction process. Similarly, other authors (Kim and Jin, 2002; Caro and García, 2008) pointed out that problem solving was not separate from but rather part of the interaction quality. Also information is sub-dimension because mobile brokerage service was an information service and what consumers wanted was up-to-date and accurate financial market information while they were on the go.
Moreover, much research on e-commerce has suggested the importance of information when Internet users interact with e-service websites (Jiang et al., 2002; McKnight and Chervany, 2002). Similarly, Martinez Caro and Martinez Garcia (2007) also identified information as a sub dimension of service quality.
Environment Quality
Outcome Quality
The third dimension is outcome quality, which is similar to the technical quality Gronroos (1984) proposed. Many marketing researchers have shown that outcome quality significantly affected the perceived service quality (Carman, 1990; Fullerton, 2005; Grönroos, 1984; Rust and Oliver, 1994). Literature reviews revealed that three factors influenced the perceived outcome quality: punctuality, tangibles, and valences. Parasuraman et al. (1985) pointed out that consumers considered service punctuality as an important part of their overall service quality evaluation. Houston et al. (1998) also argued that waiting time, which was similar to punctuality, was an important predictor of service quality. Moreover, researchers such as Brady and Cronin (2001) and Martinez Caro and Martinez Garcia (2007) had shown that punctuality was one of the sub-dimensions of outcome quality. In addition, Kleijnen et al. (2007) emphasized on the concept of time consciousness, which was an inherent personality characteristic. The more time conscious a consumer is, the more sensitive she will be (Kleijnen, 2007). That is, a more time conscious consumer views punctuality as being more important. Thus, punctuality will influence the evaluation of the outcome quality. Following Brady and Cronin (2001), tangibles is as an important factor affecting the outcome quality. It was used as a proxy for assessing the outcome quality. The last sub-dimension of valence is also based on Brady and Cronin (2001). It reflects ‗‗attributes that control whether customers believe the service outcome is good or bad, regardless of their evaluation of any other aspect of the experience‖ (Cronin et al., 2000).
Perceived Value
According to Parasuraman and Grewal (2000), perceived value is a function of a ‗get‘ component (the benefits a buyer derives from a seller‘s offering) and a ‗give‘ component (the buyer‘s monetary and non-monetary costs of acquiring the offering).
carrying particular meanings (such as social economic status and social culture) can increase the effect of social self-concept (Sweeney and Soutar, 2001; Wang et al., 2004). In this study, perceived value is the evaluation of the benefits of a product or a service by customers based on their advance sacrifices and expost perceived performance when they use mobile value-added services.
Trust
In prior research, trust has been conceptualized in several ways; researchers have long acknowledged this confusion. Trust has often been studied in the electronic commerce context. According to McKnight and Chervany (2002), trust can be viewed as trusting belief and trusting intention. Trusting belief refers to the users‘ perceptions of attributes of service providers, including the ability, integrity, and benevolence of the providers; trusting intention describes the truster‘s willingness or intention to depend on the trustee. Therefore, trusting intentions include a one-time or continuous usage of value added services. In both the electronic commerce and mobile commerce context, customers cannot fully regulate the business agreement; thus it is necessary for them to rely on the service providers not to engage in unfair and opportunistic behavior (Gefen, 2002). Seen as a considerably important factor for building and maintaining relationships, trust is viewed as a main part of the success of electronic commerce (Lee and Turban, 2001), as well as of mobile commerce (Siau and Shen, 2003). In this context, mobile phone users must provide personal information, such as their phone numbers, in order to become subscribers. They will also send messages to their friends. In the experience of usage, if customers perceive no risks or unexpected conditions that will impair their communications from the service or the service provider, trust will be built. When a customer trusts a service provider, he or she will expect to increase satisfaction and loyalty towards the vendor (Kassim and Abdullah, 2008). In general, if a consumer does not trust the provider based on past experience, he or she will probably be dissatisfied with that provider. Researchers found that trust will affect satisfaction in the long term (Kim et al., 2009). When a customer‘s feeling of faith in the provider is satisfied, his satisfaction will be enhanced over time (Chiou and Droge, 2006).
Customer Satisfaction
Customer satisfaction is one of the issue which has been most interest in the marketing
In addition, the conceptualization of consumer satisfaction can be interpreted by focusing on a specific transaction or from an accumulative perspective. Most definitions in the literature correspond to the first approach (Giese and Cote, 2000; Mano and Oliver, 1993;Spreng et al., 1996) although some of the more recent contributions support the idea that satisfaction is ―a global measure of a set of satisfactions with previous specific experiences‖ (Yu and Dean, 2001). According to Jones and Suh (2000), defining satisfaction in this way provides a better explanation for behavioral intentions.
Research model and hypotheses
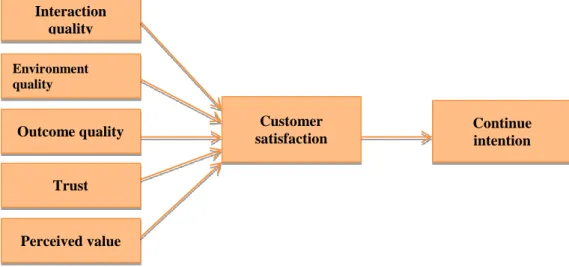
Based on the above literature review, we developed a research model as depicted in Fig. 1. In this study, service quality, trust and perceived value reflect customers‘ cognitive judgments with the consumption experience (Oliver and Swan, 1989; Smith and Bolton, 2002). Customer satisfaction reveals customers‘ affective responses to the consumption experience (Giese and Cote, 2000). Continuance intention refers to the future continuation of satisfied customers. Therefore, the research model generally hypothesizes that cognitive judgments (i.e., service quality, trust and perceived value) lead to customers‘ affective responses which, in turn, drive behavior (continuance intention). The hypotheses are presented below.
Relationship between service quality and customer satisfaction
The relationship between service quality and customer satisfaction has been studied extensively and ample positive evidence that "service quality significantly influences customer satisfaction" has been gathered (Bolton and Drew, 1991). In the traditional environment, Chiou and Drog (2006) found that the quality of interactive service provided by employees played a more important role in impacting customer satisfaction than facility service quality. Though in the context of mobile services, consumers may not meet with the service provider face to face, the interaction between the two parties occurring through the mobile device is still an important component in mobile service delivery. Thus, we may posit that a higher level of interaction quality will lead to a stronger sense of satisfaction toward the mobile value-added services. Thus, Hypothesis 1 is proposed as follows:
H1. Interaction quality positively affects customer satisfaction.
Previous research on mobile service also found empirical evidence for the positive relationship between environment quality and customer satisfaction. Thus, Hypothesis 2 is proposed as follows:
H2. Environment quality positively affects customer satisfaction.
Outcome quality is closely related to satisfaction as it also reflects a global assessment of the service quality based on customers‘ experiences. Dabholkar and Overby (1996) studied real estate agent services and found that outcomes were closely related to satisfaction, while process factors were closely related to service quality. Thus, outcome quality is positively related to customer satisfaction. In addition, as Cronin et al. (2000) pointed out, even if an individual had a positive assessment of other service quality dimensions, the negative valence of the outcome would result in an unpleasant experience. Thus, Hypothesis 3 is proposed as follows:
H3. Outcome quality positively affects satisfaction.
Relationship between perceived value and customer satisfaction
In the research of the relationships between perceived value and customer satisfaction, empirical studies of the conventional retailers discovered that perceived value positively influences customer satisfaction in most cases (Cronin et al., 2000; Eggert and Ulaga, 2002). A similar conclusion was also proposed in the studies of online shopping websites and e-commerce 39, 110. In the aspect of the telecom industry, Wang et al. (2004) (focusing the telecom industry in China), Tung (2004) (SMS service in Singapore), Lin and Wang (2006) (mobile commerce in Taiwan), and Turel and Serenko (2006) (mobile services in Canada) all revealed that perceived value is positively related to customer satisfaction. Thus, Hypothesis4 is proposed as follows:
H4. Perceived value positively influences customer satisfaction.
Relationship between trust and customer satisfaction
H5. Trust has a positive effect on customer satisfaction.
Relationship between customer satisfaction and post-purchase intention
Many studies of satisfaction have pointed out a positive relationship between customer satisfaction and post-purchase intention (Cronin et al., 2000; Johnson and Fornell, 1991). Consumers with a higher level of satisfaction tend to have a stronger intention to repurchase and recommend the purchased product (Zeithaml et al., 1996). In other words, when customer satisfaction is enhanced, repurchase can be more frequent. The extant studies of e-retailing and online shopping also provided the similar conclusions (Collier and Bienstock, 2006; Lee and Turban, 2001). Among the studies of the telecom industry, Gerpott, Rams, and Schindler (2001) and Tung (2004), respectively, examined the telecom industry in Germany and SMS service in Singapore. They also concluded that customer satisfaction is positively related to post-purchase intention. Moreover, other studies of the mobile services in Canada and China also supported this argument (Yang and Peterson, 2004; Wang et al., 2004). Thus, Hypothesis 6 is proposed as follows:
H6. Customer satisfaction positively influences post-purchase intention in mobile value-added services.
Figure 1. Research model
Methodology Measures
To measure the constructs in the research model, validated items by other researchers in the extant literature were adapted and multi-item scales were used. All items were modified to fit the mobile value-added services context. The measurement scales of interaction quality, environment quality, and outcome quality were adapted from Lu et al. (2010) and Brady and Cronin (2001). Each dimension of service quality was measured by three-item scales. The measurement scales for perceived value and trust were adopted from the services marketing literature. Perceived value was measured by three-item measures adapted from Cronin et al. (2000), Tung (2004), and Wang et al. (2004). These items were also modified in wording appropriate for mobile value- added services context. Trust was
Interaction quality
Environment quality
Customer satisfaction
Continue intention Outcome quality
Trust
measured by three-item measures adapted from Gefen et al. (2003). Customer satisfaction was measured by three-item measures taken from previous measures of the overall level of user satisfaction in mobile services (Chae et al., 2002; Lin and Wang, 2006). Lastly, the five items measuring continuance intention were taken from prior studies on repurchase intention in mobile services. Thus, a total of thirty-nine items were used to measure the constructs. For each item, a five-point Likert scale was used with anchors from ―1=strongly disagree‖ to ―5=strongly agree‖.
Sample
The main survey was conducted in a major university in Iran. University students at both undergraduate and graduate levels were selected as subjects for two reasons. First, according to a mobile value-added service survey report of 2007 released by Analyses, the age group of 16 to 30 was the primary group that used mobile value-added services, which is approximately 70.7% of the market share. If this age group was selected for sampling, the results could be representative to a certain degree of the population, thus enhancing the study's generalizability. Second, most researchers investigating customer behaviors with mobile services also selected this age group as their survey sample (Cho and Sung, 2007; Kuo et al., 2009).We chose students from several different schools in the same university as our sample. We then distributed the questionnaires to the students through classes that were randomly selected in each school. As the sample in our study was a convenience sample to some extent, we then compared major demographic characteristics and variable means of the samples from different schools to avoid potential sample bias. The results showed that there were no significant differences among the samples, indicating that we could conduct further analysis based on the combination of the full samples. A total of 262 questionnaires were distributed. After two weeks, 237 valid questionnaires had been returned.
Results Sample characteristics
Table 1. Demographics of survey respondents
measure option Frequency Percentage
Gender male 103 43.5
female 134 56.5
Age 18-20 73 30.8
21-25 146 61.6
26-30 18 7.6
Length of using mobilevalue-added
services
> 1year 89 37.6
>1year-2year 71 30
>2year 77 32.5
education >master degree 59 24.9
>bachelor 118 49.8
>diploma 60 25.3
Mobile services use SMS or MMS 37 15.6
E-Payment 68 28.7
Rooming 21 8.9
Ring tones 44 18.6
Urban Intelligent Software
12 5.1
Exchange software 4 1.7
Sudoku 17 7.2
Internet access 34 14.3
Reliability of the instrument
To test the reliability the instrument used in the study, Cronbach's alpha was used. As shown in Table 2, the alpha value of each factor was greater than the thresholds, indicating that the scales were reliable.
Table 2. Cronbach's alpha
Constructs Cronbach's alpha
Interaction quality 0.88
Environment quality 0.72
Outcome quality 0.70
Trust 0.77
Perceived Value 0.80
Customer satisfaction 0.75
Continuance intention 0.77
Testing the research model
3.Fig. 2 depicts the model testing results. Results show that two dimensions of service quality (interaction quality and outcome quality) and perceived value have significant and positive effects on customer satisfaction while only one dimension of service quality (environment quality) and trust have no effect on customer satisfaction. Customer satisfaction was found to have a significant positive effect on continuance intention.
Furthermore, the results indicated that the structural model had a good exploratory power with 67% of the variance in continuance intention jointly explained by customer satisfaction.
Table 3. Overall fit of the research final model
Fit indices Recommended value Values in this study
χ2/df >3 2.194
RMSEA 0.1> 0.014
AGFI >0.9 0.945
NFI >0.9 0.944
CFI >0.9 0.997
RFI >0.9 0.970
Figure 2. Hypothesis testing results
Discussion
that two dimensions of service quality (interaction quality and outcome quality) and perceived value have significant and positive effects on customer satisfaction while only one dimension of service quality (environment quality) and trust have no effect on customer satisfaction. Under the context of traditional services where simultaneous participation of customers and service providers is needed most of the time, Grönroos (1984) found that the functional quality (which relates to how the service is delivered—the interaction process) was more important than the technical quality (which relates to what service is delivered) in the service encounter. In obtaining mobile services, customers might not interact with service providers directly all the time, but the customers interact with the service system frequently. Thus, customers would definitely place importance on the interactional quality of each service encounter.
In the other side, customers emphasize outcome and environment quality. The explanation would be that with an increase in consumption experiences, customers become more familiar with the service process, thus making the interaction part more or less standard, and thus less important. in this study, environment quality has no effect on customer satisfaction and since the Customer focus on environment quality we can conclude hamrah avaal operator couldn‘t apply user friendly interface for impressive connection with customer because customers may now pay relatively more attention to the environment of the service provided by the service provider and the outcome of the service (what they actually get from the service).
Results show trust has no effect on customer satisfaction. We can justify this with this reason, In Iran, mobile value added services are offered in short time by mobile network operators, and customers are not quite familiar with these service providers. In addition according to the results, perceived value positively influenced customer satisfaction. In other words, higher perceived value can lead to higher customer satisfaction customer satisfaction directly and positively influenced post-purchase intention, when the effect of perceived value was the largest, followed by that of customer satisfaction. This result implies that if hamrah avval operator attempt to induce positive post-purchase intention from mobile value-added service users, such as the intention to refer or repurchase the service, improvement of perceived value should be prioritized. it can evaluate whether the release of a certain value-added service can make customers feel the service is ‗‗more valuable than it costs‖, the benefits of the service for consumers, and the reasonableness of its price. Therefore, users not only use a certain service but also feel the value added of the service, which elevates the simple use of service to enjoyment. In this way, the value-added service can create stickiness of users and even become a real competition advantage.
Limitations
future research testing the research model and the corresponding hypotheses in other population groups and geographical contexts may be necessary in order to improve the generalizing of the results. Second, as shown in prior literature, there exist many other factors influencing customer satisfaction and continuance intention, such as, expectation, performance, customer care and so on. examination of other factors might improve the model.
References
Anckar, B., and D‘Incau, D. (2002). Value creation in mobile commerce: Findings from a consumer survey. Journal of Information Technology Theory and Application, 4(1), 43–64.
Anita, S., Hari, M. G., and Kirankumar, M. (2007). Quality of service parameters in cellular mobile communication. International Journal of Mobile Communications, 5(1), 68–93. Bishop, W. R. Jr., (1984). Competitive intelligence. Progressive Grocer, 63(3), 19–20. Bolton, R. N. and Drew, J. H. (1991). A multistage model of customer's assessment of
service quality and value, Journal of Consumer Research, 17 (4) 375–384.
Brady, M.K. and Cronin, J. (2001). Some new thoughts on conceptualizing perceived service quality: a hierarchical approach, Journal of Marketing, 65, 34–49.
Carman, J. M. (1990). Consumer perceptions of service quality: an assessment of the SERVQUAL dimensions. Journal of Retailing, 66 (1), 33–55.
Caro, L. M. and García, J. A. M. (2008). Developing a multidimensional and hierarchical service quality model for the travel agency industry, Tourism Management, 29 (4), 706–720.
Chae, M., Kim, J., Kim, H., and Ryu, H. (2002). Information quality for mobile internet services: A theoretical model with empirical validation. Electronic Markets, 12(1), 38– 46.
Chiou, J. S. (2004). The antecedents of consumers‘ loyalty toward Internet service providers, Information and Management, 41(6), 685–695.
Chiou, J.-S., and Droge, C. (2006). Service quality, trust, specific asset investment, and expertise: Direct and indirect effects in a satisfaction-loyalty framework. Journal of the Academy of Marketing Science, 34(4), 613–627.
Cho, S. and Sung, M. (2007). Integrative analysis on service quality and user satisfaction of wired and mobile internet: a case study in Korea, International Journal of Management Science, 13 (2), 79–98.
Choi, S. K., Lee, M. H., and Chung, G. H. (2001). Competition in Korean mobile telecommunications market: Business strategy and regulatory environment.
Telecommunications Policy, 25, 125–138.
Collier, J. E., and Bienstock, C. C. (2006). Measuring service quality in e-retailing. Journal of Service Research, 8(3), 260–275.
Czepiel, J. A., Solomon, M. R., and Surprenant, C. F. (1985). The Service Encounter: Managing Employee/Customer Interaction in Service Businesses. Lexington Books, Lexington, MA.
Dabholkar, P. A., Thorpe, D. I., and Rentz, J. O. (1996). A measure of service quality for retail stores: scale development and validation. Journal of the Academy of Marketing Science, 24 (1), 3–16.
Dabholkar, P.A., Overby, J.W. (2005).Linking process and outcome to service quality and customer satisfaction evaluations, International Journal of Service Industry Management,16 (1), 10–27.
Eggert, A., and Ulaga, W. (2002). Customer perceived value: A substitute for satisfaction in business markets. The Journal of Business and Industrial Marketing, 17(2/3), 107–118. Fishbein, M. and Ajzen, I. (1975). Beliefs, Attitude, Intention and Behavior: An
Introduction to Theory and Research. MA: Addison- Wesley,
Fornell, C. (1992). A national customer satisfaction barometer: the Swedish experience.
Journal of Marketing, 56, 6–21. 33
Fornell, C., Johnson, M. D., Anderson, E. W., Cha, J. and Bryant, B. E. (1996). The American customer satisfaction index: nature, purpose, and findings. Journal of Marketing, 60, 7–18.
Fullerton, G. (2005). The service quality–loyalty relationship in retail services: does commitment matter? Journal of Retailing and Consumer Services, 12 (2), 99–111. Gefen, D., Karahanna, E., Straub, D.W. (2003).Trust and TAMin online shopping: an
integrated model, MIS Quarterly, 27(1), pp. 51–90.
Gerpott, T. J., Rams, W., and Schindler, A. (2001). Customer retention, loyalty, and satisfaction in the German mobile cellular telecommunications market.
Telecommunications Policy, 25(4), 249–269.
Giese, J. L. and Cote, J. A. (2000). Defining consumer satisfaction. Academy of Marketing Science Review, 1, 1–24.
Grönroos, C. (1984). A service quality model and its marketing implications. European Journal of Marketing, 18 (4), 36–44.
Hartline, M. D., and Ferrell, O. C. (1996). The management of customer contact service employees: an empirical investigation. Journal of Marketing, 69, 52–70.
Houston, M. B., Bettencourt, I. A., and Wenger, S. (1998). The relationship between waiting in a service queue and evaluations of service quality. Psychology and Marketing, 15 (8), 735–753.
Hsu, H. (2006). An empirical study of web site quality, customer value, and customer satisfaction based on e-shop. The Business Review, 5(1), 190–193.
Jarvenpaa, S.L. and Tractinsky, N. (1999). Consumer trust in an Internet store: a cross-cultural validation, Journal of Computer Mediated Communication, 5(2), 1–35.
Jiang, J. J., Klein, G., and Carr, C. L. (2002). Measuring information system service quality: SERVQUAL from the other side. MIS Quarterly, 26 (2) 145–166.
Jones, M. A., and Suh, J. (2000). Transaction-specific satisfaction and overall satisfaction: An empirical analysis. Journal of Services Marketing, 2, 147−159.
Kassim, N. M., and Abdullah, N. A. (2008). Customer loyalty in e-commerce settings: An empirical study. Electronic Markets, 18(3), 275–290.
Kim, D. J., Ferrin, D. L., and Rao, H. R. (2009). Trust and satisfaction, two stepping stones for successful e-commerce relationships: A longitudinal exploration. Information Systems Research, 20(2), 237–257.
Kim, S., and Jin, B. (2002). Validating the retail service quality scale for US and Korean customer of discount stores. Journal of Services Marketing, 16, (3), 223–237.
Kleijnen, M., Ruyter, K. d., and Wetzels, M. (2007). An assessment of value creation in mobile service delivery and the moderating role of time consciousness. Journal of Retailing, 83 (1), 33–46.
Kuo, Y.-F., Wu, C.-M., Deng, W.-J. (2009). The relationships among service quality, perceived value, customer satisfaction, and post-purchase intention in mobile value-added services, Computers in Human Behavior, 25 (4), 887–896. 58
Lee, M. K. O., and Turban, E. (2001). A trust model for consumer Internet shopping.
International Journal of Electronic Commerce, 6(1), 75–91.
Lin, H. H., and Wang, Y. S. (2006). An examination of the determinants of customer loyalty in mobile commerce contexts. Information and Management, 43(3), 271–282. Lu, Y., Zhang, L., and Wang, B. (2010). A multidimensional and hierarchical model of
mobile service quality, Electronic Commerce Research and Applications 8(5) 228–240. Mano, H., and Oliver, R. L. (1993). Assessing the dimensionality and structure of the consumption experience: Evaluation, feeling and satisfaction. Journal of Consumer Research, 20, 451−466.
Martínez Caro, L., and Martínez García, J. A. (2007). Measuring perceived service quality in urgent transport service. Journal of Retailing and Consumer Services, 14, 60–72. Mayer, R.C. and Davis, J.H. (1999). The effect of the performance appraisal system on trust
in management: a field quasi-experiment, Journal of Applied Psychology, 84(1), 123– 136.
McKnight, D. H., and Chervany, N. L. (2002). What trust means in e-commerce customer relationships: An interdisciplinary conceptual typology. International journal of electronic commerce, 6(2), 35–59.
Oliver, R.L. and Swan, J.E. (1989). Consumer perceptions of interpersonal equity and satisfaction in transactions: a field survey approach, Journal of Marketing, 53, 21–35. Olsen, L. L. and Johnson, M. D. (2003). Service equity, satisfaction, and loyalty: from
transaction-specific to cumulative evaluations, Journal of Service Research, 5 (3), 184– 195.
Parasuraman, A. and Grewal, D. (2000). The impact of technology on the quality–value– loyalty chain: a research agenda. Journal of the Academy of Marketing Science, 28(1), 168–174.
Parasuraman, A., Zeithaml, V. A., and Berry, L. L. A. (1985). conceptual model of service quality and its implications for future research. Journal of Marketing, 49 (4), 41–50. Perry, M., KO‘hara Sellen, A., Brown, B., and Harper, R. (2001). Dealing with mobility:
understanding access anytime, anywhere. ACM Transactions on Computer– Human Interaction, 8 (4), 323–347.
Reichheld, F. F. and Schefter, P. (2000). E-loyalty: your secret weapon on the web.
Harvard Business Review, 78(4), 105–113.
Rust, R. and Oliver, R.L. (1994). Service Quality: Insights and Managerial Implications from the Frontier. In R. Rust and R. L. Oliver (eds.), Service Quality: New Directions in Theory and Practice, CA: Sage Publications, Thousand Oaks.
Sheth, J. N., Newman, B. I., and Gross, B. L. (1991). Consumption values and market choice. Ohio: South Western Publishing.
Siau, K., and Shen, Z. (2003). Building customer trust in mobile commerce.
Communications of the ACM, 46(4), 91–95.
Smith, A. K. and Bolton, R. N. (2002). The effect of customers' emotional responses to service failures on their recovery effort evaluations and satisfaction judgments. Journal of the Academy of Marketing Science, 30 (2) 5–23.
Spreng, R. A., Mackenzie, S. B., and Olshavsky, R. W. (1996). A reexamination of the determinants of consumer research. Journal of Marketing, 60, 15−32.
Sweeney, J. C., and Soutar, G. N. (2001). Consumer perceived value: The development of a multiple item scale. Journal of Retailing, 77(2), 203–220
Tarasewich, P. (200). Wireless devices for mobile commerce: user interface design and usability. In Mobile Commerce: Technology, Theory, and Applications. Idea Group Publishing.
Tung, L. L. (2004). Service quality and perceived value‘s impact on satisfaction, intention and usage of short message service (SMS). Information Systems Frontiers, 6(4), 353– 368.
Turel, O., and Serenko, A. (2006). Satisfaction with mobile services in Canada: An empirical investigation. Telecommunications Policy, 30(5/6), 314–331.
Van Dyke, T. P., Kappelman, L.A. and Prybutok, V.R. (1997). Measuring information systems service quality: concerns on the use of the SERVQUAL questionnaire, MIS Quarterly, 21 (2), 195–208.
Wang, Y., Lo, H. P., and Yang, Y. (2004). An integrated framework for service quality, customer value, satisfaction: Evidence from China‘s telecommunication industry.
Information Systems Frontiers, 6(4), 325–340.
Westbrook, R. A. (1981). Sources of consumer satisfaction with retail outlets. Journal of Retailing, 57(3), 68–75.
Yang, Z., and Peterson, R. T. (2004). Customer perceived value, satisfaction, and loyalty: The role of switching costs. Psychology and Marketing, 21(10), 799–822.
Yu, Y. T., and Dean, A. (2001). The contribution of emotional satisfaction to consumer loyalty. International Journal of Service Industry Management, 12(3), 234−250.
Zeithaml, V. A., Berry, L. L., and Parasuraman, A. (1996). The behavioral consequences of service quality. Journal of Marketing, 60(2), 31–46.