Natural Honeys of Different Origin as a Source of
Biologically Active Components
Alica Bobková, Martina Fikselová, Andrea Mendelová, Peter Haščík, Tomáš Tóth
*Faculty of Biotechnology and Food Sciences, Slovak University of Agriculture, Tr. A. Hlinku 2, 949 76 Nitra, Slovakia
Abstract
The purpose of this study was to examine the polyphenol and flavonoid content, electrical conductivity and color measurement of 15 natural honeys. Honey samples were collected from different locations of Slovakia (6 samples), Poland (5 samples) and Serbia (4 samples) and were obtained directly from local beekeepers. The mean content of polyphenolic substances ranged from 611.2 to 2962.24 mg.kg-1. Multifloral honeys were shown to be a good source of TPC, they ranged from 611 to 1257.12 mg.kg-1, those of the samples originated from Poland showed 611 to 990 mg.kg-1, and from Slovakia 703.7 to 1257.12 mg.kg-1 TPC. Forest honeys were found to be also good source of TPC, they ranged from 769 to 1052 mg. kg-1. High correlation was found between TPC and flavonoid content (r=0.92). Mean content of flavonoids in the honeys expressed as rutin content ranged from 112.46 to 846.58 mg.kg-1. Multifloral honeys ranged from 112.49 to 592.35 mg.kg-1, those of the samples originated from Poland proved 112.49 to 189.13 mg.kg-1 flavonoids, and from Slovakia 127.48 to 592.35 mg.kg-1. Forest honeys as a source of flavonoids were proved to be from 136.48 to 266.79 mg.kg-1. Objective measurement of honey color was performed by the L*a*b* system.
Keywords: color, electrical conductivity, flavonoids, natural honey, total polyphenol content
1. Introduction
Honey is used in traditional medicine with a plenty of nutrition and health effects, including antibacterial, antioxidant, anti-inflammatory and prebiotic [1]. It is used worldwide as a medicine in the classical and alternative medicine in the treatment of various diseases. A number of studies assumed that the consumption of food containing plant phenolic compounds may contribute significantly to the health [2]. Honey is a rich source of phenolic acids and flavonoids [3]
polyphenolic compounds act as natural antioxidants and are becoming increasingly popular for their potential role in the protection of human health. These may also be used to indicate the geographical origin of a source of honey [4].
* Corresponding author: Thomas Toth
It is believed that honey helps to reduce cardiovascular diseases mainly due to flavonoids, which demonstrate antioxidant, anti-inflammatory, immunomodulatory and antimicrobial activity. The consumption of honey demonstrated to inhibit the oxidation of low-density lipoproteins, reduction of platelet aggregation, and has analgesic and anti-atherogenic effects that make the potential of reducing the cardiovascular risks
[3]. Phenolic compounds detected in honey, namely caffeic acid, phenyl ester of caffeic acid, quercetin, kaempferol, pinocembrin, apigenin, etc. have been described as promising pharmacological agents in the treatment of cancer
[5].
legislative proposal on agricultural quality policy, changing the rules on origin labelling of honey in order to avoid misleading information to consumers, especially in case of a blend of honeys originating from EU and non-EU. Therefore quality parameters of honey are studied in order to confirm the authenticity, the food safety and also to provide the nutritional values of regional honeys.
The aim of this study was to determine the different parameters such as TPC, flavonid content, electrical conductivity of 15 natural honeys in samples originated from different sources and areas.
2. Materials and methods
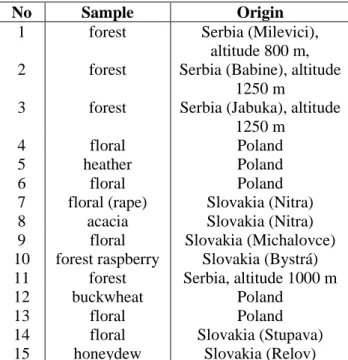
Honey samples (Table 1) were collected from different locations of Slovakia (6 samples), Poland (5 samples) and Serbia (4 samples) and were obtained directly from local beekeepers.
Honeys were represented as monofloral and multifloral samples (10) which originated from Poland and Slovakia, forest samples (4) originated from Serbia and honeydew honey (1) from Slovakia.
Table 1. Investigated honey samples and their characteristics
No Sample Origin
1 forest Serbia (Milevici),
altitude 800 m, 2 forest Serbia (Babine), altitude
1250 m
3 forest Serbia (Jabuka), altitude 1250 m
4 floral Poland
5 heather Poland
6 floral Poland
7 floral (rape) Slovakia (Nitra)
8 acacia Slovakia (Nitra)
9 floral Slovakia (Michalovce)
10 forest raspberry Slovakia (Bystrá) 11 forest Serbia, altitude 1000 m
12 buckwheat Poland
13 floral Poland
14 floral Slovakia (Stupava)
15 honeydew Slovakia (Relov)
Determination of total phenol content (TPC) in honey
Total polyphenol content was determined according to the modified method using the Folin - Ciocalteau reagent [6]. Exactly 200 mL sample of aqueous solution of honey was mixed with 15.8 mL of distilled water and with 1 mL of Folin - Ciocalteau. After 10 min. 3 mL of a 20% sodium carbonate solution was added and the mixture was stirred well. After 60 min. absorbance of each solution at 765 nm was measured. The results were expressed as gallic acid equivalent (GAE mg/kg). To prepare the calibration curve were used standards of gallic acid in the range of 0-1000 mg/L. All measurements were performed in duplicate. Determination was performed by the UV- VIS - NIR spectrometer Shimadzu (UV - 3600 with accessories).
Determination of total flavonoid content (TFC) in honey
Total flavonoid content was determined by a modified method [7] using the reagent (2-aminoethyl diphenylborinate). Exactly 2 ml of 10% honey solution in 50% of ethanol was directly mixed in a cuvette with 100 l of 1% solution of 2-aminoethyl diphenylborinate in absolute ethanol. After 2 minutes, the reaction was left to equilibrate and the chemical absorbance was measured at 404 nm. The results were expressed as rutin equivalent (RE) (mg.kg-1). All measurements were performed in duplicate at the
UV-VIS-NIR spectrometer Shimadzu UV-3600
with accessories.
Trichromatic (color) coordinates of the honey samples
For the purpose of colorimetric comparison of the 20% aqueous solutions of honey was used technique for measuring the color in the visible spectrum (380-780 nm) at spectrophotometer UV-3600 (Shimadzu) under the following conditions: 1 cm thickness cell, 10 ° observer, D65 standard light source. The measured absorption spectra in spectral range were processed by software
Electrical conductivity of honey was determined by conductimetric assay (Mini-digi conductivimeter), followed by the procedure given in the Slovak Technical Standard[8].
Statistical evaluation
The mean values and standard deviations were calculated. Analysis of data was performed with analysis of variance (ANOVA), Fisher's least significant difference (LSD), and Pearson's correlation coefficient were determined as well. Analysis of the results was performed using the statistical software Statistica 8.0.
3. Results and discussion
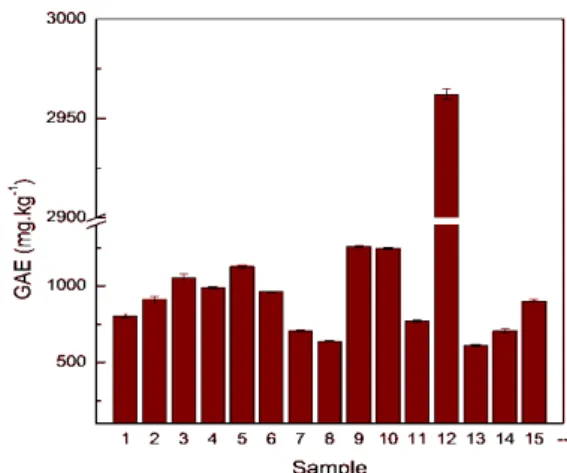
Polyphenols are currently of particular interest to medical and food nutrition research, mainly because of their functional properties. The mean content of polyphenolic substances in samples of honeys expressed as gallic acid (Fig. 1) ranged from 611.2 to 2962.24 mg.kg-1.
Figure 1. The total polyphenol content in samples of honey (mg.kg-1)
Sample: 1 forest (Serbia), 2 forest (Serbia), 3 forest (Serbia), 4 floral (Poland), 5 heather (Poland), 6 floral (Poland), 7 floral, rape (Slovakia), 8 acacia (Slovakia), 9 floral (Slovakia), 10 forest raspberry (Slovakia), 11 forest (Serbia), 12 buckwheat (Poland), 13 floral (Poland), 14 floral (Slovakia), 15 honeydew (Slovakia)
Multifloral honeys were shown to be a good source of polyphenols (TPC), they ranged from 611 to 1257.12 mg.kg-1, those of the samples originated from Poland had 611 to 990 mg.kg-1, and from Slovakia 703.7 to 1257.12 mg.kg-1 TPC.
Forest honeys were found to be also a good source of TPC, they ranged from 769 to 1052 mg.kg-1. The highest content of TPC was detected at buckwheat honey 2962.24 mg.kg-1, and the lowest content at sample of floral honey (No. 13).
Statistical testing showed significant influence of the sample. High correlation was found between TPC and flavonoid content (r=0.92). Samples formed 11 homogeneous groups which differed among each other in their TPC. Forest honeys from different altitudes from Serbia differed statistically significant in their TPC as well.
Flavonoids are an important part of antioxidant system, preventing lipid peroxidation, showing anti-inflammatory, antioxidant, antimicrobial, antimutagenic, antidiabetic effects [9]. The resulting active substances in the body are not in most cases flavonoids, but their metabolites, in particular sulfates, glucuronides and O-methylated derivatives [10]. The average content of flavonoids (Fig. 2) in samples of honeys ranged from 112.49 to 846.58 mg.kg-1. Observing the impact of individual honey samples on the content of flavonoids, we can state that the sample has highly statistically significant effect (not shown).
Samples formed 12 homogenous groups, which differed to each other by flavonoid content. Multifloral honeys as a source of flavonoids ranged from 112.49 to 592.35 mg.kg-1, those of the samples originated from Poland proved 112.49 to 189.13 mg.kg-1 flavonoids, and from Slovakia 127.48 to 592.35 mg.kg-1. Forest honeys as a source of flavonoids were proved to be from 136.48 to 266.79 mg.kg-1. Forest honeys from different altitudes from Serbia differed statistically significant in their flavonid content as well.
The highest content of flavonoid was detected at buckwheat as in the case of TPC (846.58 mg.kg-1), and the lowest content at sample of floral honey (No. 13), similarly as in the case of polyphenol content.
1 2 3 4 5 6 7 8 9 10 11 12 13 14 15 0
150 300 600 750 900
R
E
(
mg
.k
g
-1 )
Sample
Figure 2. The total flavonoid content in samples of honey (mg.kg-1)
Sample: 1 forest (Serbia), 2 forest (Serbia), 3 forest (Serbia), 4 floral (Poland), 5 heather (Poland), 6 floral (Poland), 7 floral, rape (Slovakia), 8 acacia (Slovakia), 9 floral (Slovakia), 10 forest raspberry (Slovakia), 11 forest (Serbia), 12 buckwheat (Poland), 13 floral (Poland), 14 floral (Slovakia), 15 honeydew (Slovakia)
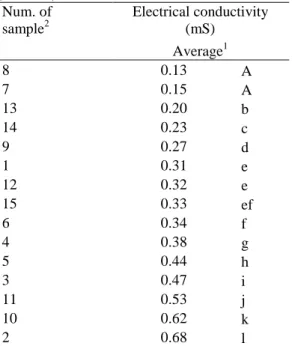
Table 1. Electrical conductivity of honey samples (mS.cm-1)
Num. of sample2
Electrical conductivity (mS)
Average1
8 0.13 A
7 0.15 A
13 0.20 b
14 0.23 c
9 0.27 d
1 0.31 e
12 0.32 e
15 0.33 ef
6 0.34 f
4 0.38 g
5 0.44 h
3 0.47 i
11 0.53 j
10 0.62 k
2 0.68 l
1values in the same column with different letters are significantly different (α<0.05)
2 1 forest (Serbia), 2 forest (Serbia), 3 forest (Serbia), 4
floral (Poland), 5 heather (Poland), 6 floral (Poland), 7 floral, rape (Slovakia), 8 acacia (Slovakia), 9 floral (Slovakia), 10 forest raspberry (Slovakia), 11 forest (Serbia), 12 buckwheat (Poland), 13 floral (Poland), 14 floral (Slovakia), 15 honeydew (Slovakia)
Observing the impact of individual honey samples on the electrical conductivity of honey, we can state that the sample has highly statistically significant effect (not shown).
The electrical conductivity results for the Hatay honeys showed a large variation depending on the floral origin. The electrical conductivity varied in the range of 0.17–1.04 (mS.cm-1). The calluna honey samples had the highest values for electrical conductivity (mean 0.83 mS.cm-1) compared with pinus, flower, gossypium, citrus, capparis, eucalyptus and petroselinum crispum honey [11]. Objective measurement of honey color was performed by the L*a*b* system. We confirmed association between lightness of the samples and the polyphenol and flavonoid content. It is indicating the higher content of the above compounds, the sample is "darker" and "more yellow". This relationship was recorded by visual comparison of samples as well. At the same time is an increasing share of the green component of the color spectrum. In this regard, the most colored samples were recorded by the highest levels of polyphenols and flavonoids.
Honey samples from the seven most common honey types in Slovenia were screened for total phenolic content, antioxidant activity and colour parameters. Results of the study showed that total phenolic content, antioxidant activity and colour parameters differ widely among different honey types. The colour of the Slovenian honeys, analysed was very variable and ranged from pale yellow to dark brown. Correlations between the parameters analysed were found to be statistically significant (p < 0.05) [12].
4. Conclusions
Acknowledgements
For helping us in this research study we thank our colleagues prof. Miroslava Kačaniová from the Slovak University of Agriculture in Nitra, assoc. prof. Malgorzata Džugan from the University of Rzeszow (Poland) and Dr. Nenad Vukovič from the University of Kragujevac (Serbia) who have kindly supported us by honey samples from different places.
References
1. Wallace, A., Eady, S., Miles, M. et al. Demonstrating the safety of manuka honey UMF 20 in a human clinical trial with healthy individuals, The British Journal of Nutrition, 2010,103, 7, 1023-8. doi:
http://dx.doi.org/10.1017/S0007114509992777
2. Naczk, M., Shahidi, F., Extraction and analysis of phenolics in food, Journal of Chromatography A, 2004, 1054, 95–111.
3. Farooqui, T., Farooqui, A. Health Benefits of Honey: Implications for Treating Cardiovascular Diseases, Current Nutrition & Food Science, 2011, 7, 4, 232-252.
4. Tulipani, S., Romandini, S., Vidal, A. et al. Methodological Aspects about Determination of Phenolic Compounds and In Vitro Evaluation of Antioxidant Capacity in the Honey, Current Analytical Chemistry,2009, 5, 4, 293-302.
5. Jaganathan, S. K., Mandal, M., Antiproliferative effects of honey and of its polyphenols: A review, Journal of Biomedicine and Biotechnology,2009, 13. doi:10.1155/2009/830616. 6. Singleton, V. L., Orhofer, R., Lamuela-Raventos, R. M., Analysis of total phenols and other oxidation substrates and antioxidants by means of Folin-Ciocalteu Reagent, Methods Enzym., 1999, 299, 152-178.
7. Jiang, P., Burczynski, F., Campbell, C. et al., Rutin and flavonoid contents in three buckwheat species Fagopyrum esculentum, F. tataricum, and F. homotropicum and their protective effects against lipid peroxidation, Food Res. Int., 2007, 40, 3, 356-364. 8. Slovak Technical Standard (57 0190). Determination of electrical conductivity.
9. Pokorný, J., Schmidt, Š. Antioxidanty a jejich význam v potravinářské technologii a ve výživě, Chemické listy, 2003, 97, 8, 781.
10. Danihelová, M.,Šturdík, E.. Flavonoid natural sources and their importance in the human diet, Potravinárstvo, 2011, 5, 4, 12-24.
11. Yucel, Y., Sultanoglu, P., Characterization of honeys from Hatay Region by their physicochemical properties combined with chemometrics, Fo od Bioscience 1, 2012 , 16 – 25.