Stability and Electronic Properties of Urea in Different
Arrangements: A DFT-Based Study
Nur Najwa Alyani Mohd Nabil, Ainita Rozati Binti Mohd
Zabidi, Nor Ain Fathihah Abdullah, Lee Sin Ang
Faculty of Applied Sciences, Universiti Teknologi MARA, 02600 Arau, Perlis.
ABSTRACT
In this report, the results of the investigations on the stability and the electronic properties of urea in differ-ent arrangemdiffer-ents are presdiffer-ented. Three types of arrangemdiffer-ents of the urea molecules are modelled, namely chain cluster (CC), ribbon cluster (RC), and spherical cluster (SC). In each of these clusters, the sizes of the clusters are increased systematically, hence creating opportunity to understand better the intermolecular interaction of urea crystal. The electronic properties in terms of molecular orbital and electrostatic potential are also studied in this work. Using model chemistry BP86/DEF2-TZVP as implemented in Gaussian 09, together with a few energy-improving schemes, it was found that the CC has the most stable molecule arrangement, in agreement with the previous studies. RC and SC, on the other hand, have weaker intermo-lecular interactions. The MO and ESP studies show that the existence of the reactive sites may be connected to the relative stability between these three clusters.
Keywords: electronic properties; urea; ribbon cluster; spherical cluster; chain cluster.
1.
Introduction
The urea molecules have been one of the most thoroughly investigated systems either experimen-tally of theoretically. This is due to wide usage of urea in multiple industries. Previously, urea had been shown to have high nonlinear optical properties (Luo, Yanget al., 2011; Masunov, Tannu et al., 2017). Urea is also important moiety in the pharmaceutical industries as it is used in broad range of drugs (Díaz, Palopet al., 2017). However, the understanding and designing of the intermolecular interaction that dictates crystal packing of urea is still unclear. The studies had shown that urea molecules provide wide range of possible hydrogen-bonds due to having the C=O and N-H groups in clusters (Keuleers, Desseynet al., 1999). Specific interaction such as hydrogen bonding can significantly influence the electronic structure of the complexes. The previous study also shows that the main contribution to the intermolecular interaction energy is due to the long-range electrostatic and the short-range exchange repulsion (Dovesi, Causa’et al., 1990). They also suggest that the influence of a dispersion interaction on the hydrogen bond formation in the urea crystal should be negligible. However, another study had stated that the intermolecular correlation effects contribute significantly to the stabilization energy of the urea molecule in the crystal when compared to the gas phase (Ayala & Scuseria, 2000).
In this work, we reported the systematic studies of the interaction in urea crystal with state-of-art tech-niques, with the objective to provide a better understanding of the nature of binding forces in the molecular urea systems.
2.
Method
of the dispersion energy but improves the dispersion energy decays to zero at short range part of D3. D3BJ has proven its reliability as it gives less average error compared to non-dispersion corrected calculation and D3 dispersion-corrected DFT scheme (Grimme, Huenerbeinet al., 2011; Christensen, Kubařet al., 2016). Hence, D3BJ is preferred over D3 scheme.
Crystalline solid is structured from an infinite number of molecules which include the intermolecular interaction effects from the neighbouring molecule. Thus, to elucidate this environment, the interactions between neighbouring molecules must be considered. However, supramolecular approach usually has the basis set superposition error (BSSE) due to unbalanced basis set expansion of monomer. The counterpoise (CP) scheme by Boys and Bernardi can be used for this problem (Boys & Bernardi, 1970) but it only considers intermolecular BSSE of non-covalently bound dimer complexes. Another scheme, known as ge-ometrical counterpoise (gCP), offers estimation of the inter- and intra-molecular BSSE for DFT calcula-tions with various basis sets (Kruse & Grimme, 2012). gCP estimates the correction based only on the cartesian coordinates of the molecules or complexes.
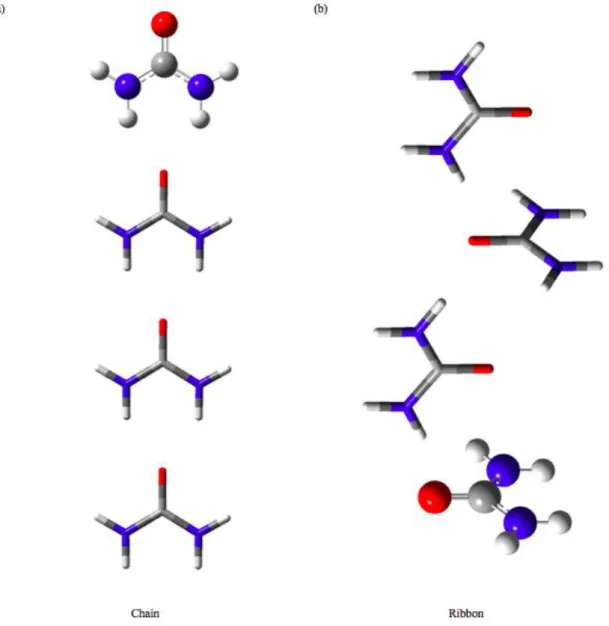
Three different aggregates pattern was studied in this work to cover different possible adjacent interactions. The three different aggregates pattern are chain cluster (CC) (Figure 1a), ribbon cluster (RC) (Figure 1b) and sphere cluster (SC) (Figure 2).
Figure 1. (a) CC and (b) RC pattern for 4-molecule urea.
Figure 2. SC pattern of (a) 3 Angstroem, (b) 4 Angstroem, (c) 5 Angstroem, and (d) 6 Angstroem distance from main urea.
To find the stability of the urea cluster, the relative energy per molecule is calculated with the formulae of
tot rel n-1
E
E =
-E
n
(1) where n is number of molecules while theE
tot is the total energy which described astot DFT d3bj gcp
E =E
+E
+E
(2)DFT
E
is the DFT energy,E
d3bjis dispersion correction energy andE
gcpis the counterpoise correction en-ergy.3. Results and Discussion
3.1.Relative Energy per Molecule
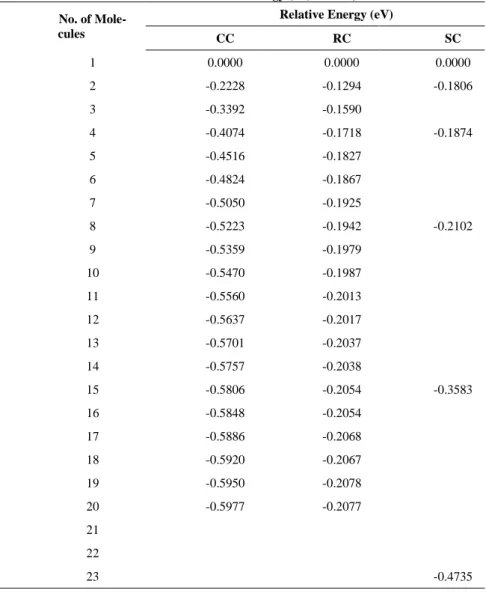
The results for the stability of the urea cluster using systematic cluster calculations are tabulated in Ta-ble 1 and displayed graphically in Figure 3. The inclusion of the gCP and D3-BJ corrections (not shown in the tables and figure) rendered the Etotal/n more negative than those without. As the D3BJ are negative
values, while gCP are smaller positive values, the net result is the increased cohesiveness of the molecules. Hence, the inclusion of the correction schemes gave a more strongly bounded picture for the molecules.
Using Equation 1, the Erel for all types of cluster become more negative as the number of molecules is
increased, indicating the increase stability of the urea in the larger cluster. This in line with the notion that as the cluster becomes larger, there are more interactions between the molecules. We anticipate that, with the inclusion of more molecules in a cluster, Etotal/n will eventually reach a stable limit. The decreasing
pattern for all types of clusters can be attributed to the increasing intermolecular interaction between cluster molecules as the number of molecules is increased.
gradient of the curve is decreasing compared to the initial increase from the dimer urea. From Figure 2, sphere cluster has a centre molecule (ball and stick form) that have interactions with neighbouring mole-cules surrounding it while outer molecule (stick form) only has an interaction of inner molemole-cules. Thus, the Erel of the SC is not converging as fast as the CC and RC as the outer molecules have more contribution to
the stability of the cluster. However, it is assumed at the larger number of molecules, system starts to pos-sess the solid state environment for the centre molecule where the outer molecules have less effect on the overall interaction. The Erel of SC is due to the molecules in this type of cluster have mixed arrangements
between chain and ribbon.
Table 1. Results of relative energy (eV) for CC, RC and SC.
No. of Mole-cules
Relative Energy (eV)
CC RC SC
1 0.0000 0.0000 0.0000
2 -0.2228 -0.1294 -0.1806
3 -0.3392 -0.1590
4 -0.4074 -0.1718 -0.1874
5 -0.4516 -0.1827
6 -0.4824 -0.1867
7 -0.5050 -0.1925
8 -0.5223 -0.1942 -0.2102
9 -0.5359 -0.1979
10 -0.5470 -0.1987
11 -0.5560 -0.2013
12 -0.5637 -0.2017
13 -0.5701 -0.2037
14 -0.5757 -0.2038
15 -0.5806 -0.2054 -0.3583
16 -0.5848 -0.2054
17 -0.5886 -0.2068
18 -0.5920 -0.2067
19 -0.5950 -0.2078
20 -0.5977 -0.2077
21 22
23 -0.4735
3.2. Dipole Moment
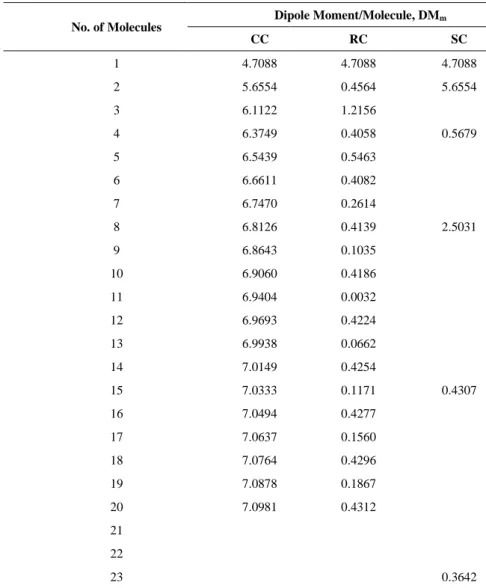
The behaviour of the dipole moments of the CC and RC are similar to the previous studies (Masunov & Dannenberg, 2000). As shown in Table 2, the dipole moment/molecules (DMm) for CC increases as the
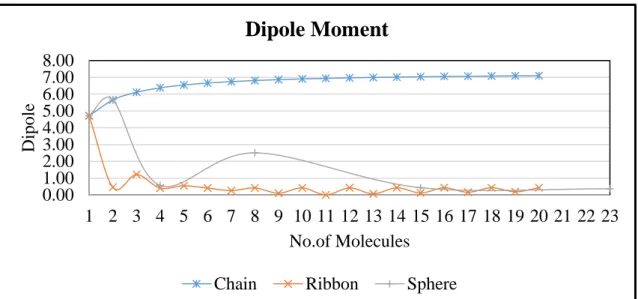
size of the cluster increases. The increment becomes smaller and the curve is flat at dipole of 7 Debye as shown in Figure 4. For the RC, the DMm fluctuates, as can be seen in Table 3 and the curve in Figure 4.
The cluster with even number of molecules has an almost zero DMm because the arrangement of the RC is
centrosymmetric. As SC contained mixed arrangements of chain and ribbon, its DMm also fluctuates.
Table 2. The dipole moment of the CC, RC and SC pattern.
No. of Molecules Dipole Moment/Molecule, DM
m
CC RC SC
1 4.7088 4.7088 4.7088
2 5.6554 0.4564 5.6554
3 6.1122 1.2156
4 6.3749 0.4058 0.5679
5 6.5439 0.5463
6 6.6611 0.4082
7 6.7470 0.2614
8 6.8126 0.4139 2.5031
9 6.8643 0.1035
10 6.9060 0.4186
11 6.9404 0.0032
12 6.9693 0.4224
13 6.9938 0.0662
14 7.0149 0.4254
15 7.0333 0.1171 0.4307
16 7.0494 0.4277
17 7.0637 0.1560
18 7.0764 0.4296
19 7.0878 0.1867
20 7.0981 0.4312
21 22
23 0.3642
Figure 4. The dipole moment of the CC, RC and SC pattern.
3.3. Molecular Orbital
To have a better understanding of the interaction between the urea molecules in different arrange-ments, the molecular orbital (MO) and electrostatic potential (ESP) analysis had been discussed. The MO represents the region where electron occupying that orbital is likely to be found in a molecule. The highest occupied molecular orbital (HOMO) of the molecules shows the nucleophile sites which are rich in elec-trons. The lowest unoccupied molecular orbital (LUMO) of the molecules are the electrophile sites which are poor of electron. This is the region that likely to accept an electron.
MO for 1-molecule urea is shown in Figure 5. As in Figure 5 (a), HOMO, the contributions fromor-bitals of oxygen, nitrogen and hydrogen. This shows that this site would donate their electron as the inter-action occurs between molecules. LUMO in Figure 5 (b) shows that electron is likely to interact with the hydrogen site of the urea. This is due to the hydrogen in the electron deficient site of the molecule.
(a) (b)
Figure 5. The molecular orbital of (a) HOMO and (b) LUMO for 1 molecule urea
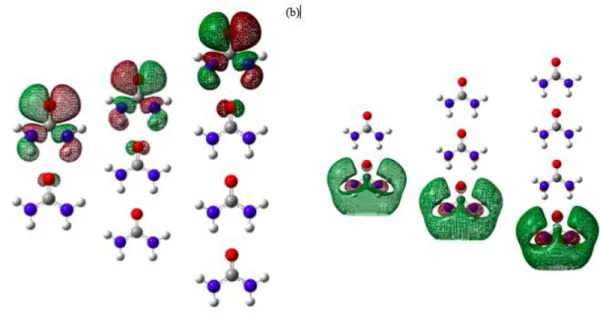
Figure 6 shows the (a) HOMO and (b) LUMO for CC of urea. As the number of molecules increase from dimers to 4-molecule urea, HOMO region (Figure 6 (a) of CC shows that MOs only occupied at one side of the clusters. Hence only one side of CC is prone to donate an electron. LUMO for the chain cluster is consistently visual at the opposite end of the chain cluster compared to the HOMO. These show that the opposite of HOMO site of CC is prone to accept an electron from another molecule. Having said this, the centre region of the CC is not an active region for reactivity.
0.00
1.00
2.00
3.00
4.00
5.00
6.00
7.00
8.00
1 2 3 4 5 6 7 8 9 10 11 12 13 14 15 16 17 18 19 20 21 22 23
Dipole
No.of Molecules
Dipole Moment
Figure 6. The molecular orbital of (a) HOMO and (b) LUMO for 2, 3 and 4-molecule CC
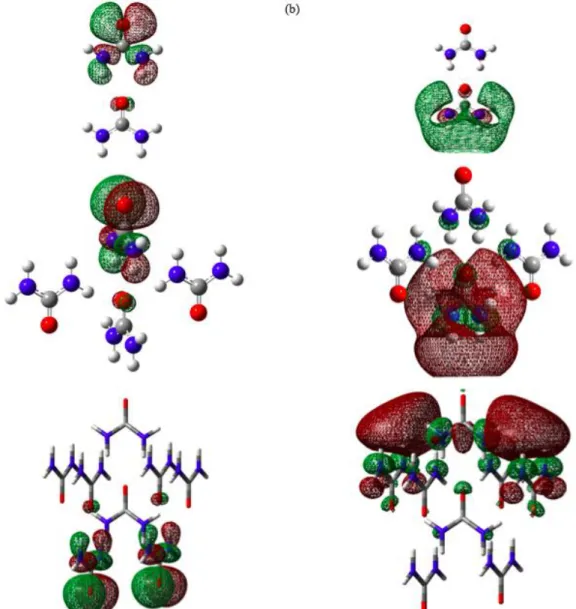
In Figure 7 (a), HOMO for RC appears at the middle molecule of the cluster with even number of molecules and at outer molecule for the cluster with odd number of molecules. As the number of molecules increase, the HOMO repetitively exists in the middle and outer molecule of the RC. It indicates that the site of the electron donor is repetitively changing as the number of molecules increase. For LUMO region (Figure 7 (b)) for the RC also shows a similar pattern where the LUMO is visual at the outer molecule for cluster with even number of molecules and at inner molecule as the number of molecules in the clusters is odd. This repetitive change of the donor and acceptor shows the interaction of the ribbon cluster is changing as the number of the molecules in cluster is changing. Thus, this would agree with the dipole moment result that there is fluctuation to the dipole moment of the cluster.
Figure 7. The molecular orbital of (a) HOMO and (b) LUMO for RC
Figure 8. The molecular orbital of (a) HOMO and (b) LUMO for SC
3.1.4. Electrostatic Potential (ESP)
Electrostatic potential (ESP) analysis is shown in a range of colours. Colours change from blue-green-red according to the average ESP of the compound. Blue colour indicates low ESP which shows the nucleophilic site of the molecule while red colour indicates high ESP where the electrophilic site of the compound. Green is the site with low reactivity as the potential are stable from overall potential of the molecules.
1-molecule urea shows the basic interaction site of urea. Form Figure 9, ESP shows that the elec-trophilic interaction would occur at the oxygen atom of the urea molecule. This is due to the oxygen atom is a highly electronegative atom. The blue site of the urea is shown at the hydrogen site of the urea. This shows that this site would attract another molecule.
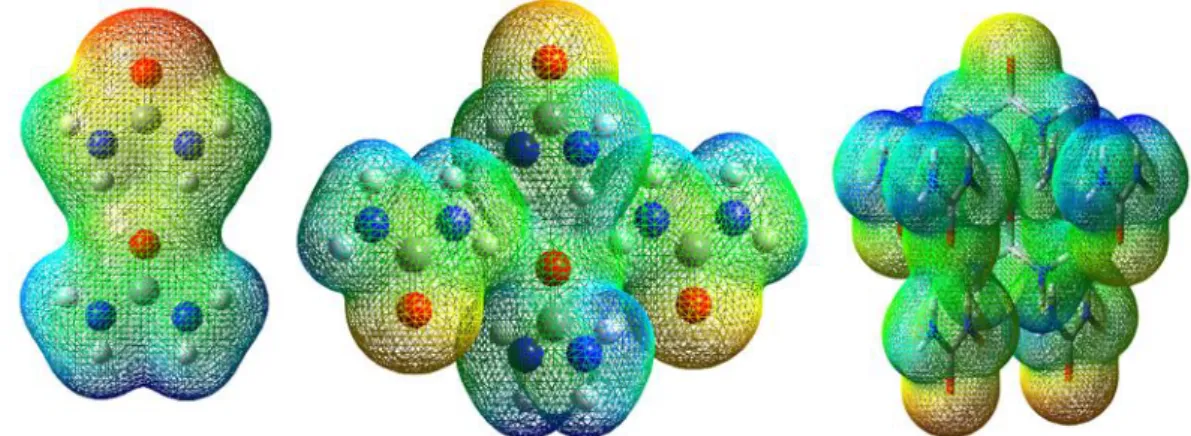
The region of the ESP changes as the number of molecule increase. The red region of the ESP in urea CC (Figure 10) is similar to 1-molecule urea. However, the red site only appears at the end of the urea
Figure 9. The ESP for 1-molecule urea.
Figure 10. The ESP of 2-, 3- and 4-molecule for CC urea
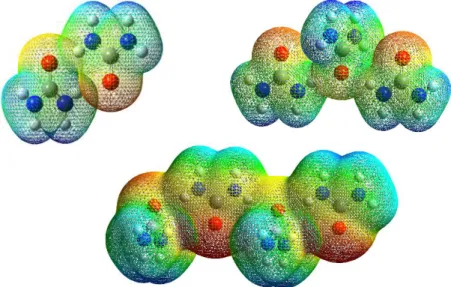
For the RC (Figure 11), as the number of molecules is increased, the distribution of the colour re-petitively appears across the cluster. Each molecule is able to react individually, as each molecule has elec-trophilic (blue site) at each hydrogen atoms and nucleophilic (red site) at the oxygen atom. This would result in the less stable cluster than CC as shown in Figure 3.
Figure 12 shows SC also shows the same randomness of the ESP surface as in RC. The colour range changes to dark blue – light blue – green – yellow – red for dimer and 4-molecules cluster. However, the middle molecule of the sphere cluster changes into green (stable region) colour as number of molecules increase. The outer molecule would have reactive site for the electrophilic and nucleophilic interaction between molecules.
Figure 12. The ESP of 4- and 8-molecule for SC urea.
Comparing the ESP of three types of arrangements (CC, RC, SC), there might be a connection between the size of the green region to the stability of different arrangements. For CC which is the most stable cluster, the green region is the largest. For SC, with lesser site of the green region, the stability is lower than CC but higher than RC, which has no visible green region in the cluster.
4.
Conclusion
This work studies the nature of the stability and the interaction of the urea cluster in different patterns of chain, ribbon and sphere. The differences in the stability and interaction of the different patterns are primarily due to the hydrogen bond between molecules. The result shows that the chain always has high stability with strong hydrogen bonding between molecules. The chain cluster which has two hydrogen at-oms interacting with each oxygen atom is more stable than other cluster patterns. Investigations on the electronic properties revealed that there may be connections between the existence of the reactive sites with the relative stability between these three clusters.
References
Ayala, P. Y., & Scuseria, G. E. (2000). Electron correlation in large molecular systems using the atomic orbital formalism. The case of intermolecular interactions in crystalline urea as an example. Journal of Computational Chemistry, p.1524.
Beran, G. J. O. (2016). Modeling polymorphic molecular crystals with electronic structure theory. Chemical Reviews, p. 5567-5613.
Boys, S. F., & Bernardi, F. (1970). The calculation of small molecular interactions by the differences of separate total energies. Some procedures with reduced errors. Molecular Physics, p. 553.
Christensen, A. S., Kubař, T., Cui, Q., & Elstner, M. (2016). Semiempirical quantum mechanical methods for noncovalent interactions for chemical and biochemical applications. Chemical Reviews, p. 5301-5337.
Díaz, M., Palop, J. A., Sanmartín, C., & Lizarraga, E. (2017). Thermal stability and decomposition of urea, thiourea and selenourea analogous diselenide derivatives. Journal of Thermal Analysis and Calorimetry, p.1663-1674.
Dovesi, R., Causa’, M., Orlando, R., Roetti, C., & Saunders, V. R. (1990). Ab initio approach to molecular crystals: A periodic Hartree–Fock study of crystalline urea. The Journal of Chemical Physics, p. 7402-7411.
Feng, S., & Li, T. (2006). Predicting lattice energy of organic crystals by density functional theory with empirically corrected dispersion energy. Journal of Chemical Theory and Computation, p. 149-156. Gora, R. W., Bartkowiak, W., Roszak, S., & Leszczynski, J. (2002). A new theoretical insight into the
nature of intermolecular interactions in the molecular crystal of urea. The Journal of Chemical Physics, p. 1031-1039.
Grimme, S., Antony, J., Ehrlich, S., & Krieg, H. (2010). A consistent and accurate ab initio
Grimme, S., Ehrlich, S., & Goerigk, L. (2011). Effect of the damping function in dispersion corrected density functional theory. Journal of Computational Chemistry, p. 1456.
Grimme, S., Huenerbein, R., & Ehrlich, S. (2011). On the importance of the dispersion energy for the thermodynamic stability of molecules. ChemPhysChem, p. 1258-1261.
Keuleers, R., Desseyn, H. O., Rousseau, B., & Van Alsenoy, C. (1999). Vibrational analysis of urea. The Journal of Physical Chemistry, p. 4621-4630.
Kohn, W., Becke, A. D., & Parr, R. G. (1996). Density functional theory of electronic structure. The Journal of Physical Chemistry, A p. 12974-12980.
Kruse, H., & Grimme, S. (2012). A geometrical correction for the inter- and intra-molecular basis set superposition error in Hartree-Fock and density functional theory calculations for large systems. The Journal of Chemical Physics, p. 154101.
Luo, S. J., Yang, J. T., Du, W. F., & Laref, A. (2011). Mechanism of linear and nonlinear optical properties of the urea crystal family. The Journal of Physical Chemistry, p. 5192-5200.
Masunov, A., & Dannenberg, J. J. (2000). Theoretical study of urea and thiourea. 2. chains and ribbons. The Journal of Physical Chemistry, p. 806-810.
Masunov, A. E., Tannu, A., Dyakov, A. A., Matveeva, A. D., Freidzon, A. Y., Odinokov, A. V., & Bagaturyants, A. A. (2017). First principles crystal engineering of nonlinear optical materials. I. prototypical case of urea. The Journal of Chemical Physics, p. 244104.
Moellmann, J., & Grimme, S. (2010). Importance of London dispersion effects for the packing of molecular crystals: A case study for intramolecular stacking in a Bis-thiophene derivative. Physical Chemistry Chemical Physics, p. 8500-8504.
Pérez-Jordá, J., & Becke, A. D. (1995). A density-functional study of Van Der Waals forces: Rare gas diatomics. Chemical Physics Letters, p. 134.