Analysis of Emotions in Real-time Twitter Streams
Yuki Kobayashi and Maxim Mozgovoy The University of Aizu
Tsuruga, Ikki-machi, Aizuwakamatsu, Fukushima, Japan E-mail. {m5201158, mozgovoy}@u-aizu.ac.jp
Myriam Munezero School of Computing,
University of Eastern Finland, Joensuu, Finland E-mail: mmunez@uef.fi
Keywords: twitter, social media analysis, streaming Received: November 4, 2016
The purpose of this paper is to present EmoTwitter 2.0, a system for visualizing discussions and emotions of Twitter users in real time over a specific geographical location. The system, given location information as input, streams users’ tweets posted in real time using the Twitter API. In addition, using content analysis, it extracts and visualizes the most frequent words and emotional content of the streamed tweets. Through demonstrations of potential use cases and testing, the system has shown to have practical applicability. It provides an opportunity to easily visualize and compare the discussions of people on Twitter in certain geographical locations, which can be useful, for instance, in targeted messaging.
Povzetek:. Opisan je sistem EmoTwitter 2.0 za vizualizacijo čustev uporabnikov Twiterja.
1
Introduction
Twitter is a social microblog platform that allows people to post their views and emotions on any subject, from current events, political situations, and new products launched, to favorite movies or music [1]. It is one of the most famous microblogs in the world, having more than 300 million active users. The popularity of Twitter and the vast amount of information posted through it, combined with accessibility of the data via public APIs, has made it attractive for purposes such as marketing, and understanding of customers and discussions around the world on varying topics and events. Temporal and spatial analysis are possible thanks to the fact that tweets are time-stamped, and location information is included in tweets and user profiles. To navigate efficiently this large data set, it is important to have visualization capabilities that can provide insights and extract valuable information.
This paper presents EmoTwitter 2.0, an extension of the earlier system EmoTwitter [2], designed as a fine-grained emotion detection and visualization instrument. The system supports several types of text analysis. Its basic functionality is to take user tweets as input and build a word cloud based on the words in the tweets. In addition, using a lexicon-based approach, the system identifies emotions in tweets (classified according to Plutchik’s eight emotion categories) and visualizes them. The potential impact and usefulness of the first EmoTwitter version was demonstrated in a user-based evaluation.
Since analyzing tweets in real time with their location information is playing an increasing role in various tasks, especially in monitoring natural disasters [3] and crisis mapping [4], EmoTwitter 2.0 supports filtering tweets by location, and allows to monitor ongoing (real-time) tweet streams.
The purpose of the paper is to present the implementation and some case studies of this functionality. The main contribution of this work is to demonstrate the ability to provide an overview of discussion topics of tweets in a specific geographical area in real time, allowing for easy comparison of what is happening in the Twittersphere in different areas.
2
Related work
Various works exist that have aimed to harvest the Twitter resource in real time for obtaining valuable information, including geographical location of posters.
Closest to the current work is the contribution by Jung et al. [5] that presents GeoViewer, a web-based map application for monitoring real-time social media messages in selected areas. The application helps to visualize and query location-based tweets and provide
The paper is based on: Y. Kobayashi and M. Mozgovoy. Realtime Analysis of Tweet Streams with EmoTwitter, Proceedings of the 2nd Int’l Conference on Applications in
interactive mapping and spatial query functions. Their work though focuses more on disaster events.
Dahyot et al. [6] propose a web-based geolocated visualization tool for summarizing information harvested from the web, including an animated and interactive audio-visual tweet sentiment map. In their work, they focused on the GPS location and time stamp of a tweet. The system processes tweet words to compute a sentiment score using the Stanford Core NLP library.
Graham [7] analyzed and classified a large collection of geotagged Twitter data in order to automatically find popular places from where people are tweeting. This approach makes use of spatial analysis of the GPS latitude and longitude values of a tweet, and combines it with content analysis of the text and hashtags of the respective tweet. In this work however, only the top five hashtags are used to identify the theme of tweets in a region.
Heatmaps are used in “Global Twitter Heartbeat” project [13] to map world emotions expressed on Twitter in real time. The project analyzes every tweet to assign its location (in addition to GPS data it processes the text of the tweet itself), and tone values and then visualizes the conversation in a heat map infographic that combines and displays tweet location, intensity and tone.
Other researchers analyzed both the location information of a twitter user and the location of physical events referred to in twitter feeds [8]. They designed an algorithm that identifies distinct event signatures, clusters them based on events they describe, and analyzes the resulting clusters for location information. This information is subsequently translated using Google Maps API for geolocation, thus offering a real-time view of ongoing events on a map. Our work though focuses on a real-time view of the users.
The Google API was also used to display and study the spatial temporal activity of the West Nile Virus using Twitter data, thus allowing to observe changes in tweet messages regarding the virus [9].
Working with geolocation information has limitations as identifying geolocation information of tweets is not always possible. The study of a month of the Twitter Decahose (10% of the global Twitter stream, consisting of over 1,5 billion tweets from more than 70 million users) identified that just over 3% of all tweets include native geolocation information, with 2% offering street address-level resolution in real time [10].
In all the analyzed related works, we have not found a similar type of visualization as presented in our paper — the display of changes in the tweets topics in real time for a particular location.
3
System description
EmoTwitter 2.0 consists of backend and frontend layers, described below. For the backend, we focus on the new implemented functionality: tweet streaming and tweet location analysis.
3.1
Backend: analyzing tweet streams
Twitter provides two kinds of APIs: REST API and Streaming API. The REST API allows the retrieval of tweets, while the Streaming API gives access to global streams of tweet data in real time. Figures 1 and 2 show the comparison between REST API and Streaming API processes. Both APIs rely on HTTP connections, but Streaming API requires keeping a persistent connection open [3].
The Streaming API is asynchronous: the tweets are returned to the caller as they arrive, and the download process continues to work. The Streaming API further lets the user to filter the stream by geographical location of tweets and tweet language. This location information is available when a Twitter user enables the geographical location on their devices. Moreover, while the REST API has a Twitter-imposed limit of downloading only the most recent 3200 tweets of each user, and the total hourly limit of queries, the Streaming API does not impose such a limit. However, arriving tweets represent only a small segment of the raw global Twitter stream, which is another limitation of the Twitter service.
3.2
Backend: location analysis
To determine and retrieve tweets based on the geographic location, we use tweet geotags. This information is available when a user enables location information sharing on their device. Thus, we are limited to the users who enable this option.
In order to analyze and visualize the tweets based on the location information, EmoTwitter uses the Google Maps API — an interface for interacting with the backend web service of Google Maps [11]. Taking a location string as an input, EmoTwitter 2.0 queries Google Maps to retrieve the geographical coordinates of the string (presuming that Google Maps is able to interpret the string as a location). Next, EmoTwitter receives the values of latitude and longitude as a response. Using these values and the streaming API, the system retrieve tweets posted near the specified geographical location. Currently the system returns all the tweets inside a square having the specified point in the center and sides of 1.0-mile length.
Figure 2: Streaming API process (adapted from [12]).
3.3
Frontend
EmoTwitter 2.0 provides a graphical user interface for interacting with the system. First, a user logs into the system using their Twitter username and password. This is required in order to create an access token that Twitter application uses to acquire data. Then the system displays a window where the user can enter a location (see Figure 3). Any free-form address that can be processed with Google Maps can be entered. Next, the user has to click the “start stream” button, and the system starts streaming tweets within the given location range. The results are displayed in a textbox as they arrive.
The system also updates in real time a word cloud containing the most frequent words in the tweets, a functionality implemented in the first version of the system as described in [2]. The user can stop the analysis of incoming tweets at any moment.
Figure 3: Location-based tweet retrieval.
4
Demonstration
To demonstrate the practical viability of EmoTwitter, we shall discuss two interesting cases that occurred while we were working on the paper.
Case 1. The former Cuban president, Fidel Castro passed away at the age of 90 on Friday evening, 26 November 2016. As expected, a lot of Twitter chatter on the Saturday morning for instance in Cuba’s capital Havana and Birán (Castro’s birth town) were related to Castro and Cuba (See Figures 4a and 4b).
At the same time, we examined the chatter around other countries that due to political history situations, might have been expected to have reactions to the death of the former president. For instance, the USA was one of the countries where diplomatic relations were severed. Thus looking at the Twitter chatter in Washington DC, the capital city and government center, on the same Saturday morning for an equal period of time, there was some chatter on Fidel Castro, but not so much in comparison to
Figure 4a: Twitter word cloud in Havana, Cuba.
Figure 4b: Twitter word cloud in Birán, Cuba. location entry area
start
streaming button
Figure 4c: Twitter word cloud in Washington DC, USA.
Havana and Birán (see Figure 4c for snapshot of the chatter). However, continuing to stream for a longer period, we might observe increased chatter as coverage of the death spreads.
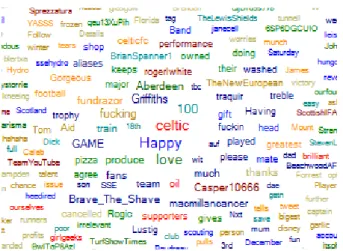
Case 2. Another interesting case for EmoTwitter was the Scottish League Cup final match that took place on 27 November 2016. The final teams were Celtic and Aberdeen. The match promised to be interesting since if Celtic won, it would be their 100th trophy, and it would be the first piece of silverware for the former Liverpool manager, Brendan Rodgers, with the Celtic team.
On Sunday, 27 November 2016, at 17:00 EET, we entered the location of the stadium where the final match was taking place, which was at Hampden Park, Glasgow, We used the exact address, ‘Glasgow G42 9BA, UK’ to give us the exact location (see Figure 5).
Figure 5: Location of streaming at Hampden Park.
When the match started at 17:00, we started collecting the Twitter streaming data, and stopped this process in the middle of the game (during half-time). By the end of the first half, Celtic was leading by two goals, while Aberdeen scored zero. As can be seen from the snapshots in Figures 6a and 6b, there was some Twitter chatter about the game, as expected. The word ‘goal’ (see Figure 6a) was in the spotlight by the end of the first half as a player Forrest scored a goal 8 min before the half time.
Figure 6a: Word cloud after the goal by Forrest.
Figure 6b: Word cloud of the chatter at half time.
After the mid-game break, we resumed data collecting, and stopped the process after the game ended. Shortly after the break, Celtic player Dembele scored
another goal through a penalty. This information appeared in the spotlight in the Twitter chatter (see Figure 7a). The Figure 8b shows the chatter at the end of the game. There are some happy expressions, as well as the number 100, indicating that Celtic has won their 100th game.
5
Conclusion
We have presented EmoTwitter 2.0 with its extended functionality of analyzing tweets streams in real time on the basis of location information. We illustrated with two example cases how the visualization of frequent words in real time can be used to explore and compare ongoing discussions in the Twittersphere. Our use cases revealed that in most cases words in a word cloud are not stable, and quickly change over time. However, sometimes it is possible to catch a somewhat longer trend, when a number of keywords stay in active use for minutes and even hours. This was the case, for example, with the death of the former president of Cuba (Case 1). In Case 2, we showed how EmoTwitter can be used to examine Twitter chatter during a football match.
Figure 8: Word cloud after the game.
The analysis and visualization is however limited, since we do not have access to the complete real-time stream of tweets, and not all Twitter users have their location sharing enabled on their devices. Still, we are able to gain insights from visualizing real-time Twitter chatter in a particular location. Such information opens up opportunities, for instance in targeted messaging and advertising.
Our future work will be related to further extensions of EmoTwitter functionality. We are also going to release the system as open source software.
6
References
[1] E. Martínez-Cámara, M. Martín-Valdivia, L. Ureña-López, and A. Montejo-Raéz, “Sentiment Analysis in Twitter,” Natural Language Engineering, vol. 20, no. 01, pp. 1–28, 2014.
[2] M. Munezero, C. S. Montero, M. Mozgovoy, and E. Sutinen, “EmoTwitter — A Fine-Grained Visualization System for Identifying Enduring
Sentiments in Tweets,” in International Conference on Intelligent Text Processing and Computational Linguistics, 2015, pp. 78–91.
[3] P. S. Earle, D. C. Bowden, and M. Guy, “Twitter earthquake detection: earthquake monitoring in a social world,” Annals of Geophysics, vol. 54, no. 6, 2012.
[4] P. Meier, “How the UN used social media in response to Typhoon Pablo,” Standby Task Force, 2012.
[5] C.-T. Jung, M.-H. Tsou, and E. Issa, “Developing a real-time situation awareness viewer for monitoring disaster impacts using location-based social media messages in Twitter,” in International Conference on Location-Based Social Media Data, Athens, GA, USA March, 2015, pp. 12–14.
[6] R. Dahyot, C. Brady, C. Bourges, and A. Bulbul, “Information visualisation for social media analytics,” in Computational Intelligence for Multimedia Understanding (IWCIM), 2015 International Workshop on, 2015, pp. 1–5.
[7] T. Graham, “Geospatial Clustering and Classifying of Twitter Data,” Projects in Geospatial Data Analysis: Spring 2015, 2015.
[8] P. Giridhar, T. Abdelzaher, J. George, and L. Kaplan, “Event localization and visualization in social networks,” in 2015 IEEE Conference on Computer Communications Workshops (INFOCOM WKSHPS), 2015, pp. 35–36.
[9] R. Sugumaran and J. Voss, “Real-time spatio-temporal analysis of west nile virus using twitter data,” in Proceedings of the 3rd International Conference on Computing for Geospatial Research and Applications, 2012, p. 39.
[10] K. Leetaru, S. Wang, G. Cao, A. Padmanabhan, and E. Shook, “Mapping the global Twitter heartbeat: The geography of Twitter,” First Monday, vol. 18, no. 5, 2013.
[11] E. Newton, Google Maps API for .NET. Available: https://github.com/ericnewton76/gmaps-api-net (2016, Dec. 08).
[12] Twitter Inc, Twitter Developer Documentation: Streaming APIs. Available: https://dev.twitter.com/streaming/overview (2016, Dec. 08).
![Figure 1: REST API process (adapted from [12]).](https://thumb-us.123doks.com/thumbv2/123dok_us/8039324.2128708/2.892.471.813.900.1052/figure-rest-api-process-adapted-from.webp)