http://www.sci-rep.com pISSN 2454-2156 | eISSN 2454-2164
Original Research Article
A residential habitat quality model for population health vulnerability
assessment in Urban Nigeria
Yemi Adewoyin*
INTRODUCTION
The role of the environment, both biotic and abiotic, in shaping population health outcomes has been widely acknowledged in the literature over the years.1-5 This follows from the understanding that most disease conditions are caused, influenced - directly or indirectly, or attenuated by conditions in the environment. Such environmental conditions include weather and climate, air and water quality, as well as population agglomeration and its impact on traffic, pollution, noise, accessibility,
sanitation, waste management, and living conditions among others. While the population may be unable to prevent or control the impacts of the abiotic elements of the environment on their health totally, the residential environment, on the other hand presents opportunities for the control of exposure to disease vectors and pathogens, and susceptibility to diseases. The residential environment, otherwise referred to as residential habitat, is defined as the housing units, the surroundings, the neighborhoods, and the communities in which they are located.6 The quality of the residential environment
ABSTRACT
Background: The quality of the living environment affects the population’s exposure and susceptibility to diseases, yet most available indices for the measurement of residential environmental quality are based on the population’s perception of their environment rather than on objectively verifiable indicators. This paper develops an index based on the peculiarities of the urban environment in Africa.
Methods: In constructing the residential habitat quality (RHQ) model, 30 indicators measuring residential environmental quality and housing conditions were employed The indicators follow from an adaptation of the major risk factors of unhealthy living conditions of the WHO and from disease promoting habitat conditions highlighted in relevant theories. Primary data on household incidence of malaria was also collected from the study area.
Results: The construct recorded a reliability coefficient of 0.979 while the factor-analytic procedure employed for validation identified three dimensions that accounted for 86.6% of the total variance in the construct. Its application in the analysis of the relationship between the quality of the living environment and the prevalence of malaria in urban Nigeria was further tested in the study. The result (r=-0.954, p<0.001) shows that there is a very strong and statistically significant negative correlation between the quality of the living environment and household incidence of malaria in the study area.
Conclusions: The RHQ model is sufficiently adequate to measure variations in residential environmental quality and becomes particularly useful in the identification of health risk habitats, and health planning for vulnerable population based on their places of residence.
Keywords: Residential habitat quality, Residential density, Neighborhoods, Malaria, Nigeria Department of Geography, University of Nigeria, Nsukka, Nigeria
Received: 19 December 2017 Revised: 17 January 2018 Accepted: 18 January 2018
*Correspondence: Dr. Yemi Adewoyin,
E-mail: yemiadewoyin@yahoo.com
Copyright: © the author(s), publisher and licensee Medip Academy. This is an open-access article distributed under the terms of the Creative Commons Attribution Non-Commercial License, which permits unrestricted non-commercial use, distribution, and reproduction in any medium, provided the original work is properly cited.
therefore is of utmost importance in determining health outcomes among the population.
In determining the quality of the residential environment, several measures have been employed. Most of these measures however centered on the subjective perceptions of the population resident in the neighborhoods of study.
7-13 The various indices employed in the studies largely
addressed housing quality, residential satisfaction, the population’s attachment to their places of residence, sense of place, and neighborhood attractiveness among others. While these measures have been replicated in the assessment of residential environmental quality in several other studies, their constructs were not designed to adequately capture disease-promoting factors in the residential habitat. Further, in traditional African urban settings, the choice of places of residence by the population is largely determined by income, affordability, and social status. With widespread poverty among the population, perceptions about environmental quality would obviously be biased.14
This study develops a model of residential habitat quality (RHQ) based on objectively verifiable indices with implications for health and disease exposure within the built environment in an African urban setting. The model will be useful in the identification of health risk habitats, population-at-risk of environmentally-induced diseases based on their places of residence within an urban center, priority intervention areas for disease prevention and control as well as health infrastructure planning. The applicability of the model is also tested using malaria as a case study. Malaria is environmentally-induced and endemic in Nigeria with all year transmission. According to the Nigerian National Malaria Elimination Programme (NMEP), 97% of the population is at risk of malaria.15 In essence, two research hypotheses; that the RHQ is a good predictor for the assessment of population health vulnerability based on places of residence, and that the quality of the living environment affects the incidence of malaria in the study area, are tested in this study.
METHODS
Data types, sources and collection
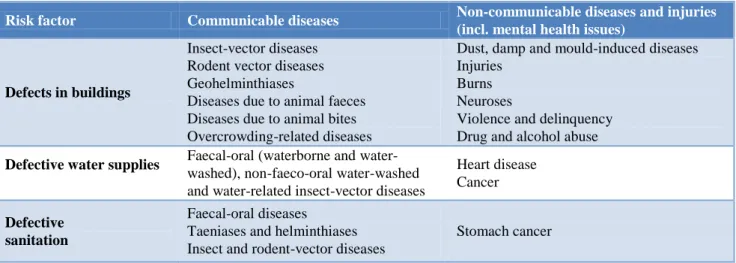
In constructing the Residential Habitat Quality (RHQ) model, 30 indicators measuring residential environmental quality and housing conditions were employed. The indicators (Table 2) follow from an adaptation of the major risk factors of unhealthy living conditions (Table 1) identified by the World Health Organization, and disease promoting habitat conditions highlighted in the discussed concepts.16 The indicators measured building conditions, availability of some basic facilities within the buildings, neighborhood aesthetics, proximity to disease vector habitats, and availability of social amenities within the residential neighborhood. The indicators were structured into two parts. The first part addressed items that were outside the buildings and measurable by the researcher by field observation while the second part addressed items that were internal to the building and on which only inhabitants of the sampled buildings could provide objective answers. Field observation checklist was employed for the former while a structured questionnaire was used to collect the second category of data.
Data on the incidence of malaria was collected from households through the use of questionnaire administered on household heads or the most senior (adult) member of the household in the absence of the head. The data on household incidence of malaria was measured by the frequency of malaria treatment in the households annually. The study did not utilize available data on clinically-diagnosed cases of malaria from health facilities in the selected neighborhoods as this has been found not to be a true representation of local incidence due to the influence of the population’s health seeking pattern, and the choice of treatment places not necessarily being around places of residence but more in close proximity to work places.17 The study was carried out between July 2016 and March 2017.
Table 1: Major risk factors of unhealthy living conditions.
Risk factor Communicable diseases Non-communicable diseases and injuries (incl. mental health issues)
Defects in buildings
Insect-vector diseases Rodent vector diseases Geohelminthiases
Diseases due to animal faeces Diseases due to animal bites Overcrowding-related diseases
Dust, damp and mould-induced diseases Injuries
Burns Neuroses
Violence and delinquency Drug and alcohol abuse
Defective water supplies Faecal-oral (waterborne and
water-washed), non-faeco-oral water-washed and water-related insect-vector diseases
Heart disease Cancer
Defective sanitation
Faecal-oral diseases
Taeniases and helminthiases Insect and rodent-vector diseases
Risk factor Communicable diseases Non-communicable diseases and injuries (incl. mental health issues)
Poor fuel and
ventilation Acute respiratory infection
Perinatal defects Heart disease
Chronic lung disease and cancer Burns
Poisoning Poor refuse storage
and collection
Insect-vector diseases Rodent-vector diseases
Injuries Burns
Defective food
storage and preparation
Excreta-related diseases Zoonoses
Diseases due to microbial toxins
Cancer
Poor location (near traffic, waste sites, industries, etc.)
Airborne excreta-related diseases
Enhanced infectious respiratory disease risk
Chronic lung disease Heart disease, cancer
Neurological/reproductive diseases Injuries
Psychiatric organic disorders due to industrial chemicals and Neuroses Source: WHO (1997)
Table 2: Indices of residential habitat quality.
Class of data S/N Index
Building condition
1 Number of people in building
2 Availability of mosquito net on windows 3 Adequacy of ventilation in building
4 Number of toilets in building
5 Location of toilet
6 Toilet type
7 Number of persons per toilet
8 Location of kitchen
9 Heat (temperature) regulation availability 10 Temperature regulation coverage
11 Internal roof type
12 Floor cover type
13 Cooking fuel
14 Water storage facility
15 Waste bin location
Neighborhood aesthetics
16 Proximity to dumpsite
17 Proximity to pool or stagnant water
18 Proximity to mechanic workshop
19 Proximity to industrial site
20 Proximity to market
21 Proximity to abattoir
22 Road condition
23 Drainage condition
Social services
24 Source of drinking water
25 Power supply constancy
26 Alternative power source
27 Public water supply
28 Proximity to health facilities
29 Type of health facility
30 Proximity to school
Source: Author’s adaptation (2016).
Population and sampling
The most vulnerable groups to attacks of malaria are pregnant women and children.15 The disease is also responsible for 30% hospitalization among children under the age of 5 in Nigeria.18 Malaria mortality among this cohort is however highest in South-West Nigeria at 50.3%.15 Ibadan, the erstwhile administrative headquarter and most populous city of South-West Nigeria, was purposively selected for the study. Apart from its malaria prevalence profile, it is also the country’s second most urbanized indigenous settlement and typifies the country’s urban centers in structure, composition and diversification. It has an estimated population of 3.2 million spread across 11 Local Government Areas (LGAs). Five of these LGAs are in the city center while the other six are peri-urban LGAs. The metropolitan LGAs are more urbanized and possess more diversification in terms of social stratification, occupation, and residential characteristics. The LGAs also have a mix of the traditional and modern city with multiple central business districts around which other land uses revolve. Further, within each of the metropolitan LGAs, population agglomerations have evolved into residential neighborhoods with high, medium and low residential population densities which can be associated with various shades of economic and social classes.
In the sub-urban LGAs, residential densities have little or no correlation with economic or social status of the residents. Low residential density neighbourhoods in the peri-urban areas of Ibadan are mostly as a result of large uninhabited and unused expanse of land, undeveloped
plots and farmlands, and not as a result of a careful planning for low residential land-use as obtained in the metropolitan LGAs. These characterizations define most urban centers in Nigeria. A multi-stage sampling technique was employed in the study. The 5 metropolitan LGAs were purposively sampled for their diversity and representativeness of other urban centers. Within each of the selected LGAs, neighborhoods with high, medium and low residential population densities were further selected using the stratified sampling technique. This classification along residential density lines was aimed at selecting localities of contrasting social and environmental characteristics within each of the LGAs. Such classification, though not exhaustive, provides a useful generalization for any analysis involving urban variations in the spatial pattern of a phenomenon of study.19 Ibadan is renowned for governance, higher education, research, commerce, tourism, and healthcare.
Field observation was conducted in the three residential neighborhoods selected per LGA while the questionnaires were administered in selected households. The households were selected from each of the neighborhoods using a clustered sampling technique. According to the Nigerian National Bureau of Statistics (NBS), there are approximately 4 persons per household in urban centers in Nigeria.20 Working with this background; the number of households in the selected neighborhoods was computed from the national population census figures to be 43,377. And using a confidence level of 95% and a confidence interval of ±3% on the total sample, a total of 1,084 households (2.5% of total sample) were selected for the questionnaire administration.21 The breakdown of the study sample is shown in Table 3.
Table 3: Details of study sample.
S/N Local
government area
Selected neighborhood
Residential
density Population
Computed number of households
Number of questionnaire administered
1 Ibadan north
Ikolaba Low 6,575 1,644 41
Basorun Medium 4,156 1,039 26
Yemetu High 11,763 2,941 74
2 Ibadan NW
Idi-Isin Low 2,398 600 15
Eleyele Medium 18,949 4,737 118
Abebi High 11,871 2,968 74
3 Ibadan NE
Agodi Low 8,959 2,240 56
Old Ife Road Medium 11,903 2,976 74
Elekuro High 12,300 3,075 77
4 Ibadan SE
Felele Low 22,136 5,534 138
Challenge Medium 10,675 2,669 67
Idi-Aro High 10,047 2,512 63
5 Ibadan SW
Oluyole Estate Low 5,097 1,274 32
Molete Medium 5,293 1,323 33
Foko High 31,384 7,846 196
Total 43,377 1,084
Source: NPC (1991), Author’s computation (2016).
Data analysis
The responses from the questionnaire were coded appropriately to reflect magnitude, and in conjunction with the data from the field observation on the selected neighborhoods, standard scores were generated for the neighborhoods on each of the 30 items in the construct. In other words, a 15×30 matrix was developed showing the standard scores of the selected neighborhoods on each of the 30 indicators of residential habitat quality employed in the survey. After this preliminary analysis, a test of reliability for internal consistency was carried out on the data using the Cronbach’s alpha method. The Cronbach’s alpha coefficient is deemed most appropriate a measure of internal reliability for an instrument type as employed here.21-23 The construct was validated using Factor Analysis. Based on the total variance explained, 3 factors were identified from the test of validity and these were employed to rank and group the selected neighborhoods on a residential habitat quality scale using the Hierarchical Cluster technique. The Spearman Rank Correlation technique was thereafter employed to determine the relationship between neighborhood quality and the incidence of malaria.
RESULTS
Reliability test and construct validity
The result of the reliability test, which simply is the proportion of the true variance to the total variance in the items employed to measure what they intend to measure, yielded an alpha coefficient of 0.979. In testing the construct validity using factor analysis, a minimum eingenvalue of 1.00 was employed for the extraction of the principal components from the original variables. The basic hypothesis of the factor analysis technique is that each of the initial indicators comes from a combination of common dimensions and that the dimensions (Factors) are fewer than the observed variables while yet explaining a greater fraction of the original variables.24 From the analysis, three factors emerged and they collectively explained 86.555% of the total variance in the original data set. While the first factor with an eingenvalue of 20.524 accounted for 68.413% of the total variance, the second factor has an eingenvalue of 3.785 and explained 12.618% of the total variance. The third factor accounted for 5.525% of the total variance and has an eingenvalue of 1.657.
Factors of residential habitat quality
The normal varimax rotation of the extracted Factors was carried out with a view to achieving a much simpler structure in which each Factor affects a few variables and each variable is correlated with a few Factors and to reduce the number of intermediate scores by maximizing the number of high and low loadings. From the factor matrix, 25 of the original variables loaded highly (score ≥0.5000) on the first factor while five variables loaded
highly on the second factor. Only three variables loaded higher than 0.4000 on the third factor (Table 4).
Table 4: Rotated factor matrix of habitat quality indicators.
Factor
1 2 3
No of people in building 0.939 0.296 0.054
Availability of mosquito net 0.932 -0.136 -0.192
Ventilation adequacy 0.936 -0.244 -0.142
No of toilets 0.866 -0.002 -0.262
Location of toilet 0.892 -0.354 -0.136
Toilet type 0.887 -0.381 -0.144
No of people per toilet 0.906 0.246 0.133
Location of kitchen 0.906 -0.307 -0.183
Available temperature
regulator 0.959 0.054 -0.067
Temp regulator coverage 0.942 0.047 0.144
Internal roof type 0.936 0.198 -0.017
Floor cover type 0.960 0.129 0.014
Cooking fuel 0.984 0.023 0.016
Water storage 0.914 0.288 0.085
Waste bin location 0.463 0.794 0.122
Drinking water source 0.229 -0.747 0.409
Power supply regularity 0.341 0.696 0.406
Alternative power source 0.938 -0.207 -0.141
Distance to nearest
dumpsite 0.872 0.121 0.113
Distance to nearest pool of
water 0.885 0.110 0.301
Distance to nearest
mechanic workshop 0.804 0.187 0.255
Distance to nearest
industrial site -0.297 0.762 0.114
Distance to nearest market 0.920 0.138 0.267
Distance to nearest abattoir 0.923 0.131 0.269
Road surface condition in
neighborhood 0.700 0.468 -0.034
Drainage condition in
neighborhood 0.739 0.538 -0.014
Public water supply
availability -0.069 0.074 0.934
Distance to nearest health
facility 0.834 0.184 0.056
Type of health facility 0.774 0.107 0.276
Distance to nearest school 0.874 -0.005 0.188
Extraction method: principal component analysis. rotation method: varimax with kaiser normalization. A. Rotation converged in 7 iterations.
Source: Author’s computation, 2017.
Spatial pattern of habitat quality
among the neighborhoods becomes evident. On the first dimension, Oluyole Estate, Idi-Isin and Ikolaba performed very well with Felele, Basorun and Agodi following closely. Oluyole Estate, Idi-Isin, Ikolaba, Felele and Agodi are low density residential neighborhoods while Basorun is a medium density neighborhood. Other medium density neighborhoods had negative scores tending towards zero while all high density neighborhoods had high negative scores on the first factor. The highest negative scores of 1.6538 and -1.56872 were recorded by Idi-Aro and Foko respectively. Idi-Isin led the pack on the second dimension while Ikolaba, Idi-Aro, Foko, Elekuro and Oluyole Estate were the other neighborhoods that recorded positive scores on the dimension. Other neighborhoods recorded negative scores. On the third dimension, Oluyole Estate, Eleyele, Yemetu, Abebi, Foko and Idi-Aro had positive scores while the other neighborhoods recorded negative scores.
Table 5: Performance of neighborhoods on habitat quality dimensions.
Neighborhood Factor 1 Factor 2 Factor 3
Oluyole 1.63881 0.25829 2.34231
Idi-Isin 1.35609 1.94582 -0.61977
Ikolaba 1.18717 1.14105 -0.7356
Felele 0.69929 -0.53912 -0.02549
Basorun 0.63341 -0.24463 -0.94804
Agodi 0.30874 -0.81537 -0.16863
Eleyele -0.12003 -0.69818 0.64175
Old-Ife Rd -0.01803 -0.7021 -1.15519
Molete -0.03876 -1.24879 -0.13178
Challenge -0.09743 -1.00008 -0.41258
Yemetu -0.64688 -0.50972 0.7936
Abebi -0.71884 -0.58239 0.77476
Elekuro -0.96103 0.32336 -1.52042
Idi-Aro -1.6538 1.42748 0.07947
Foko -1.56872 1.24437 1.08561
Source: Author’s computation, 2017.
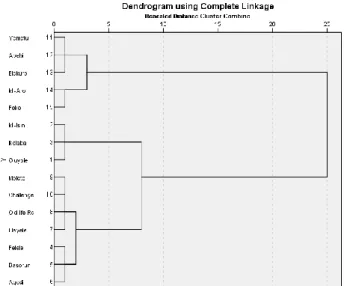
To determine the aggregate performance of the neighborhoods as well as their ranking on the RHQ index, a Hierarchical Cluster analysis was carried out. The Hierarchical Cluster analysis is a grouping technique that employs the similarities in responses to several variables to group cases. Using the Between-Groups Linkage method of clustering and Squared Euclidean Distance as a measure of the interval between the groups, the weighted factor scores (factor score multiplied by the value of variance explained by the factor) for each of the neighborhoods on the three dimensions of habitat quality were employed as input data for the Hierarchical Cluster analysis. The Squared Euclidean Distance as a measure of interval was employed because it shows a dissimilarity matrix that attenuates the differences between clusters of similar cases thereby making cluster boundaries more obvious. The result (Figure 1) shows five distinct clusters with Yemetu, Abebi and Elekuro in cluster 1, Idi-Aro and Foko in cluster 2 and Idi-Isin, Ikolaba and Oluyole Estate
in cluster 3. Molete, Challenge, Old-Ife Rd and Eleyele were in cluster 4 while Felele, Basorun and Agodi were in the fifth cluster.
Figure 1: Hierarchical clusters of neighborhoods on habitat quality.
Source: Author’s analysis, 2017.
Residential habitat quality and disease incidence
The responses from the households on their frequency of treating episodes of malaria on an annual basis revealed that 35.3% of the respondents treated episodes of malaria in their households at least 10 times in a year, 55.4% treated malaria between 5 and 9 times annually while 9.2% of the respondents treated malaria in less than 5 times in a year. Respondents from the 5 high density residential localities accounted for 62.9% of those who treated malaria in their households 10 times and more just as about 52% of the respondents who treated household malaria less than 5 times per annum were from the low density residential areas. The proportional distribution in the neighborhoods is illustrated in Table 6. The average frequency of treatment for each neighborhood was computed and this was employed in ranking the neighborhoods with 1 being the neighborhood with the highest frequency of treatment and 15 being the lowest. The rank is also shown in Table 6.
Table 6: Proportional distribution of household treatment of malaria.
Cluster rank Neighborhood 10 Times and above 5–9 times Less than 5 times HMITF rank*
1 Idi-Isin 13.33 53.33 33.33 14
1 Ikolaba 17.07 60.98 21.95 13
1 Oluyole Estate 9.38 59.38 31.25 15
2 Basorun 26.92 50 23.08 11
2 Agodi 21.43 60.71 17.86 12
2 Felele 27.54 59.42 13.04 8
3 Challenge 14.93 74.63 10.45 10
3 Eleyele 27.97 59.32 12.71 7
3 Molete 24.24 63.64 12.12 9
3 Old-Ife Rd 29.73 58.11 12.16 6
4 Abebi 41.89 55.41 2.7 4
4 Elekuro 49.35 48.05 2.6 3
4 Yemetu 32.43 66.22 1.35 5
5 Foko 57.65 41.84 0.51 1
5 Idi-Aro 55.56 42.86 1.59 2
*Household malaria incidence treatment frequency; Source: Author’s computation, 2016.
DISCUSSION
The result of the reliability test conducted on the RHQ model items implies that the internal consistency of the items in measuring residential habitat quality is very high. When squared, the reliability coefficient becomes a coefficient of determination and it accounts for 96% of the total variance in the items’ measure of residential habitat quality in the study area. By explaining about 87% of the total variance through the factor-analytic validation of the construct, the items also adequately and sufficiently measure residential habitat quality. Further, the emergence of 3 factors implies that explaining the spatial variations in the quality of residential environment in the study area can be achieved along 3 major dimensions. Out of the 25 variables loading on factor 1, those measuring internal housing conditions were most prominent with very high scores. These variables include cooking fuel, floor cover type, availability of temperature regulators and their coverage within the house, and adequacy of ventilation among others. The location of waste bin, distance to industrial sites, drainage condition and road surface conditions were the variables on the second factor while water source and availability and power supply were the items on the third factor. From the foregoing, the three dimensions underlying an understanding and assessment of habitat quality in the study area are; internal housing conditions, neighborhood conditions, and water and electricity.
From the analysis, the hierarchy of neighborhoods on the RHQ index indicates that Idi-Isin, Oluyole Estate and Ikolaba ranked best in habitat quality followed by Agodi, Basorun and Felele. The neighborhoods in the cluster 4 followed in habitat quality ranking while Foko and Idi-Aro had the poorest residential habitat quality. The clusters are almost reflective of the initial categorization of the study neighborhoods along residential density
lines. The variations can be explained by the fact that beneath the blanket of residential density categorization, neighborhoods bear characteristics that make them unique, such that within a residential density category, there abound variations in the quality of the living environment. Hence, Felele and Agodi, though low density neighborhoods, differ from Oluyole Estate, Ikolaba and Idi-isin with higher residential environmental quality. Foko and Idi-Aro also differ from other high density neighborhoods with their poorer living conditions.
As evident from the frequency of malaria treatment in the households along residential density lines, respondents in the high density neighborhoods constituted about 63% of households that treated malaria at least ten times annually. These localities have the poorest habitat conditions characterized largely by stagnant water, poor drainage network, and inadequate waste disposal systems that allow for unfettered breeding of the malaria vector, mosquito. These neighborhoods performed poorly on all the three weighted dimensions of residential habitat quality. It was not surprising therefore to record an inverse correlation between residential habitat quality and malaria incidence such that neighborhoods with better habitat quality had lower incidence of malaria while the incidence was higher in neighborhoods with poorer habitat conditions. In effect, the variation in habitat quality among the different neighborhoods underlies the prevalence pattern of malaria in the neighborhoods. Habitat conditions in residential areas have been shown to have implications for exposure to or protection from diseases, and equally affect susceptibility or resistance to diseases.2,25-27
the urban centers. As argued, income inequality produces residential agglomeration and social segregation with negative consequences for health.28-30 With such residential agglomeration that has clearly shown that some neighborhoods have better building conditions, are more aesthetically pleasing, and have more numbers of social infrastructures than the others, it is not unexpected that health outcomes among the residents of these different neighborhood classes will vary as shown in this study. The RHQ model thus, has the capacity to integrate wealth index, as exemplified by the type of building people live, the facilities there-in and around it, and the neighborhoods where such buildings are found. Because these are an integral of residential environmental quality, and are captured alongside other health risk habitat conditions found in the RHQ model, the model was successfully applied in mapping the spatial variation of malaria, an environmentally-induced disease, in the study area.
CONCLUSION
The research has shown that the RHQ model is sufficiently adequate to measure the variations in residential environmental quality in urban settings. The internal consistency and validity of its constructs are also high enough for adoption and application in urban settings of similar compositional characteristics, especially in Africa. Following from the established relationship between the quality of the living environment and the incidence of environmentally-induced disease in the study area as shown in the study, the model becomes particularly useful in the mapping of health risk habitats and the identification of vulnerable population based on their places of residence. This identification is essential for disease prevention and control and more broadly, for population health planning and social development.
ACKNOWLEDGEMENTS
The author acknowledges the contributions of Professor Aina Thompson Adeboyejo of the Department of Urban and Regional Planning, Ladoke Akintola University of Technology, Ogbomoso, Nigeria in the conceptualization of this work. No funding was received for this work and the author declares no conflict of interests.
Funding: No funding sources Conflict of interest: None declared Ethical approval:Not required
REFERENCES
1. Dubos R. Man adapting. New Haven, Yale University Press. 1965.
2. Iyun BF. Ecology and disease in Nigeria. Geographica Medica; 1987: 17.
3. Iyun BF, Verhasselt Y, Anthony H (eds). The health of nations: medicine, disease and development in the third world. Avebury; Aldershot. 1995.
4. Baba JM, Jinadu AM. Analysis of spatial variations in the occurrence of housing environment-related diseases in Minna metropolis. J Environ Studies. 2008;2:114-21.
5. Caminade C, Kovats S, Rocklov J, Tompkins AM, Morse AP, Colon-Gonzalez FJ, et al Impact of climate change on global malaria distribution. Potsdam Institute for climate impact research, Potsdam, Germany; 2014.
6. Campbell AP, Converse E, Rogers WL. The quality of american life: perceptions, evaluations and satisfactions. New York: Russell Sage Foundation. 1976.
7. Connerly CE, Marans RW. Comparing two global measures of perceived neighbourhood quality. Social Indicators Research. 1985;17(1):29-47. 8. Currie R, Thacker C. Quality of the urban
environment as perceived by residents of slow and fast growth cities. Social Indicators. 1986;18(1):95-118.
9. Grubber KJ, Shelton GG. Assessment of neighbourhood satisfaction by residents of three housing types. Social Indicators Res. 1987;19(3):303-15.
10. Ha, M, Weber, JW. The determinants of residential environmental qualities and satisfaction: effects of financing, housing programs and housing regulations. Housing and Society. 1991;18(3):65-76. 11. Bonaiuto M, Aiello A, Perugini M, Bonnes M, Ercolani AP Multidimensional perception of residential environment quality and neighbourhood attachment in the urban environment. Journal of Environmental Psychology. 1999;19:331-52. 12. Bonaiuto M, Fornara F, Bonnes M. Indexes of
perceived residential environment quality and neighbourhood attachment in urban environment: a confirmation study on the city of Rome. Landscape and Urban Planning. 2003;65:41-52.
13. Debek M, Janda-Debek B. Perceived residential environmental quality and neighbourhood attachment (PREQ & NA) indicators by Marino Bonaiuto, Ferdinando Fornara and Mirilia Bonnes – Polish adaptation. Polish J Applied Psychol. 2015;13(2):111-62.
14. United Nations Population Fund. The state of world population. UNFPA. 2015.
15. National Malaria Elimination Programme. National malaria strategic plan 2014 – 2020. Federal Ministry of Health, Abuja; 2014.
16. World Health Organization. World health report. New York: WHO, 1997.
18. Nigeria. President’s malaria initiative; malaria operations plan. Abuja: FG Press; 2013.
19. Ayeni MAO. The metropolitan area of Ibadan; its growth and structure in Filani MO (ed) Ibadan Region. Ibadan: Rex Charles; 1982.
20. National Bureau of Statistics. Social statistics in Nigeria. Abuja; FG Press; 2009.
21. Cohen L, Manion L, Morrison K. Research methods in education (6th edition). London: Routledge; 2007.
22. Onocha CO, Okpala PN. Tools for educational research. Ibadan, Stirling-Horden. 1995.
23. Kerlinger FN, Lee HB. Foundations of behavioural research, Fourth edition. London, Wordsworth. 2000.
24. Cole JP, King C. Quantitative geography. London: John Wiley; 1968.
25. Meade M, Florin J, Geisler W. Medical geography. New York: The Guilford Press; 1988.
26. Egunjobi L. Urban environmental health and physical planning. In Iyun BF, Verhasselt Y and Anthony H. (eds) The health of nations: medicine, disease and development in the third world. Avebury; Aldershot; 1995.
27. Adewoyin Y, Adeboyejo AT. People, places, and health variations; a case of malaria incidence in Ibadan, Nigeria. African Population Studies. 2016; 30(2):3006-15.
28. Kawachi I, Kennedy BP. Socio-economic determinant of health: health and social cohesion, why care about income inequality? Br Med J. 1997;314:1037.
29. Macintyre S, Ellaway A, Cummins, S. Place effects on health; how can we conceptualize, operationalize and measure them? Social Sci Med. 2002;55:125-39.
30. Kaplan G. People and places; contrasting perspectives on the association between social class and health. Int J Health Services. 1996;26(3):507-19.
Cite this article as: Adewoyin Y. A residential habitat quality model for population health