57
Evaluation of implementation an Integrated Safety and Preventive
Maintenance System for Improving of Safety Indexes
Iraj Mohammadfam
1,A. Shafkhani*
1, A Soltanian
11) Department of Occupational Health and Safety, Faculty of Health, Hamadan University of Medical Sciences, Iran
*
Author for Correspondence: [email protected]
Received:.21 Dec. 2013, Revised:. 7 Feb. 2014,, Accepted:. 18 Mar. 2014
ABSTRACT
Accident analysis shows that one of the main reasons for accidents is non-integration of maintenance units with safety. Merging these two processes through an integrated system can reduce and or eliminate accidents, diseases, and environmental pollution. These issues lead to improvement in organizational performance, as well. The aim of this study is to design and establish an integrated system for obtaining the aforementioned goal. Integration was carried out at Nirou Moharreke Machine Tools Company via Structured System Analysis & Design Method (SSADM). In order to measure the effectiveness of the system, selected indexes were compared using statistical methods prior and after system establishment. Results show that the accident severity index reduced from 135.46 in 2010, to 43.85 in 2012. Moreover, system effectiveness improved equipment reliability and availability (e.g. reliability of the Pfeiffer Milling machine (P (t>50)) increased from 0.89 in 2010, to 0.9 in 2012. This system by forecasting various failures, and planning and designing the required operations for preventing occurrence of these failures, plays an important role in improving safety conditions of equipment, and increasing organizational performance, and is capable of presenting an excellent accident prevention program.
Key words
: Safety, Preventive Maintenance, Integrated system, Structured System Analysis and Design Method (SSADM)I
NTRODUCTIONOne of the unpleasant consequences of industrialization is a rise in the number of job accidents. This high number of accidents has become a major concern for both developing and developed countries, as the World Health Organization considers them as an epidemic phenomenon in the general health field. Obviously accidents are costly for both societies and industries, therefore should be prevented as much as possible.
A brief literature review indicates that there is a close relationship between maintenance and occurrence of major accident. This leads to development of a new tendency toward considering the risk as a planning criterion for maintenance measures. Using a hybrid approach of the maintenance and safety, some authors proposed a suitable meaning for optimization of the factories’ potentials. They believe that safety and maintenance are not strictly interactive functions and factors. Table 1 indicates a literature review in this field of study [3].
Table 1: literature review of the safety and Maintenance field of study
Author Literature review Year
Kelly et al. Investigate the systematic approach of the safety in maintenance; the paper evaluates safety
aspects in maintenance in Defense Ministry of the UK [4] 2001
Farrington et al. Investigate safety culture in maintenance of railroad; in this paper the problems of the insecure
behavior and effect of safety in maintenance of the railroad is discussed [5] 2005
Eti et al.
Discuss the reliable integration and availability of the equipment; they performed risk assessment in the maintenance unit. The results was an improvement in activities of the AFAM fossil fuel Plant in Britain [6]
2006
Herrera et al.
Study safety of airline transportation and maintenance based on the main organization changes; this paper investigates the effects of simultaneous organization changes on management system of the safety and maintenance in airline study of Norway [7].
2009
Oingfent et al.
Consider development and application of the maintenance of the equipment and its integration with management system; the paper simultaneously studies the attitude change in the maintenance and safety and reliability of the equipment from the traditional to the modern approach in China’s industry [8].
2011
Atak et al. Study safety culture in Airplane Maintenance Organization; this is a case study on safety culture
57
Qingfeng et al. (2011) indicates that lack of appropriate planning in maintenance and fix process are among the most important causes of accidents, that can lead to occurrence of an unpredicted failure in the equipment and consequently irreversible accidents and costs for both the firm and beneficiaries; where this cost is independent from the economic costs imposed to the firms due to stopping the production [8]. In this regard, some petrochemical industries have successfully reduced their costs down to 50 % through applying some programs for simultaneous improvement of the safety and accessibility to the equipment [10]. Thus, integration of these two processes with a whole system can lower the likelihood of accident occurrences, illnesses, and environmental pollutions. Consequently, these factors lead to an improvement in organization performance [8, 11]. The purpose of this study is to design and establish an Integrated Safety and Preventive Maintenance System for Improving Safety Indexes at the Nirou Moharreke Machine Tools Company.MATERIAL
AND
METHODS
The present study is local, descriptive, retrospective work conducted to investigate and compare indexes of safety and maintenance both prior to and after implementation of the integrated safety, maintenance system and evaluation of the partial effect of the system. The required data were gathered by means of observation and interviews. The archived documents of the firm were studied, as well. The gathered data were analyzed using
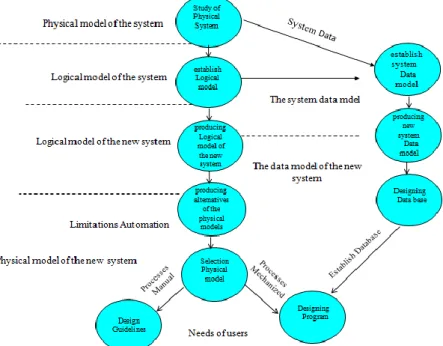
SPSS software package. Besides, different parts of the firm, such as registration and archive units, were considered as the research environment. This study was conducted in the following 7 steps: First, after being familiar with the system and accurate detection of its elements, a number of safety and maintenance indexes were determined, measured, and analyzed to clarify the partial effect of system implementation by these indexes. There are a large number of methods for determination of the partial effect of the safety programs, each of them had a specific value in the specific occasions. Regarding the limitations of the studied firm in this work, a set of safety and maintenance indexes were selected to determine efficacy of the model. The safety indexes of this study are accident frequency rate (AFR), accident severity rate (ASR), and incident rate (IR); chosen through study of the scientific contexts. Besides, owing to the fact that reliability and safety are measured using a set of predefined parameters such as reliability, availability, mean time to failure, etc., in this work 12 statistical indexes were applied to determine simultaneous efficacy of the system on safety and maintenance unit. The indexes are as follows: rate of failure, reliability, unreliability, availability, unavailability, failure probability, mean time to failure (MTTF), mean time to repair (MTTR), mean time between failures (MTBF), mean time to fail safely (MTTFS), mean time to fail dangerously (MTTFD) and number of dangerous failures. Steps 2 to 6 are allocated to integration, analysis, and design of the system based on structured system analysis design method (SSADM). Figure 1 presents flow diagram of these steps.
55
SSADM was developed in the late 1970’s by three researchers: Demarco, Gane, and Sarsson. This method is a member of the developed information system methods family which is applied as the most important analysis and design method for information systems in England. Similar to many other structured system methods, this method implements an information system in the form of an engineering project, so it can be considered as a data-oriented methodology. Here, the logical structure of the system data and their internal relationships are modeled. For completed logic design of the data, SSADM applies two techniques, i.e., “logic data organization” and “relational data analysis”, and then combine their results. Logic data organization is a top-down approach where the smallest information component is accurately analyzed to generate a complete and flexible data organization [12-16].In this research SSADM was applied for assigning a completely clear objective and domain at each step for achieving the desired output. The expected output in this methodology involves the programs and databases which are applied for system implementation. In the second step, as the first step of this methodology, the inputs and outputs of the safety and maintenance system was detected through evaluation of the system elements, study of the documents, interviews with the experts, and system history analysis. Then, to determine the relationship type between safety and maintenance system, physical data flow diagram (what does the system? How the tasks are performed? Who and when perform the tasks?) of the safety and maintenance was plotted. In the third step, as the second step of this methodology, the physical data diagram of the present system was converted to the logic data diagram (what does the system?) to analyze status of the physical data flow diagram (DFD) of the safety and maintenance process and evaluate the soundness or wrongness of the performance in the system. In step 4, as the third step of this methodology, in order to design a new system, the analyzed logic data flow diagram was converted to the new logic data flow diagram of the system (what systems is allowed to do (do’s and not do’s). To do so, it is required to add the new relationships and processes to the logic data flow diagram of the present system or remove their unnecessary relationships and processes. In step 5, as the fourth step of this methodology, physical data flow diagram of the new system was plotted based on the new logic data flow diagram. In this step the considered firm was chosen based on the defined requirements in a gradual manner and were converted to physical requirements. In other words, the logic DFD of the new system was converted to the desired physical DFD; i.e., they were modeled based on logic diagrams (the ones required by the new system), the physical models (how do satisfy
these requirements) were modeled. This was done for instant development of an integrated safety and maintenance system in the studied firm. The 6 step, as the fifth step of this methodology, was performed to determine the boundaries between human and machineries in the form of a system; i.e., new and conventional duties of each safety and maintenance units were defined. A database was created for the zones placed in machinery boundary and their data modeling was organized and documented. In this step, the system was completed and a proper guideline was defined through implementation program including conversion programming of the new system instead of the old one. The new system was implanted in the form of management information system (MIS) in “Nirou Moharreke Machine Tools Inc.” and monitored for 6 months. Then, in step 7, as the sixth step of SSADM, after 6 months, the indexes mentioned in step 1 were measured again and their changes induced by the mentioned intervention were evaluated using the statistical Wilcoxon test. It should be noticed that the mentioned system was implemented for 6 months and after passing another 6 month period these indexes were monitored again.
RESULTS
The findings of this work include two parts. First, the findings about safety indexes are analyzed and in the second part, findings of the common indexes of the safety and maintenance are investigated. Safety index findings before and after system implantation
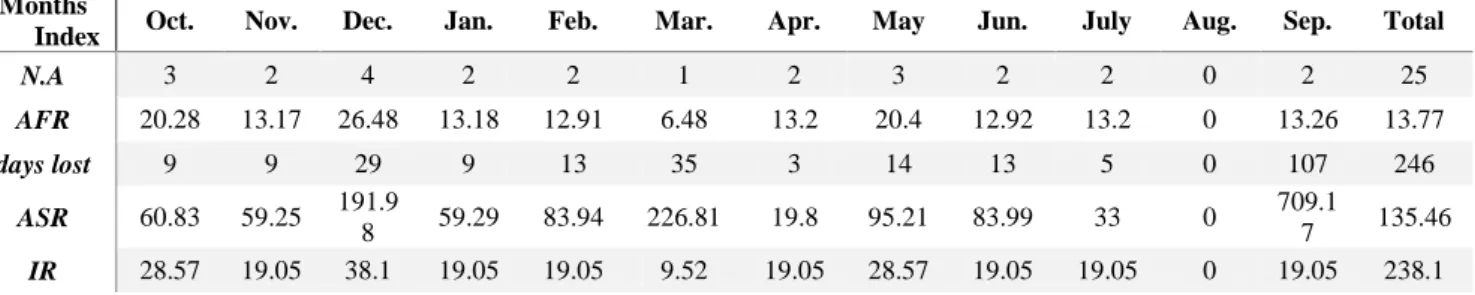
Tables 2 and 3 show safety indexes before and after system implantation. As shown in the tables, in the year before system implantation 25 accidents have been occurred as AFR was 13.77, severity rate, 135.46, and incident rate, 238.10. In the years after system implantation these values are as: number of accidents (N.A): 13; AFR: 7.13; severity rate: 43.85; incident rate: 126.21. Statistical expression of these indexes is prepared using the Wilcoxon statistical test (table 4). The statistical analysis indicates that AFR, severity rate, and incident rate have p-value ≤ 0.05; hence, it can be inferred that system implementation significantly improved each of these safety indexes in the studied firm. On the other hand, the results of Wilcoxon test (table 4) imply that the changes of incident rate are not statistically significant (p-value≥0.05).
57
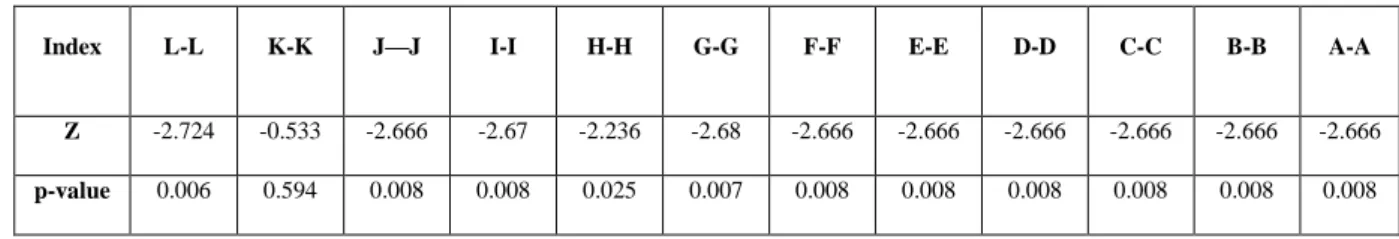
expressions of these indexes are introduced using the Wilcoxon test in table 7. The statistical analysis indicates that the indexes including failure rate, reliability, unreliability, availability, unavailability, failure probability mean time to failure, mean time to repair, mean time between failures, mean time to fail dangerously, and number of dangerous failures had p-value ≤ 0.05. Therefore, through comparingthese indexes before and after system implementation it was observed that system implementation can improve these indexes. The results of statistical tests about one of the indexes indicated that p-value of the mean time to fail safely (MTTFS) is not statistically significant (p-value≥0.05).
Table 2: Safety index findings before system implantation (2010)
Months
Index Oct. Nov. Dec. Jan. Feb. Mar. Apr. May Jun. July Aug. Sep. Total
N.A 3 2 4 2 2 1 2 3 2 2 0 2 25
AFR 20.28 13.17 26.48 13.18 12.91 6.48 13.2 20.4 12.92 13.2 0 13.26 13.77
days lost 9 9 29 9 13 35 3 14 13 5 0 107 246
ASR 60.83 59.25 191.9
8 59.29 83.94 226.81 19.8 95.21 83.99 33 0
709.1
7 135.46
IR 28.57 19.05 38.1 19.05 19.05 9.52 19.05 28.57 19.05 19.05 0 19.05 238.1
Table 3: Safety index findings after system implantation (2012)
Months
Index Oct. Nov. Dec. Jan. Feb. Mar. Apr. May Jun. July Aug. Sep. Total
N.A 1 0 0 4 2 1 0 1 2 0 1 1 13
AFR 6.7 0 0 26.06 13.25 6.5 0 6.51 12.95 0 6.49 6.63 7.13
days
lost 7 0 0 38 4 3 0 6 14 0 3 5 80
ASR 46.89 0 0 247.55 26.5 19.5 0 39.0
4 90.62 0 19.47 33.15 43.85
IR 9.71 0 0 38.83 19.42 9.71 0 9.71 19.42 0 9.71 9.71 126.21
Table 4: Results of the Wilcoxon test for Safety indexes
Index FR- FR SR- SR IR – IR
Z -2.095 -2.040 -1.337
p-value .036 .041 .181
57
Table 5: Findings of the common safety, maintenance indexes before system implantation (2010)
Equipment
CNC milling machine (Pfeiffer)
CNC center milling machine
Grinding machine
Universal milling machine
Hydrolic press machine
Guillotine machine
Press brake machine
Decoiling machine
CNC Punching machine Failure
Distribution Function
EXP(β=400) EXP(β=540) EXP(β=6
70)
EXP(β=2 90)
EXP(β=6 30)
EXP(β=2 50)
EXP(β =220)
EXP(β=6 50)
EXP(β=30 0)
Rate of Failure 0.0025 0.0019 0.0015 0.0034 0.0016 0.004 0.0045 0.0015 0.0033
Reliability P(t
> 50) 0.88 0.91 0.93 0.84 0.92 0.82 0.8 0.93 0.85
Availability 0.995 0.989 0.9985 0.9831 0.9937 0.9921 0.991 0.9939 0.9804
Failure Probability
P(50≤t≤100) 0.1037 0.0806 0.0667 0.1333 0.0705 0.1484 0.162 0.0686 0.13
MTTF 400 540 670 290 630 250 220 650 300
MTTR 2 6 1 5 4 2 2 4 6
MTBF 402 546 671 295 634 252 222 654 306
MTTFD 1339.59 2597.83 1771.3 1550.83 1041.14 1290.24 1071.7
6 1121.02 1488.14
MTTFS 487.12 577.29 1062.78 357.88 1735.23 322.56 315.22 1401.28 343.42
No. of Dangerous Failures
4 2 3 3 5 4 5 5 3
Table 6: Findings of the common safety, maintenance indexes after system implantation (2012)
Equipment
CNC milling machine (Pfeiffer)
CNC center milling machine
Grinding machine
Universal milling machine
Hydrolic press machine
Guillotine machine
Press brake machine
Decoiling machine
CNC Punching
machine
Failure Distribution
Function
EXP(β=500) EXP(β=620) EXP(β=780) EXP(β=400) EXP(β=700) EXP(β=350) EXP(β=300) EXP(β=800) EXP(β=410)
Rate of
Failure 0.002 0.0016 0.0013 0.0025 0.0014 0.0029 0.0033 0.0013 0.0024
Reliability
P(t > 50) 0.9 0.92 0.94 0.88 0.93 0.87 0.85 0.94 0.89
Availability 0.996 0.992 0.999 0.99 0.996 0.994 0.993 0.996 0.988
Failure Probability P(50≤t≤100)
0.086 0.071 0.058 0.104 0.064 0.115 0.13 0.057 0.102
MTTF 500 620 780 400 700 350 300 800 410
MTTR 2 5 1 4 3 2 2 3 5
MTBF 502 625 781 404 703 352 302 803 415
MTTFD 1712.88 5408.98 4715.6 2312.31 2691.39 2397.66 1607.14 1705.69 5338.92
MTTFS 734.09 676.12 943.12 513.85 1076.55 479.53 401.79 1279.27 410.69
No. of Dangerous
Failures
78
Table 7: Results of the Wilcoxon test for common safety, maintenance indexes
A-A B-B
C-C D-D
E-E F-F
G-G H-H
I-I J—J K-K
L-L Index
-2.666 -2.666
-2.666 -2.666
-2.666 -2.666
-2.68 -2.236 -2.67
-2.666 -0.533
-2.724
Z
0.008 0.008
0.008 0.008
0.008 0.008
0.007 0.025
0.008 0.008
0.594 0.006
p-value
MTTF compared before and after system
implantation G-G
Rate of failure compared before and
after system implantation A-A MTTR compared before and after system
implantation H-H
reliability compared before and after
system implantation B-B MTBF compared before and after system
implantation I-I
un reliability compared before and
after system implantation C-C MTTFD compared before and after system
implantation J—J
availability compared before and
after system implantation D-D MTTFS compared before and after system
implantation K-K
un availability compared before and
after system implantation E-E number of dangerous failures compared before and
after system implantation L-L
failure probability compared before
and after system implantation F-F
DISCUSSION
According to tables 2 and 3, it can be observed that the safety indicators (accident frequency rate and accident severity rate) have significantly improved after system establishment. This can be due to the nature of the mentioned system. Since it is a safety management and maintenance system and its efficiency is a direct indicator of functional efficiency, appropriate design, establishment, and mechanization in the investigated company could enhance safety performance of the organization. In this regard, parameters and controlling equipment, which guarantee safety of devices, were installed and also were monitored in daily visits, showing their effectiveness for enhancing of safety indicators.
Another factor that causes reduction of safety factors in this system is existence of a written procedure for each phase of suspension stages. Suspension is not a routine operation and, at this phase, always there is a possibility of occurring safety-related problems [17]. As it was illustrated in tables 2 and 3, incident rate has improved after establishment of the system; however, this improvement has not been considered significant in statistical tests framework. This point does not question credibility of the system since other indicators have been statistically significant. It should be noted that this indicator studies changeability in labor force and its impact on other incidents. On the other hand, as it is observed in
78
In this system, based on the 20-80 law, the most important contributing factors in failures of devices and accidents were identified in the data center of the mentioned system and based on them modifying and preventive actions were developed in a way that 20% of the factors that caused 80% of the accidents were eliminated. This led to the significant improvement of all indicators of safety and maintenance except MTTFS. Although there was no improvement in this indicator, it should be mentioned that MTTFS is the probability of safe failure occurrence; hence, it cannot question the credibility of the system. The indicator with higher importance is MTTFD that was improved significantly. Moreover, it should be noted that integration of safety and maintenance has been performed in a number of researches. For example, Kelly et al. [4], in the British Ministry of Defense, Eti et al. [6], in Afam Thermal Plant of Britain, and Qingfeng et al. [8], in China industry have put forward considerable effort in this field. However, the distinguishing point of the current investigation is the method of combination of these two procedures that is performed by the efficient SSADM methodology, which is in accordance with System Development Life Cycle (SDLC). This has led to improvement of the indicators of both processes. Therefore, this survey is a novel work in the literature. Other studies have improved safety factors by similar techniques. Farshad et al. investigated efficiency of the management system of HSE in improvement of some safety factors. They showed that proper implementation of the HSE management system can improve safety indicators in oil companies and their sub-organizations [18]. In addition, Adl et al. investigated the role of safety control in improvement of the indicators. They claimed that safety control can be an affecting factor in hazard identification and accident prevention [19].C
ONCLUSIONIn the present study, findings of both methods have been employed to design an integrated safety system. Hence, systematic and planned control by HSE procedure was added to information flows between two units that lead to the success of this integrated system. In this regard, this system is of great importance in safety enhancement by predicting failures and designing required actions to prevent them. Furthermore, it can propose a complete plan for accident prevention.
R
EFERENCES[1] Mohamadfam I, Evaluation of Occupational Accidents and Their Related Factors in Iranian Aluminum Company in 1999, Scientific Journal of Kurdistan University of Medical Sciences, 2001;5 (3): 18-23.
[2] Mehrparvar AH Mirmohammadi SJ, Ghovve MA, Hajian H, Dehghan M, Nabi Meybodi R, Nabi Meybodi N. Epidemiologic Study Of Occupational Accidents Recorded In Yazd Province In The Years 2007-2008, Occupational Medicine, 2012; 13(3): 54-62.
[3] Barzegar A, Shahanaghi K, Aryanezhad M, Maintenance Strategy Selection by Risk Based Inspection Approach. International Journal of Industiral Engineering & Producion Management, 2011; 22(2):193-04.
[4] Kelly TP, McDermid JA, A systematic approach to safety case maintenance. Reliability Engineering & System Safety, 2001; 71(3): 271-84. [5] Farrington-Darby T, Pickup L, Wilson J.R. Safety culture in railway maintenance, Safety Science, 2005; 43(1),:39-60.
[6] Eti M.C, Ogaji S, Probert S.D. Reducing the cost of preventive maintenance(PM) through adopting a proactive reliability-focused culture, Applied Energy, 2006; 83(11):1235-43.
[7] Herrera I.A, Nordskag A.O, Myhre G, Halvorsen K. Aviation safety and maintenance under major organizational changes, investigating non-existing accidents, Accident Analysis & Prevention, 2009; 41(6):1155-63.
[8] Qingfeng W, Wenbin L, Xin Z, Jianfeng Y, Qingbin Y, Development and application of equipment maintenance and safety integrity management system, Journal of Loss Prevention in the Process Industries, 2011; 24(4): 321-32. [9] Atak A, Kingma S. Safety culture in an aircraft maintenance organisation: A view from the inside, Safety Science, 2011; 49(2): 268-78.
[10] Azadeh A,. Mohammadfam I, Garakani M.M., A total ergonomic design approach to enhance the productivity in a complicated control system, Information Technology Journal, 2007; 6(7): 1036-42.
[11] Michel H, Mufeed A. Improve industrial process plant safety & availability via reliability engineering, Proceedings of the 2008 IEEE/ACS International Conference on Computer Systems and Applications, 1544368: IEEE Computer Society, 2008: 1021-26.
[12] Al-Ahmari A, Ridgway K. An integrated modelling method to support manufacturing systems analysis and design, Computers in Industry, 1999; 38(3): 225-38.
[13] Manteghi N, Jahromi S.K. Designing accounting ınformation system using SSADM1 Case Study: South Fars Power Generation Management Company (S.F.P.G.M.C), Procedia Technology, 2012;1(0): 308-12.
78
studies, Part 2: Experienced users, Information and Software Technology, 1989; 31(8): 420-28. [16] Wade S. A new course in systems analysis and design. International Journal of Information Management. 1991; 11(3): 238-47.[17] Mahoney D. Large property damage losses in the hydrocarbon-chemical industries : a thirty-year review. 14 ed: New York ,Marsh & McLennan, 1992.
[18] Farshad A.A, Khosravi Y, Alizadeh S. The Role of HSE management System in Improving health, safety and environment performance in an Oil Organization, Iranian Occupational Health Journal, 2006; 3(2): 6-11.