VOLUME 18 ISSUE 1 (2020), Page 118 – 130
LAND USE CHANGES IN RURAL TOWN: A CASE STUDY OF KUALA NERANG, KEDAH
Abdul Ghapar Othman1, & Nurul Hanisah Jizan2
School of Housing, Building and Planning
UNIVERSITI SAINS MALAYSIA
Abstract
Urbanization is the process of transforming a characteristically rural society into an urban one. The urban population is growing at an increasing rate while the rural population is declining, giving rise to imbalances in the development between urban and rural areas. The government’s strategy is to distribute the development to the major settlement centres in the rural areas, which are experiencing the same effects of urbanization as the urban areas in terms of changes to the use of land, especially the reduction of agricultural land and the increase in built-up areas. This study used the method of overlay in GIS applications to investigate land use changes, the speed of urban expansion and direction of development that has taken place from the period 2001 to 2018 in the town of Kuala Nerang, Kedah. This town has undergone a change in its status from a main settlement centre to a district administrative centre. Agricultural lands, which were targeted for development in the rural areas, have been converted into built-up areas. The speed of urban expansion has been slow, although some areas have recorded a higher rate. The development is moving towards the west along the main road connecting the major towns in this part of the state. The functions of the district administrative centre have influenced land use changes.
INTRODUCTION
Urbanization is the process of converting an area and its population into an urban pattern, pervaded with elements of urbanization. Urbanization transforms the character of a rural society into one that is generally urban (Embong, 2011). In Malaysia, the urbanization scenario can be divided into two stages, namely, before and after the 1970s. The first stage was the period following the Second World War until independence (1947-57), where the population was growing at an average rate of 6.2 percent annually, while the second stage of urbanization was after the implementation of the New Economic Policy in 1971, encompassing the industrial policies, agricultural development and urbanization of the country, which had a direct impact on the rate of growth of the urban population (Rostam, 2001). It can be seen that the number of people living in the urban areas has been on the rise until today. According to the Department of Statistics Malaysia (2010), the number of urban residents in the country has been increasing from 20.82 million (72%) in 2011 to 25.04 million (77%) by 2020.
This rise in the urban population has resulted in a decline in the number of people, especially youths, in the rural areas, from 8.2 million (28%) in 2011 to 7.4 million (23%) by 2020 (Department of Statistics Malaysia, 2010). This drop in the rural population in Malaysia has created an imbalance in the development between the urban and rural areas. This has led to the establishment of strategies and efforts by the government to distribute the urban development, especially in the industrial sector, to the rural areas through the existing development corridors in order to open up new growth centres that can offer employment opportunities to those living in the rural areas (Ngah, 2009).
LAND USE CHANGES IN RURAL AREAS
Land use activities refer to the actions of humans to cultivate and modify the surface of the ground in order to meet their needs (Carvalho, 2006). Land use changes are the result of ever-increasing human development and activities (Idrus, Sian & Hadi, 2004). According to Asnawi & Choy (2016), factors such as the various government policies aimed at national development, the economic development in the industrial sector and the development of infrastructure as well as built-up areas in town centres have caused the urbanization process to spread to the rural areas and to indirectly affect the pattern of land use changes in those areas. Rural settlement centres are the areas that frequently undergo the urbanization process. This is because these settlement centres are hubs for the economic, social, services and community activities of the locals. The availability of infrastructure facilities along the main routes connecting the urban to the rural areas has attracted housing, industrial, institutional, commercial and other activities to the rural areas to achieve a balanced economic growth and to provide opportunities for employment (Antrop, 2004).
The existence of educational and training institutions has also given rise to the urbanization process as it has spurred rural development (Noor & Choy, 2018). Educational and training institutions can produce skilled youths for the development of the rural areas while providing employment opportunities to rural residents. This increase in employment opportunities will reduce the rate of rural migration to the cities. The population growth has also resulted in an increase in the demand for the conversion of agricultural land in the rural areas to built-up areas to accommodate the needs of the population. The urbanization process has had a huge impact on land use changes, especially the conversion of agricultural land for other land use activities such as housing, commerce, industries, transportation and so on to meet the growing needs of the people (Salleh, Badarulzaman, & Salleh, 2013). Land for tourism and recreation activities has also increased in the rural areas, especially in those areas with natural attractions. Tourism activities have been much more productive than agricultural activities in view of the assistance provided by the government in terms of infrastructure development to increase the income of the rural population. Indirectly, the rapid economic development in the rural areas has reduced the amount of land available for agriculture and forests due to the pressures of development, while having a negative impact on the quality of the natural environment that may give rise to the risk of natural disasters (Samat,Eltayeb, Hasni & Radad, 2010; Hussain & Ismail, 2016).
have a negative impact on environmentally-sensitive areas. The urbanization process can indirectly aid rural development in terms of the provision of good infrastructure facilities, the existence of institutions and the establishment of functional small towns that can increase employment opportunities and so on provided the urbanization process is well-controlled so that future generations will be able to enjoy a comfortable life (Samion et al., 2014).
STUDY AREA
The area that was selected for the study is the town of Kuala Nerang, which is located in the district of Padang Terap, Kedah, Malaysia (Figure 1). According to the Draft of the Kedah State Structure Plan 2035 (PLANMalaysia, 2017), this town is categorised as the administrative centre for the Padang Terap district, while under the Kedah State Structure Plan 2020 (PLANMalaysia, 2011), this town is a major settlement centre. The upgraded status of Kuala Nerang from a major settlement centre to a district administrative centre can potentially impact land use changes around the town. Kuala Nerang town is located in Mukim Belimbing Kanan, which covers the West Padang Terap Planning Block area.
The administrative boundary for Kuala Nerang, as determined by the Kedah Land Administrative Boundary’s Code and Name (JTSM, 2011), covers an area of 2,146.41 acres. The town has two sections, namely, Section 1 and Section 2. Kuala Nerang is connected via the K11 State Route from Pokok Sena to the Durian Burung and to the border of Thailand. The main policies and strategies for the Padang Terap district in the Padang Terap District Local Plan 2020 (PLANMalaysia, 2018) are concentrated between Kuala Nerang and Durian Burung, characterised by the linear development corridor. This corridor is linked by major roads and is supported by the major settlement centres surrounding it, which have become the nodes to that linear development. Kuala Nerang is an existing node that has been identified as one of the major contributors to the services, commercial and administrative sectors of the Padang Terap district.
METHODOLOGY
The aim of this study is to identify the land use changes that occurred in Kuala Nerang town from 2001 to 2011 and from 2011 to 2018, from which the speed of urban expansion and direction of development in the town could be determined. The secondary data for this study came from written sources such as the Draft of the Kedah State Structure Plan 2035, the Kedah State Structure Plan 2020, the Padang Terap District Local Plan 2020 and other reports related to this study.
The analysis of land use changes involved the data on land use for the years 2001, 2011 and 2018. The data on land use for 2001 was obtained in digital format (GIS format) from the Northern Zone Project Office, PLANMalaysia (Federal Department of Town and Country Planning), in Alor Setar, Kedah, while the data on land use for 2011 was obtained through the georeferencing method by using satellite images and ArcGIS (10.4) software. The data on land use for 2018 was obtained through the gathering of information in the field. The land use changes were analysed using GIS software (ArcGIS 10.4) by the overlapping method. From the results of the analysis of land use changes, the direction of development could be determined with the support of the secondary data.
To examine the speed of urban expansion in Kuala Nerang, a fishnet of the study area was generated using ArcGIS software. This fishnet produced grid cells measuring 100m x 100m as a unit of space. The rate is calculated using formula by (Hu, Du, & Guo, 2007), as given below.
X i, t+n = {(B i, t+n – B i,t) / Ti x 100}
where,
X i, t+n = the annual expansion intensity index of spatial unit i,
B i, t+n = urban area in the spatial unit i at time t + n,
Table 1 Annual expansion intensity index and its grade
Value Grade
X i, t+n > 1.92 High-speed expansion
1.05 > X i, t+n > 1.92 Fast-speed expansion
0.59 > X i, t+n > 1.05 Medium-speed expansion
1.05 > X i, t+n > 0.28 Slow-speed expansion Source: (Hu, Du, & Guo, 2007)
DATA ANALYSIS AND FINDINGS
This section discusses the data analysis and the findings on the pattern of land use changes, and the speed of urban expansion and direction of development in Kuala Nerang town for the period 2001 to 2018.
Pattern of Land Use Changes in Kuala Nerang
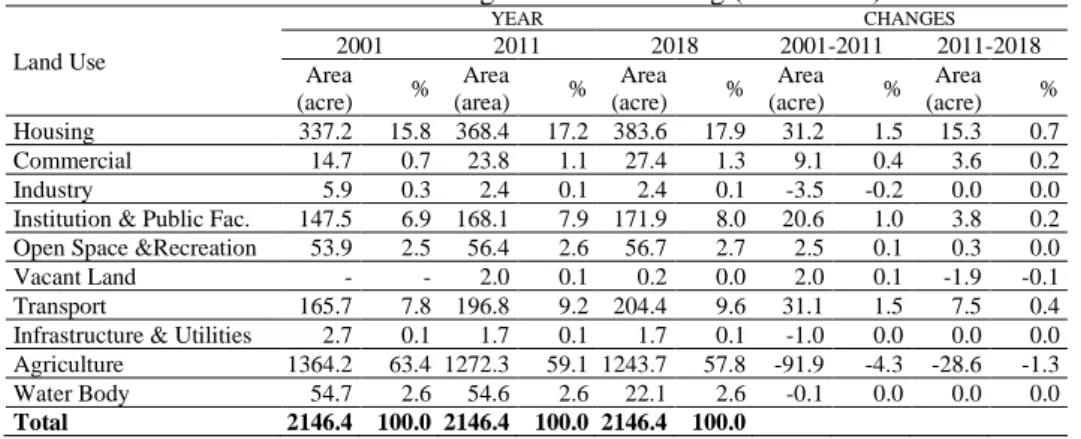
As shown in Table 2, a total of 1,364.17 acres (63.42%) of the land was used for agriculture in 2001, followed by 337.18 acres (15.77%) for housing and 165.71 acres (7.75%) for transportation. However, there was a drop in the total land use from 2001 to 2011, particularly for agriculture, which was reduced by as much as 91.87 acres (4.3%), while the use of land for infrastructure and utilities was reduced by 1.01 acres (0.04%) and for water bodies by 0.10 acre (0.01%). This decline was due to the conversion of land to meet the demand for other land uses such as for transportation, housing, institutions and social amenities, commerce as well as for open spaces and recreation. This can be explained by the development of new housing estates from Kuala Nerang to Pokok Sena and also the upgrading of the K11 State Road. In addition, there has also been the development of educational and government institutions such as the Padang Terap Community College, the Padang Terap District Office, and the Padang Terap Lower Syariah Court. Most of these have been developed on agricultural land. Meanwhile, the use of land for industrial activities has shown a decline due to the conversion of such land for transportation purposes. Vacant land began to be classified as a land use category PLANMalaysia in 2008.
Table 2 Land Use Changes in Kuala Nerang (2001-2018)
Land Use
YEAR CHANGES
2001 2011 2018 2001-2011 2011-2018 Area
(acre) % Area (area) %
Area (acre) %
Area (acre) %
Area (acre) % Housing 337.2 15.8 368.4 17.2 383.6 17.9 31.2 1.5 15.3 0.7 Commercial 14.7 0.7 23.8 1.1 27.4 1.3 9.1 0.4 3.6 0.2 Industry 5.9 0.3 2.4 0.1 2.4 0.1 -3.5 -0.2 0.0 0.0 Institution & Public Fac. 147.5 6.9 168.1 7.9 171.9 8.0 20.6 1.0 3.8 0.2 Open Space &Recreation 53.9 2.5 56.4 2.6 56.7 2.7 2.5 0.1 0.3 0.0 Vacant Land - - 2.0 0.1 0.2 0.0 2.0 0.1 -1.9 -0.1 Transport 165.7 7.8 196.8 9.2 204.4 9.6 31.1 1.5 7.5 0.4 Infrastructure & Utilities 2.7 0.1 1.7 0.1 1.7 0.1 -1.0 0.0 0.0 0.0 Agriculture 1364.2 63.4 1272.3 59.1 1243.7 57.8 -91.9 -4.3 -28.6 -1.3 Water Body 54.7 2.6 54.6 2.6 22.1 2.6 -0.1 0.0 0.0 0.0
Total 2146.4 100.0 2146.4 100.0 2146.4 100.0
Based on the analysis of land use changes from 2001 to 2011, it was found that the use of land for agriculture experienced a severe decline of as much as 91.87 acres. The built-up areas benefitted from this decline in agricultural land. The three types of land use that saw the largest increase were housing, which increased by 31.18 acres (1.46%), transportation by 31.13 acres (1.46%), and institutions and social amenities by 20.61 acres (0.96%). A similar trend was detected for land use changes between 2011 and 2018, where the use of land for agriculture dropped by as much as 28.59 acres. Three types of land use that showed the biggest increase were housing, by as much as 15.27 acres (0.71%), transportation, by 7.54 acres (0.35%), and institutions and social amenities by 3.76 acres (0.18%). These land use changes are shown in Figure 2.
Figure 2 Land Use Changes in Kuala Nerang 2001, 2011 and 2018
Table 3 Matrix of Land Use Changes in Kuala Nerang (2001-2011)
Landuse 2011 (acre)
House Comm Ind. Inst. Open space
Vac. land
Trans-port Infra Agri Water
body Total
LA
N
D
U
S
E
2
0
0
1
(
ac
re
)
House 323.6 0.7 0.1 2.0 10.9 337.2
Comm 0.1 14.3 0.1 0.1 14.7
Ind. 2.4 3.5 5.9
Inst. 0.4 147.1 147.5
Open space 2.1 3.6 48.1 0.2 53.9
Vac. land
Transport 0.4 0.4 164.9 165.7
Infra 0.8 0.5 1.4 2.7
Agri 44.6 5.9 16.6 7.5 1.9 26.0 0.3 1261.4 1364.2
Water 0.1 54.6 54.7
This clearly showed that non-built-up areas such as agricultural land and forests are often the main targets for development activities in rural areas. Their low market prices and physical features that are easy to develop encourage the growth of built-up areas such as for housing, commerce, institutions and social amenities, transportation and so on. According to Salleh, Badarulzaman, & Salleh (2013), such land use changes are one of the effects of the on-going urbanization process.
SPEED OF URBAN EXPANSION IN KUALA NERANG
The speed is determined through the annual expansion intensity index produced through an analysis of land use changes over a certain period of time. For Kuala Nerang, the analysis of land use changes revealed that there was an increase of 35 acres in the built-up area from 2001 to 2011, and it continued to increase by as much as 12.21 acres between 2011 and 2018. This change involved a reduction in agricultural land from 1,364.17 acres to 1,272.30 acres for the period 2001 to 2011, and this continued to decrease to 1,243.71 acres between 2011 and 2018.
Figure 3 Speed of Urban Expansion in Kuala Nerang
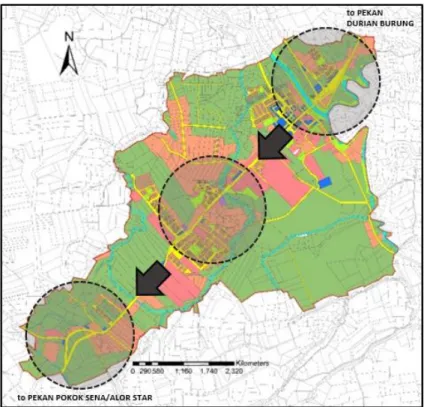
Direction of Development in Kuala Nerang
Figure 4 Direction of Development in Kuala Nerang
CONCLUSION
of better transportation and infrastructure facilities in this section. The land use changes in this town can generally be said to be slow even though it is a district administrative centre. The eastern part of this state is not receiving much attention from investors and has less tourism activities because of poor accessibility and lack of viability. It is hoped that the proposed high-impact projects in the Padang Terap District such as the Kedah Rubber City and the proposed new highways, namely, the Central Spine Highway and the Trans Eastern Kedah Interland Highway (TEKIH) will further boost the economy and improve accessibility to these rural areas in the future.
REFERENCES
Antrop, M. (2004). Landscape change and the urbanisation process in Europe. Landscape and Urban Planning, 67, 9-26
Asnawi, N. H., & Choy, L. K. (2016). Analisis Perubahan Gunatanah dan Litupan Bumi di Gombak, Selangor Menggunakan Data Penderiaan Jauh. Sains Malaysiana,
45(12),1869-1877.
Carvalho, F. (2006). Agriculture, Pesticides, Food Security and Food Safety.
Environmental Science and Policy, 9, 685-692.
Embong, Abdul Rahman (2011). Pembandaran dan Kehidupan Bandar di Semenanjung Malaysia. Akademika, 81(2), 23-39.
Hu, Z.-l., Du, P.-j., & Guo, D.-z. (2007). Analysis of Urban Expansion and Driving Forces in Xuzhou City Based on Remote Sensing. Journal of China University of Mining and Technology, 17(2), 267-271.
Hussain, T. P., & Ismail, H. (2016). Perubahan gunatanah dan kejadian banjir di Lembangan Saliran Kelantan. GEOGRAFIA OnlineTM Malaysian Journal of Society and Space, 12(1), 118 – 128.
Idrus, S., Sian, L. C., & Hadi, A. S. (2004). Kemudahterancaman (Vulnerability) Penduduk Terhadap Perubahan Guna Tanah di Selangor. Malaysian Journal of Environmental Management, 5,79 – 98
Department of Statistics Malaysia, (2010). Banci Penduduk dan Perumahan Malaysia. JTSM, Jawatankuasa Teknikal Standard MyGDI, (2011). Kod dan Nama Sempadan
Pentadbiran Tanah Kedah. Pusat Infrastruktur Data Geospatial Negara (MaCGDI).
Johnson, J. H. (1974). Suburban growth : A Geographical Processes at the Edge of the Western City. London: John Wiley and Sons.
Ngah, Ibrahim (2009). Malaysia’s Economy, Past, Present & Future, Ch. 2, ed. Ishak Yussof, Kuala Lumpur: Malaysian Strategic Research Centre. Ngah, Ibrahim (2012). Rural Transformations Development: a Review on
Malaysia's Transformation Program. International Conference on Social Sciences & Humanities UKM 2012 (ICOSH-UKM 2012) 12-13 December 2012.
PLANMalaysia, (Northern Zone Project Office, Federal Department of Town and Country Planning), (2011). Rancangan Struktur Negeri Kedah 2020.
PLANMalaysia, (Federal Department of Town and Country Planning), (2016). Dasar Perbandaran Negara Kedua, Semenanjung Malaysia & Wilayah Persekutuan Labuan.
PLANMalaysia (Department of Town and Country Planning Kedah) (2017). Draf Rancangan Struktur Negeri Kedah 2035.
PLANMalaysia (Department of Town and Country Planning Kedah) (2017).
Ringkasan Laporan Pemeriksaan Eksekutif Rancangan Struktur Negeri Kedah 2035
PLANMalaysia (Department of Town and Country Planning Kedah) (2018). Rancangan Tempatan Daerah Padang Terap 2020. Majlis Daerah Padang Terap.
Rostam, K. (2001). Dasar dan Strategi Petempatan dalam Pembangunan Negara. Bangi: Penerbit UKM.
Salleh, M., Badarulzaman, N., & Salleh, A. G. (2013). Pembandaran dan Tren Perubahan Gunatanah Di Luar Bandar: Kajian Kes Parit Raja, Batu Pahat, Johor. Prosiding Seminar Serantau Ke-2 Pengurusan Persekitaran Di Alam Melayu.
Samat, N., Eltayeb, Y. A., Hasni, R., & Radad, S. (2010). Evaluating Land Use Land Cover Changes in Seberang Perai, Malaysia between 1990 and 2007. The 4th International Conference on Built Environment in Developing Countries, 2-3 Dec 2010 :Penang ,Malaysia.
Samat, N., Ghazali, S., Hasni, R., Hadary, Y. A., & Hassan, F. (2012). Tekanan Pembangunan di Seberang Perai Tengah , Pulau Pinang : Satu Analisis Terhadap Peluang dan Cabaran Kepada Masyarakat Tempatan. Jurnal Perspektif, 4(2), 67-84.