Hungarian Association of Agricultural Informatics
European Federation for Information Technology in Agriculture, Food and the Environment
Journal of Agricultural Informatics. 2015 Vol. 6, No. 4 journal.magisz.org
A Web application to estimate the climate change effects on agriculture in
Thailand
Kei Tanaka1, Takuji Kiura2
I N F O Received Accepted Available on-line Responsible Editor:
Keywords:
Climate change, crop yield prediction, DSSAT, Thailand, multithreading, StAX
A B S T R A C T
A Web application was developed to estimate the effects of climate change on agriculture. We chose the northeast and north of Thailand as the target areas of this application, although most countries in the Asian monsoon region are agricultural areas. Northeastern Thailand is a rainfed farming area where rice and drought-tolerant crops are cultivated. Northern Thailand is a mountainous area where several types of vegetables are cultivated. The application identifies and recommends crops that can be grown based on the simulation results of a crop model DSSAT. The DSSAT was executed 365 times; the start date was moved forward one day each time. The effects of climate change were estimated by inputting meteorological data that reflects the influence of climate change. The most favorable start date and the yield are summarized and displayed as output. Application of this system to grid meteorological data required the shortening of execution time and handling a huge volume of data. These problems were solved using multithreading, StAX and Hadoop. The Web application with witch output data were presented was designed based on the assumption that it would be used by a farmer in the field with a 7-inch tablet.
1. Introduction
The effects of climate change (on air temperature, precipitation, and the length and timing of the rainy season) can greatly affect agriculture. Most countries in the Asian monsoon region are agricultural areas, and the impact of climate change on this region is very significant. Rainfed areas in particular are very vulnerable to extreme weather events, such as floods and droughts. On the other hand, in mountainous areas, it is expected that air temperature changes will be amplified. Moreover, a change in the onset and period of the rainy season will have serious effects on yields and farming plan.
1.1. GRENE-ei CAAM Project
A Japanese research project, “Climatic changes and the evaluation of their effects on agriculture in the Asian monsoon region” (CAAM 2012) under the “Green network of excellence — environmental information” (GRENE-ei 2011) program of Japan’s Ministry of Education, Culture, Sports, Science and Technology (MEXT) was started in 2011 and will be conducted until 2015. The dual purposes of this project are to improve the reliability of climate prediction (CCR: climate change research) and to develop the information platform needed to design agricultural strategies for adaptating to and mitigating against the predicted climatic changes in the Asia monsoon region (AER: agricultural effect research).
Our purpose for this project is to develop an “evaluation system for major crops in the Asian monsoon region affected by climate changes” that can simulate the growth of major crops in this region. In our research seeking to elucidate the effects of climatic change on agriculture, we chose an area spanning from the northeast to the north of Thailand as our research target area. Northeastern Thailand is a rainfed farming area. The difference in precipitation between this area’s rainy season and
1 Kei Tanaka
Department of Agricultural Informatics, NARO, Agricultural Research Center [email protected]
2 Takuji Kiura
dry season is quite pronounced. Rice is cultivated during the rainy season, and drought-tolerant crops such as sugarcane and cassava are cultivated during the dry season. Northern Thailand is a mountainous area. Its cooler temperatures allow the cultivation of several types of vegetables that cannot be grown in the plains areas.
2. Crop Yield Prediction System
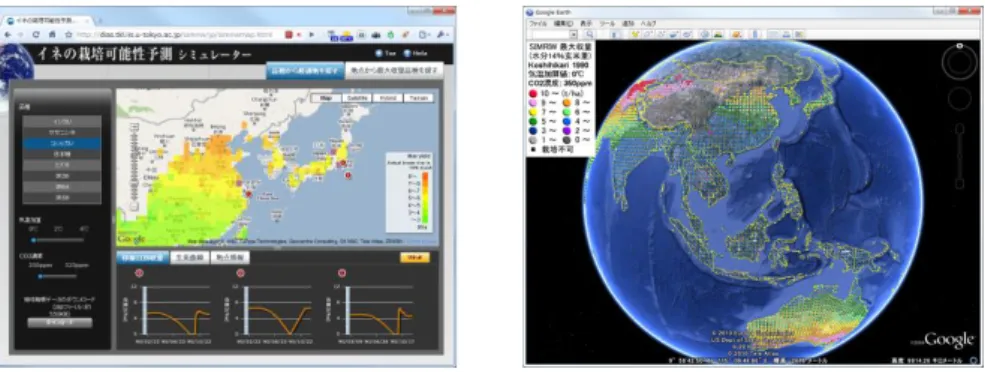
We developed the “Simulator for the cultivation possibility of rice” for Data Integration and Analysis System (DIAS) project (Tanaka et al. 2011; DIAS 2010) (Figure 1). This system executes the rice model SIMRIW (Horie et al. 1995a, 1995b) for a one-degree grid of worldwide data (only for land, about 15,000 points) and shows the cultivation possibility of each variety of rice as predicted yield. Because SIMRIW is a simple rice growth model that can simulate only potential growth, and the grid interval is 100km, it seemed that it is difficult to supply this system to practical use. However, it clarified the problem, such as a large-scale grid execution and a huge number of file treatment that had to be solved when a similar system would be constructed.
Figure 1. Simulator for the Cultivation Possibility of Rice
We developed the “Prediction system to optimize double cropping of rice and cassava” as a concrete application for the GRENE-ei project. We created this system to identify and recommend crops that can be grown during a dry season, and to simulate the effects of climate change in Thailand’s farming areas by inputting meteorological data that reflect the influence of climate change.
The structure of the new crop yield prediction system is shown in Figure 2. There are main three components of the system: (1) A meteorological data acquisition function and a weather data generator that reflects the effects of climate change; (2) crop models and a crop model execution engine that executes them; (3) save, display, and comparison functions for the resulting data.
Figure 2. Structure of the Crop Yield Prediction System
Result Data Crop Model
Execution Engine
Crop Models • DSSAT • ORYZA • SIMRIW
Forecast Meteorological Data under Climate Change
Meteorological Data
MetBroker
Agro-Climate Database • observed data • predicted data • statistical data • downscaled data
• air temperature • solar radiation • precipitation
• crop yield • growth period with
effects of climate change
Data Viewer Application Field Data
comparison validation
Adaptation and Mitigation Strategies
Crops • rice • cassava • vegetables ••••
2.1. Meteorological Data
MetBroker (Laurenson et al. 2002 (Figure 3) is used to acquire meteorological data from meteorological databases. MetBroker is mediation software that enables data to be acquired from meteorological databases throughout the world (about 20 databases, 100,000 stations at present) without the need for a complex database access program. The Automated Meteorological Data Acquisition System (AMeDAS, for Japan) and National Oceanic and Atmospheric Administration/World Meteorological Organization (NOAA/WMO, for the rest of the world) can be used as the main meteorological databases. Though solar radiation data are indispensable for predicting crop yields, most databases do not provide them. The Global Dataset of the DR and TR (GD-DRandTR) database was successfully treated with MetBroker to simulate areas all over the world, and it was then possible to acquire air temperature, precipitation, and solar radiation data in a one-degree grid (only for land). Moreover, a sunshine hours - solar radiation conversion model (Masaki et al. 2009) is provided as another solution.
Figure 3. MetBroker
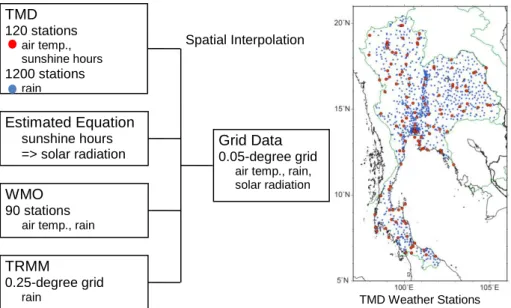
To perform an accurate simulation, the solar radiation, air temperature, and precipitation data from a 0.05-degree grid were prepared by the National Institute for Agro-Environmental Sciences (NIAES). These data were generated by the NIAES from actual data observed by the Meteorological Department of Thailand (TMD), the WMO, and the Tropical Rainfall Measuring Mission (TRMM) using a spatial interpolation method as shown in Figure 4.
Figure 4. Generation procedure of grid meteorological data for Thailand DSSAT
ORYZA
SIMRIW
Meteorological data mediation software
• • •
Application Layer Mediation Layer
• •
Database Layer MetBroker
Meta Data
Agro-Climate DB
Data from Field
GD-DR &TR
TMD
120 stations
air temp., sunshine hours
1200 stations
rain
Estimated Equation
sunshine hours => solar radiation
WMO
90 stations
air temp., rain
TRMM
0.25-degree grid
rain
Grid Data
0.05-degree grid
air temp., rain, solar radiation
Spatial Interpolation
The meteorological data network might not be maintained because the research target area areas that we chose were mostly in developing countries. Therefore, we provided the data generation function as a Web service. The weather generator can create a series of meteorological data sets that have statistical difference and correspondence between real and generation data to be used by a crop growth model. The service uses Cligen (Nicks et al. 1995) as a meteorological data generator, but can also handle other generators. The data format of the service is XML (for the application) and JSON (for the Web browser).
In addition, the forecast meteorological data generated by Tokyo Metropolitan University (TMU) using the climatic model are used to predict the yield while taking into consideration the influence of climatic change.
2.2. Crop Model
The prediction system employs software known as the Decision Support System for Agrotechnology Transfer (DSSAT; Jones et al. 1998, 2003) to simulate the growth of crops for the following reasons: (1) the Crop Environment Resource Synthesis (CERES; Ritchie et al. 1998) included in DSSAT is often used for simulations of the effects of climate change on crop production (White et al. 2011); (2) in our survey of major crop models in Thailand, DSSAT had been applied to several crops because of the enhancement of education to use DSSAT and the maintenance of crops and soil databases; (3) DSSAT has program modules such as rice (Singh et al. 1993), cassava (Matthews et al. 1994) and vegetables, which are crops we are interested in simulating.
The DSSAT simulates phenology and growth processes, including the nitrogen requirements, soil, climate, and management conditions for a specific environment. Therefore, new parameter files customized for a local area, such as species (SPE), cultivar (CUL), ecotype (ECO), and experiment (X), are required when the software is applied to a new area. Whether the crop model can be applied to the user’s location depends on the existence of specific parameters. However, most crop models provide only cultivar parameters and experimental data on study locations. Parameters for several of the rice cultivars grown in Thailand are provided in DSSAT because rice is an important crop all over the world. Parameters for the cassava cultivars grown in Thailand have been provided in research theses (Matthews and Hunt 1994; Sarawat et al. 2000; Kaweewong et al. 2013) because cassava is a major crop in Thailand. As we do not currently have parameters for vegetables, the default configuration (i.e., cultivar, dates and amounts of fertilizer and irrigation, and soil type) was used to execute the simulation, because local cultivating data were not available.
In the case of the simulator for a single crop of rice (Figure 1), the criterion for suitable variety was simply enough only by yield of crop. In the case of the simulator for the double-cropping of rice and cassava, it is necessary to consider the restrictions on the planting period and natural conditions in addition to crop yield as criteria. The evaluation equation needed to optimize double-cropping was determined based on the following conditions to maximize income under the cropping calendar.
The harvest day for rice occurs before the end of November, because cassava should be planted in December.
A higher rice grain yield is better.
The harvest day of cassava is between May and July.
A higher cassava yield is better.
Figure 5. Cropping Calendar in Northeastern Thailand
Jan 1 Feb Mar Apr May Jun Jul Aug Sep Oct Nov Dec Rainy Season
Rice Cassava Cassava 6 months
Suitable cultivation period of cassava is over six months
(starch content will be increased)
2.3. Server-side Application
Crop models are executed in a server PC by the crop model execution engine (center of Figure 2). The engine is a backbone function for executing a crop model repeatedly with conditions represented by numerical expressions. The engine can execute various crop models using the Java Agricultural Model Framework (JAMF; Tanaka 2006, 2013). A crop model developed using the Application Program Interface (API) of the JAMF can be treated as an exchangeable program part.
The prediction system executes a crop model 365 times; the start date is moved forward one day each time to identify the best start date (Figure 6). The most favorable start date and the yield are summarized and output as XML format files. When double-cropping is simulated, the judgment condition is applied to the results for two kinds of crops.
Figure 6. Execution Method of Crop Yield Prediction
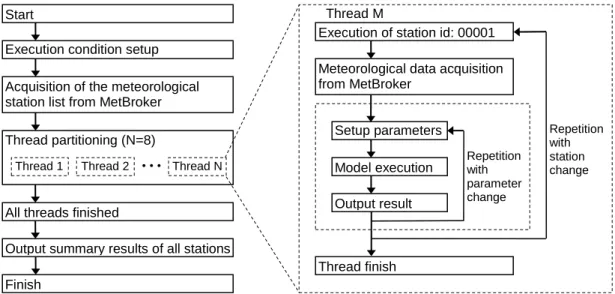
When the number of executions of a crop model was markedly increased by applying grid data to the prediction system, it was necessary to solve three problems. First, it was necessary to shorten the execution time. The time required for one execution is on the order of milliseconds, the time for one-year’s-worth of executions is on the order of tens of seconds, and the time for tens of thousands of grid executions is on the order of days. However, multithreading (Figure 7), as a technology to execute a process of a flow of two or more processing concurrently to improve an entire processing speed, can shorten the execution time, because the processing for each grid point is independent. The execution time for 12,000 points and 4.3 million executions decreased from 4 days to 1 day when the execution of the crop model was divided into eight threads with a Core i7-860 PC (hyper-threaded quad-core processor).
Figure 7. Flow of Multithreading to Execute a Crop Model Execution condition setup
Acquisition of the meteorological station list from MetBroker
Thread partitioning (N=8)
Thread 1 Thread 2 Thread N
All threads finished
Output summary results of all stations
Finish
Execution of station id: 00001
Meteorological data acquisition from MetBroker
Setup parameters
Model execution
Output result
Repetition with parameter change
Repetition with station change
Thread finish Thread M Start
• • •
setup crop, cultivar, area, year for ( grid points ) {
transform met. data into DSSAT format
for ( planting date = from Jan.1 to Dec.31 ) { modify experiment data
execute CSM45.exe
save result values ( yield, growth period ) }
}
The second problem is how to handle the huge volume of data. The volume of the resulting data increases in proportion to the number of data points. Therefore, the OutOfMemoryError occurs frequently because the large XML data output by the Document Object Model (DOM) consumes a lot of memory. This problem was solved by adopting Streaming API for XML (StAX; Harold 2003), which outputs data as a sequential stream and consumes less memory than DOM.
The third problem is the handling of a huge number of small files. If 10 or more result files that were output at each execution were archived, the number of files becomes huge in proportion to the number of executions. There is no difficulty in displaying the result data because a summary of the results was generated. The problem was revealed at backup. We dealt with this problem by introducing the Hadoop file system.
2.4. Result Data Format
DSSAT outputs several types of result data files at each execution. The PlantGro.OUT file stores a summary of the results. The execution condition, the data name of the row, and the daily values of the data are sequentially output in a constant length data format in the file. Because the crop yield is recorded in the last line of a file, the prediction system collects the last lines of the 365 PlantGro.OUT files and outputs them as a growth.dat file. To facilitate the handling of data, the system converts growth.dat into the growth.xml file in the XML format, including meteorological data used during the execution. The XML format data are suitable for handling by a Web application, and can be easily converted into a KML format file to display the data on a map. After execution at all of the points is completed, a file storing the maximum yield of various points is output.
2.5. Web Application
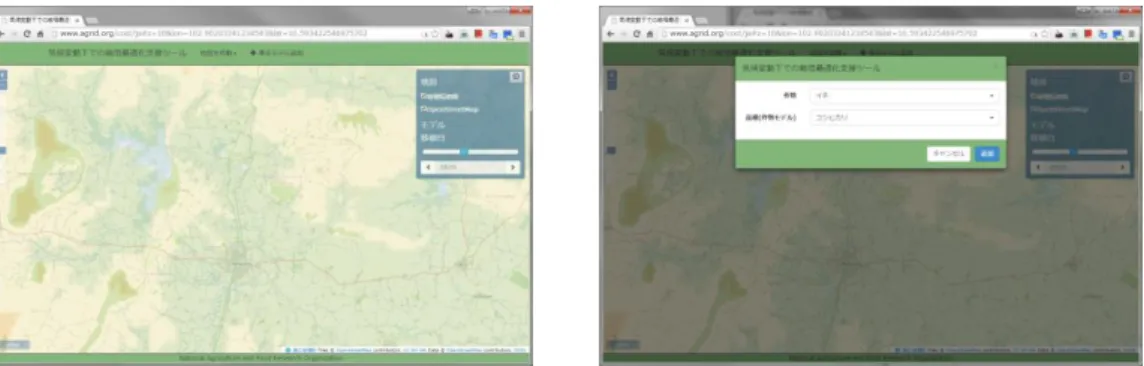
A Web application to estimate the effect of climate change on agriculture was developed by combining the crop model system, meteorological data that reflect the influence of climate change, and a Web user interface to display the resulting data as layers on a map. This application was designed based on the assumption that it would be used by a farmer with a 7-inch tablet (Figure 8).
In the Web application, a user obtains an output by operating the GUI interface of the screen. This method is suitable when a person uses an application. These Web applications also provide Web API interfaces that make it possible for the result data to be used by other applications. They can output data of several types—including XML, KML, JSON, CSV, Excel book, and HTML table.
Figure 8. Web Application to Display Results
3. Results
data observed by TMD, WMO and TRMM by NIAES. There are 12,000 points, and the period of the data is 30 years, from 1977 to 2006. NIAES will expand the area for which high resolution meteorological data are provided and expand the period of data from 2007 to the present. Also, TMU will generate forecast data take into account the influence of climatic change.
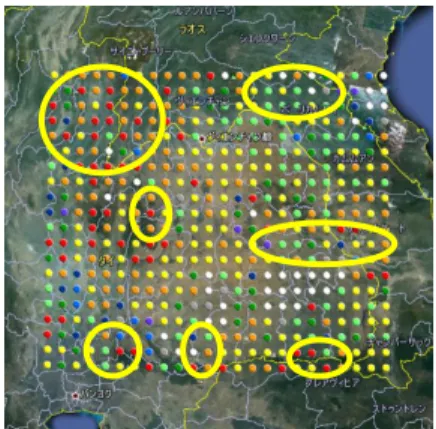
Figure 10 shows the simulation results in a 0.25-degree grid. The relative yields of rice and cassava are shown on the map by color for the case in which rice is transplanted on August 1 and its maximum cultivation period is 4 months, and cassava is planted on December 1 and its harvest date is July 15. In the regions enclosed within the yellow lines, the yields of rice and cassava are greater than in other regions. Because this result is only a simulation created using the crop models with default parameters, it is necessary to verify the result in comparison with actual cultivation data. We plan to try collecting parameters of DSSAT and cultivation data for the application area.
The developed Web application provides detailed prediction of climate change effects on crop timing and yields for the design of the respective agricultural adaptation and mitigation strategies. This can be useful for engineers and administrative officers in each country which will develop the necessary information infrastructure.
Acknowledgement
This study was financially supported by the Japanese research project “Climatic changes and evaluation of their effects on agriculture in Asian monsoon region (CAAM)” under the “Green Network of Excellence (GRENE)” program of the Ministry of Education, Culture, Sports, Science and Technology (MEXT) of Japan.
References
CAAM 2012, GRENE-ei CAAM. Available from: <http://grene.agrid.org/> [10 May 2015] DIAS 2010, Simulator for cultivation possibility of rice. Available from: <http://dias.tkl.iis.u-tokyo.ac.jp/simriw/> [20 April 2014]
GRENE-ei 2011, Green Network of Excellence — environmental information. Available from: <http://grene.jp/english/> [10 May 2015]
Harold, ER 2003, An Introduction to StAX. Available from: < http://www.xml.com/pub/a/2003/09/17/stax.html> [10 May 2015]
Horie, T, Nakagawa, H, Centeno, HGS, and Kropff, MJ 1995a, The rice crop simulation model SIMRIW and its testing. in Modeling the impact of climate change on rice production in Asia, eds RB Matthews, MJ Kropff, D Bachelet, and HH van Laar, CAB International. Wallingford, pp.51-66.
F
Figure 9. Comparison of Numbers of Meteorological Grid Data Points.
Left: 1-Degree Grid Right: 0.05-Degree Grid
Figure 10. Results of the Prediction System for Double Cropping Optimization
Horie, T, Inoue, N, Ohnishi, M, Nakagawa, H, and Matsui, T 1995b, Development of dynamic model for predicting growth and yield of rice. Report of grants-in-aid for scientific research, Research project number:03404007.
Jones, JW, Tsuji, GY, Hoogenboom, G, Hunt, LA, Thornton, PK, Wilkens, PW, Imamura, DT, Bowen, WT, and Singh, U 1998, Decision support system for agrotechnology transfer: DSSAT v3. in Understanding Options for Agricultural Production, eds GY Tsuji, G Hoogenboom, and PK Thornton, Kluwer Academic Publishers. Dordrecht, pp. 129-156. ISBN0-7923-4833-8.
Jones JW, Hoogenboom G, Porter CH, Boote KJ, Batchelor WD, Hunt LA, Wilkens PW, Singh U, Gijsman AJ, and Ritchie JT 2003, The DSSAT cropping system model. European Journal of Agronomy, vol. 18, no. 3-4, pp. 235-265. doi: 10.1016/S1161-0301(02)00107-7.
Kaweewong, J, Tawornpruek, S, Yampracha, S, Yost, R, Kongton, S, and Kongkeaw, T 2013, Cassava Nitrogen Requirements in Thailand and Crop Simulation Model Predictions. Soil Science, vol. 178, no. 5, pp. 248-255. doi: 10.1097/SS.0b013e31829a283f
Laurenson, MR, Otsuka, A, and Ninomiya, S 2002, Developing Agricultural Models Using MetBroker Mediation Software. Journal of Agricultural Meteorology, vol. 58, no. 1, pp. 1-9. doi: 10.2480/agrmet.58.1 Masaki, Y, Kuwagata, T, and Ishigooka, Y 2009, Precise estimation of hourly global solar radiation for micrometeorological analysis by using data classification and hourly sunshine. Theoretical and Applied Climatology, vol. 100, no. 3-4, pp. 283-297. doi: 10.1007/s00704-009-0191-0.
Matthews, RB and Hunt, LA 1994, GUMCAS: a model describing the growth of cassava (Manihot esculenta L. Crantz). Field Crops Research, vol. 36, no. 1, pp. 69-84. doi:10.1016/0378-4290(94)90054-X
Nicks, AD, Lane, LJ, and Gander, GA 1995, Chapter 2. Weather generator. in USDA-Water Erosion Prediction Project: Hillslope Profile and Watershed Model Documentation. NSERL Report No. 10, eds DC Flanagan, and MA Nearing. West Lafayette, IN.: USDA-ARS National Soil Erosion Research Laboratory.
Sarawat, V, Ratanasriwong, S, Puangprakon, K, and Jintrawet, A 2000, The development of a Cassava Growth Model in Thailand. Proceedings of Cassava’s potential in Asia in the 21st century, pp. 447-455.
Ritchie, JT, Singh, U, Godwin, DC, and Bowen, WT 1998, Cereal growth, development and yield. in
Understanding Options for Agricultural Production, eds GY Tsuji, G Hoogenboom, and PK Thornton, Kluwer Academic Publishers. Dordrecht, pp. 79-98. ISBN0-7923-4833-8.
Singh, U, Ritchie, JT, and Godwin, DC 1993, A User’s Guide to CERES Rice - V2.10, International Fertilizer Development Center; Muscle Shoals, AL.
Tanaka, K 2006, A Java Framework for Developing a Plant Growth and Disease Prediction Model, Agricultural Information Research vol. 15, no. 2, pp.183-194. doi: 10.3173/air.15.183.
Tanaka, K, Kiura, T, Sugimura, M, Ninomiya, S, and Mizoguchi, M 2011, Tool for Predicting the Possibility of Rice Cultivation using SIMRIW, Agricultural Information Research vol. 20, no. 1, pp.1-12.
doi: 10.3173/air.20.1.
Tanaka, K 2013, A Study on a Framework for Distributed Cooperative System in an Agricultural Simulation Model. Bulletin of NARO Agricultural Research Center vol. 20, pp. 1-115. ISSN1881-6738.