EVALUATING JOURNEY-TO-WORK TRANSIT ACCESSIBILITY IN TYSONS CORNER, VA
by
ANN BRACKEN MCGRANE
A Masters Project submitted to the faculty of the University of North Carolina at Chapel Hill
in partial fulfillment of the requirements for the degree of Master of City and Regional Planning
in the Department of City and Regional Planning
Chapel Hill
2014
Approved by:
1
CONTENTS
List of Maps ... 2
List of Tables ... 2
Abstract ... 3
Introduction ... 4
Literature Review... 5
General Measures of Accessibility ... 5
Measures of Transit Accessibility ... 6
Employment Accessibility ... 7
Study Area ... 8
Data ... 9
Methodology ... 10
Journey-To-Work ... 10
Existing Conditions ... 11
Future Conditions... 15
Results ... 15
Journey-To-Work ... 15
Existing Conditions ... 16
Future Conditions... 23
Discussion ... 27
Limitations ... 28
Conclusion ... 29
2
LIST OF MAPS
Map 1 - Study Area: Tysons Corner, VA ………... 8
Map 2 - Area Within One, Two, and Three Miles of a Future Silver Line Station
………... 11
Map 3 - Initial Transit and Walking Service Areas ………... 13
Map 4 - Current 30-Minute Transit and Walking Service Area from Tysons Corner at 5 PM
………... 18
Map 5 - Current 45-Minute Transit and Walking Service Area from Tysons Corner at 5 PM
………... 19
Map 6 - Current 60-Minute Transit and Walking Service Area from Tysons Corner at 5 PM
………... 20
Map 7 - Current 75-Minute Transit and Walking Service Area from Tysons Corner at 5 PM
………... 21
Map 8 - Proposed Fairfax Connector Bus Routes by Headway ………... 25
LIST OF TABLES
Table 1 - Demographics of Tysons Corner Compared to the Region ………... 9 Table 2 - Population Over 16 in Labor Force Residing Near Tysons
Corner Metro Stations
………... 15
Table 3 - Top Fifteen Places of Residence for Tysons Corner Workers
………... 16
Table 4 - Area Workers with Current Transit Access to Tysons Corner
………... 17
Table 5 - Current Employed Population in DC Metropolitan Area That Can Reach Tysons Corner by Transit
………... 23
Table 6 - Frequency Changes inModified Fairfax Connector Bus Routes (based on 5 PM departure)
………... 24
Table 7 - Future Scenario: Employed Population within Half of Mile of a Metro Station That Can Reach Spring Hill Station by Metrorail
3
ABSTRACT
4
INTRODUCTION
In recent decades, the paradigm of transportation planning has shifted from providing mobility to providing accessibility (Hanson & Schwab, 1987; Litman, 2012). Although this shift has been more noticeable within academia, practicing planners have also started to look at the ability of people to reach a variety of destinations rather than how quickly they can move across space. This focus on accessibility has led to a number of attempts to define accessibility measures and apply them to practice. The hope is that accessibility measures might “provide planners and decisionmakers with a better assessment of the implications of potential investments for the daily lives of residents” (Handy & Niemeier, 1997).
Studies have measured accessibility by private automobile, walking, biking, and transit; however, this paper will focus on accessibility by public transit. It is important to analyze accessibility by public transit within an area for a variety of reasons. In the United States’ larger metropolitan areas, the road network is built out and cannot be easily expanded. Policymakers in these areas therefore target public transit as an alternative option to traveling within the region. Additionally, a well-developed public transportation network provides travel options to those who are unable to afford or use private automobiles. Finally, as regions work to reduce auto emissions, public transit is seen as an environmentally friendly way to move large amounts of people.
The purpose of this paper is to analyze how a major transit investment affects local and regional transit accessibility, particularly with regards to employer access to labor. The study area for this research is Tysons Corner, Virginia, which is the location of four of the five new Washington Metropolitan Area Transit Authority (WMATA) Metrorail (Metro) stations that are scheduled to open in summer 2014 as part of the new Silver Line. These stations constitute Phase 1 of a two-phase construction project that will eventually link Washington, DC to Dulles International Airport by rail transit. Tysons Corner has grown into the second largest employment center in the Washington, DC metropolitan area after downtown DC, so having quality transit service to and within the area is an important regional goal (Greater Washington 2050 Coalition, 2010). In addition to the Metro service, the county transit provider is dramatically increasing bus service from the surrounding communities to Tysons Corner as a way to complement and encourage people to use the new rail line.
5 become the “downtown” of Northern Virginia, it will need to have strong transit connections that allow workers to travel to their place of employment using alternative modes of transportation.
I have chosen to focus on transit accessibility of workers to employment because journey to work trips have the largest transit mode share of any type of trip (Pisarski, 2006) and occur during peak travel times when the transit system is running the most frequent service. Additionally, journey to work data is readily available from the Census Transportation Planning Products, so it is possible to analyze the transit options given the main origins of workers who are employed in the Tysons Corner area. By examining the bus and rail transit options before and after the planned Silver Line Metro stations, I hope to determine how the transit accessibility of Tysons Corner has improved and whether any changes could be made to improve the existing coverage, particularly by bus, so that employers within Tysons Corner have the best possible access to eligible employees.
This study has important policy implications because it provides a groundwork for calculating transit accessibility that is easily replicable due to its use of publicly available data. In a complicated metropolitan transportation system with multiple transit providers, it is often difficult to determine how the routes work together to provide a complete network of transit to a region. By being able to spatially compare the time-based service areas by transit from a given location, it is easier to quantify the benefits that might arise from improvements and extensions to the system.
LITERATURE REVIEW
Accessibility is an abstract concept that researchers have struggled to measure (Dong, Ben-Akiva, Bowman, & Walker, 2005; Handy & Niemeier, 1997; Lei & Church, 2010). Nonetheless, accessibility measures have become important to transportation planning because travel is viewed as a derived demand for which people travel to reach destinations rather than for the joy derived from travel (El-Geneidy & Levinson, 2006; Handy & Niemeier, 1997). This idea was initially established by Walter Hansen when he defined accessibility as “the potential of opportunities for interaction” (Hansen, 1959).
GENERAL MEASURES OF ACCESSIBILITY
Previous research on how to measure accessibility has generally focused on three types of measurement: cumulative opportunity (or isochrone) measures, gravity-based measures, and utility-based measures (Dong et al., 2005; Handy & Niemeier, 1997).
6 by an impedance, such as travel time or travel cost (Handy & Niemeier, 1997). These measures are derived from the denominator of the gravity model for trip distribution in the four-step model. Finally, utility-based measures determine the probability that a person will make a particular choice based on the utility of that choice relative to the utility of all choices (Lei & Church, 2010). This type of measure can also focus on activity-based travel rather than trip-based travel (Dong et al., 2005).
What all of these accessibility measures have in common is that they measure accessibility based on two elements: a transportation element and an activity element (Handy & Niemeier, 1997). In many cases, the main transportation element evaluated by researchers has been the private automobile.
MEASURES OF TRANSIT ACCESSIBILITY
Studies that have looked at transit accessibility have focused on characteristics such as access to transit stops, trip length, trip frequency, and access to destinations by transit.
Spatial Availability
The success of a public transportation system relies on both access and accessibility (Murray, Davis, Stimson, & Ferreira, 1998). The term access refers to the ability of people to reach the public transportation system and is often the first measure of accessibility within an area. Access to transit stops, or system accessibility, tries to determine whether a person can easily walk to a transit stop at both trip ends. System accessibility can be based on the distance, time, or effort required to access the system (Lei & Church, 2010). Distance-based measures are often based on the standards in the Transit Capacity and Quality of Service Manual, which defines the standard walking buffer for coverage as ¼ mile around a bus stop and ½ mile around a rail stop (Kittelson & Associates, Parsons Brinckerhoff, KFH Group, Texas A&M Transportation Institute, & Arup, 2013). Researchers have calculated these distances using both Euclidean distances and network distances, which take into account the street network.
A number of researchers have examined aspects of the built environment as a proxy for the effort required to access the system. One study defined these aspects as impedance attributes that relate to the safety, convenience, comfort, and aesthetics of the trip (Bhat et al., 2000). Some examples include the amount of lighting, sidewalk continuity, provision of benches at bus stops, and debris along the roadway. Estupiñán and Rodriguez (2008) analyzed the built environment around bus rapid transit stops in Bogota and found that aspects of the built environment that encourage walking, such as sidewalk quality and amenities (benches, crosswalks, and cleanliness), are correlated with higher transit use.
Temporal Availability
7 variables in determining how many people used transit in the county (Thompson, Brown, & Bhattacharya, 2012). Because travel time from an origin to a destination is so important, many researchers have focused on ways of accounting for travel time by transit. Lei and Church (2010) used accessibility maps based on actual transit routes and schedules to compare the transit accessibility from an origin to a destination to the accessibility of a private automobile. Other methods that measure the temporal coverage of a transit system include the Time-of-Day-Based Transit Accessibility Analysis Tool (Polzin, Pendyala, & Navari, 2002) and the Travel Time Accessibility Index (Schoon, McDonald, & Lee, 1999). More recently, Mamun, Lownes, Osleeb, and Bertolaccini (2013) created a Transit Opportunity Index that accounts for transit accessibility and connectivity by analyzing spatial coverage, temporal coverage, and trip coverage.
Just as important to temporal availability is the frequency of the transit route. The Transit Capacity and Quality of Service Manual notes that transit riders will arrive at a stop randomly if headways are 10 minutes or less, but they will schedule their arrival if headways are 15 minutes or more (Kittelson & Associates et al., 2013). This difference in how passengers react to headway lengths could make the difference in whether a person finds transit a realistic travel option because it would affect expected waiting times.
EMPLOYMENT ACCESSIBILITY
If transit is both spatially and temporally available, then the next step is to look at whether the system is serving the needs of its users by taking them to important destinations. Accessibility to employment by transit has become an increasingly important topic of research as jobs move from their traditional, city center location to a polycentric collection of employment centers within a region. A number of studies have analyzed the transit system in a major metropolitan area to determine whether it effectively provides access to these jobs. Matsuo (2011) examined the employment distribution and labor accessibility in the cities of Atlanta, Boston, Phoenix, and Washington, DC. She found that, of the four cities studied, Atlanta and Washington, DC had low labor accessibility that was due, in part, to heavy congestion that prevented accessibility. Modarres (2003) also evaluated transit service in a polycentric region and found that transit provided an inadequate connection between residences and the polycentric employment centers in Los Angeles County.
8
STUDY AREA
The study area for this research is Tysons Corner, VA. Tysons Corner is an unincorporated census designated place lying between the more established DC suburbs of McLean and Vienna. It is located approximately 10 miles west of Washington, DC at the intersection of Routes 7 and 123, which are major commuter roadways in Virginia. Tysons Corner is also close to the Capital Beltway (I-495) and the Dulles Toll Road (Route 267), so it is easily accessible by car to most of the major roadways in Northern Virginia (see Map 1). Its prime highway location changed Tysons Corner from a small, rural crossroads into one of the major employment centers in the Washington, DC metropolitan area (Schrag, 2006). As of 2008, Tysons Corner was the 12th largest employment center in the United States (Meyer, 2008).
Map 1 – Study Area: Tysons Corner, VA
9 Tysons Corner is part of Fairfax County, VA, and the extension of the DC Metro to Tysons Corner comes as officials in Fairfax County are trying to re-envision Tysons Corner as a city rather than a suburban office park. They see it as a potential “downtown” for this highly populated county within the DC metropolitan region. Of the approximately 5.5 million residents in the DC area, only 600,000 live in the city of Washington, DC while over one million live in Fairfax County (see Table 1 for additional information). Officials in Fairfax County are therefore promoting a mixed-use, walkable vision for Tysons Corner (Fairfax County, 2013a). One of the main results of this vision is that the four Metro stations, in comparison to previous Metro stations located this far from downtown DC, do not have parking associated with the stations (Aratani, 2013). Therefore, the Fairfax Connector, Fairfax County’s bus transit provider, is complementing the forthcoming Silver Line service with a major increase in bus service in the county. Fifteen new Fairfax Connector routes will start operation on the first day of Silver Line service, and 28 Fairfax Connector routes are being redesigned to better accommodate transfers with the Silver Line (Aratani, 2013). Because these bus routes will serve as one of the main ways to access the rail transit, it is important that they provide good accessibility to Tysons Corner for people in surrounding communities who need to travel on the Metro to reach their destinations and for people who work in Tysons Corner.
Table 1 – Demographics of Tysons Corner Compared to the Region
Washington Metropolitan Area Washington, DC Fairfax County, VA Tysons Corner CDP, VA
Total Population 5,582,170 601,723 1,081,726 19,627
Density (per sq. mile)
997 9,857 2,767 4,605
Land Area (sq. miles)
5,598 61 391 4
Employment1 3,040,705 754,615 574,070 71,400
Source: U.S. Census Bureau, 2010 and American Association of State and Highway Transportation Officials, 2014
DATA
This study uses publicly available data, such as the Census Transportation Planning Products (CTPP) (American Association of State and Highway Transportation Officials, 2014), the American Community Survey (ACS), and General Transit Feed Specifications (GTFS). The CTPP uses 2006-2010 ACS data, but it provides more detail than the standard ACS data by including journey-to-work flow data and workplace information at smaller geographies. Due to the repackaging required of the CTPP, it uses less current ACS data than is available. To get a more accurate picture of the current population and employment data, I used the five-year 2008-2012 ACS to calculate employment levels within block groups. Lastly, GTFS is a series of text
1 Note that the employment estimation for the Washington Metropolitan Area in this table differs from that given in
10 files that includes route and schedule information and powers transit data displayed in Google Maps and other online trip planners. I chose to use these sources because they are easy to obtain and can be used to analyze the transit system of any city that has GTFS data published online.
In this analysis of the transit network, I chose to focus specifically on two transit providers: Fairfax Connector and WMATA. Fairfax Connector is the main transit provider in Fairfax County, VA and provides the bulk of the transit service in and around Tysons Corner. WMATA has both rail and bus routes; most of the Metro buses that currently run through the Tysons Corner area link riders with Metro stations in Northern Virginia. I decided to not include the Arlington County or Loudoun County transit systems in my analysis. One reason I did this was because my study area was focused on Fairfax County. A second reason is because I assumed that passengers would need to transfer multiple times in order to use those systems. Since transfer time is perceived as 2.5 times more lengthy than in-vehicle travel time, I assumed that most riders would avoid trips with multiple transfers (Kittelson & Associates et al., 2013).
METHODOLOGY
The methodology of this study involved looking at journey-to-work data, analyzing the time-based transit service areas of the current transit system, and inferring future conditions time-based on what is currently known about the schedules and frequency changes being made as a result of the Silver Line. If this methodology were defined based on Lei and Church’s six categories of accessibility, it would be system facilitated accessibility. System facilitated accessibility “measures a user’s ability to get to their destination and takes into account the travel time or cost spent in the transportation network or the associated effort in making the trip” (Lei & Church, 2010).
JOURNEY-TO-WORK
In order to understand what people would need from a transit system, I needed to know how people traveled throughout the region. I was specifically interested in the residences of workers who live near Tysons Corner and the residences of workers who are employed in Tysons Corner. My hypothesis was that most people who worked at Tysons Corner lived mainly in Northern Virginia, which would mean that the increased bus service would be vitally important if transit were to be a viable option to travel to work. I thought that the bus service would also be important for area residents, as it provides one of the main options for arriving at or leaving one of the four Tysons Corner Metro stations, given that there are no Metro parking garages and the current pedestrian infrastructure is not conducive to walking long distances (Fairfax County, 2013a).
11 Corner stations could reasonably draw passengers. I also repeated the analysis for one- and three-mile buffers to conduct a sensitivity analysis. I determined the number of workers living within these buffers by taking ACS block group level data and proportionally assigning the number of people in the labor force to the network buffers based on the spatial proportion of a block group within the buffer.
Map 2 – Area Within One, Two, and Three Miles of a Future Silver Line Station
I used the CTPP, which currently uses 2006-2010 ACS data, to determine the residential locations of people who work at Tysons Corner. The CTPP data provides flows of origins and destinations for the journey to work trip, which I examined using both place and traffic analysis district (TAD) level data. I analyzed travel flows at the TAD level rather than the traffic analysis zone (TAZ) level because the TAZ calculations from five years of ACS data were either suppressed or had a margin of error that was similar in size to the estimate. TADs are composed of whole TAZs, nest within metropolitan planning organization (MPO) boundaries, and have a population threshold of 20,000 people (American Association of State and Highway Transportation Officials, 2013). While the resulting data are not as disaggregated as TAZ-level origin and destination travel would be, the TAD data still provide a picture of where people who work in Tysons Corner travel from within the region.
EXISTING CONDITIONS
12 to use travel time as my measure of impedance, as it would give a more accurate assessment of time spent traveling than a distance-based impedance measure. I wanted to take into account both walking and transit use when determining how long it would take people to reach their workplace and whether using transit was feasible. I used a prototype tool from ESRI that uses route and schedule information from publicly available GTFS data to create road network-based buffers for how far one can travel by transit and on foot within a given time period (Morang, 2013).
I downloaded the GTFS data for Fairfax Connector and WMATA from their respective websites and used the prototype tool to create a network data set that included the transit lines and stops as well as the roadway network for the DC metropolitan area (Fairfax Connector, 2013; WMATA, 2013a). I chose to focus only on the Fairfax Connector and WMATA transit options because they are the two main providers of transit in Fairfax County. My assumption was that bus services within other counties, such as Arlington or Loudoun in Virginia, would require multiple transfers and therefore be unlikely to be used as a main way to travel to work. The prototype tool is particularly useful for analyzing rail transit times because it creates small connector lines in the network that link a rail stop (or a bus stop) to the nearest point along the roadway network. The connector lines are also useful because you can add a time delay to the service area calculations to account for boarding or alighting a transit vehicle.
The network dataset that I created was based upon the following assumptions:
Boarding a vehicle takes 30 seconds; Alighting a vehicle takes 30 seconds; and
The average walking speed is a conservative estimate of 3 feet/second (Gates, Noyce, Bill, & Van Ee, 2006).
With these assumptions in place, I used the Network Analyst tool in ESRI’s ArcMap to determine how far a person could travel by transit or on foot within given times periods. I initially created service areas for the following amounts of time: 15 minutes, 30 minutes, 45 minutes, 60 minutes, 75 minutes, and 90 minutes. However, given the limited distance that one can travel in 15 minutes by transit in Tysons Corner, I chose to eliminate 15 minutes as a service area calculation. The service areas were created based on PM peak travel times, as that is when workers would be traveling from Tysons Corner or the Tysons Corner stations to their homes. More specifically, 5 PM served as the start time for the trip from work to home in the calculations of transit service areas by travel time. The time-based service areas were calculated using any one of the four points where a future Tysons Corner Silver Line Metro station is located as the starting point of travel.
13 mile to reach a bus stop and ½ mile to reach a rail stop (Kittelson & Associates et al., 2013). An example of how the service area is overestimated in shown in Map 3. Notice how the 75 and 90 minute service areas include areas that are far away from any transit stops.
Map 3 – Initial Transit and Walking Service Areas
Source: Fairfax Connector, 2013; Morang, 2013; WMATA, 2013a
14 were bus stops instead of rail stations. This change reduced the total area that could be covered within a given time period, but it likely reflects a more realistic picture of how far people are willing to walk to reach a destination, especially since the area is not currently very pedestrian friendly. I did not focus much attention on the 90-minute transit and walking service area because I thought that the new, conservative transit and walking service areas accounted more for the transit travel time than for a combined transit and walking travel time. A bus stop that could be reached after 90 minutes of travel now also allowed an additional ¼ mile of walk time. I therefore thought that the 75 minute service area would provide for a combination of transit and walking trips that approached 90 minutes of total travel time.
To estimate the number of employed area residents who would be able to access these transit options to travel between their home and Tysons Corner, I merged block group level employment data for residents who live within one, two, or three miles of Tysons Corner with the 30, 45, and 60-minute conservative transit and walking service areas to determine the proportion of the area population that can use bus transit to reach Tysons Corner. I did not include the 75 minute service area in this part of the analysis because I thought it was unrealistic that anyone would use transit if it took over 60 minutes to go three miles.
I then used the 30, 45, 60, and 75-minute transit and walking service areas to see how well the transit system served the residences of people who are employed in Tysons Corner. This analysis was more qualitative and involved overlaying the time-based service areas on the TAD-level information about employed people who work in Tysons Corner. I was able to visually identify areas within the Washington, DC metropolitan region that had high concentrations of residents who work in Tysons Corner and are either well-served or poorly served by the existing transit system.
15
FUTURE CONDITIONS
The analysis of the future conditions is somewhat limited because the rail project has fallen behind several times and the new bus routes and stations have yet to go into operation. This delay means that the GTFS data that has the new routes and schedules has not been published. Because there is no GTFS data available, I was unable to go through the same process of creating a network dataset to analyze the spatial coverage within a given time period for the new service. Instead, I did a more qualitative analysis of how the changes to the bus routes would improve transit service within the county. I particularly looked at the frequency, or headway, of the bus routes that are being modified or added to accommodate Silver Line passengers.
I also obtained an origin-destination matrix of the projected travel times among the new Silver Line stations and current stations to see how transit access to the larger metropolitan region would be improved. Using these projected travel times between Metro stations, I estimated the number of employed people living within a half mile of the Metro stations to attempt to get an idea of how accessibility to people in the workforce would change with the opening of the Silver Line. This rough estimation underestimates the number of people who can take transit from Tysons Corner because it ignores the bus transit options. However, the estimate does provide a starting point from which to analyze the accessibility improvements.
RESULTS
JOURNEY-TO-WORK
Based on employment data from the ACS 2008-2012, I calculated the number of people in the workforce who reside within one, two, and three miles of Tysons Corner. As the results in Table 2 show, the Tysons Corner area does not have a large number of people in the labor force who live within what would be considered walking distance of the new stations. This lack of people demonstrates the need for the bus system to effectively transport people who live over a mile away from the stations between their home and the new Metro stations.
Table 2 - Population Over 16 in Labor Force Residing Near Tysons Corner Metro Stations
Distance from a Tysons Corner Metro Stations
Number of Residents in the Work Force
Within One Mile 7,452
Within Two Miles 25,050
Within Three Miles 43,528
Source: U.S. Census Bureau, 2013
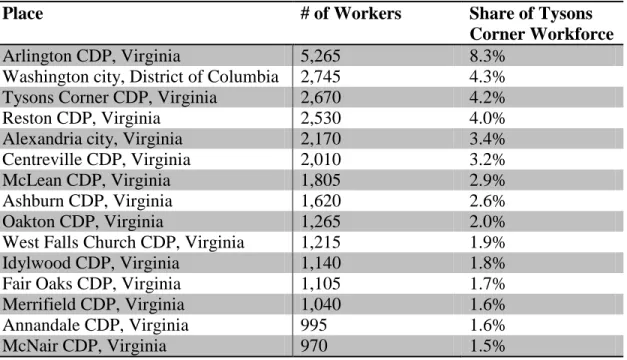
16 the travel times by transit for those workers. Reston, which has the fourth largest population of residents who work in Tysons Corner, is not currently served by the Metrorail but will be when Phase 1 is complete. Reston also has an established bus transit system, so people who live there may be well-equipped to take advantage of the Silver Line when it opens for service. The other places within the top 15, however, are more suburban locations that are not very well served by transit.
Table 3 – Top FifteenPlaces of Residence for Tysons Corner Workers
Place # of Workers Share of Tysons
Corner Workforce
Arlington CDP, Virginia 5,265 8.3%
Washington city, District of Columbia 2,745 4.3%
Tysons Corner CDP, Virginia 2,670 4.2%
Reston CDP, Virginia 2,530 4.0%
Alexandria city, Virginia 2,170 3.4%
Centreville CDP, Virginia 2,010 3.2%
McLean CDP, Virginia 1,805 2.9%
Ashburn CDP, Virginia 1,620 2.6%
Oakton CDP, Virginia 1,265 2.0%
West Falls Church CDP, Virginia 1,215 1.9%
Idylwood CDP, Virginia 1,140 1.8%
Fair Oaks CDP, Virginia 1,105 1.7%
Merrifield CDP, Virginia 1,040 1.6%
Annandale CDP, Virginia 995 1.6%
McNair CDP, Virginia 970 1.5%
Source: American Association of State and Highway Transportation Officials, 2014
To provide some travel time context to my results, I also looked up the travel time to work for residents of Fairfax County, VA. Approximately 46.2 percent of workers have a travel time to work that is less than 30 minutes, and only 13.2 percent of workers have a travel time to work that is over 60 minutes (U.S. Census Bureau, 2013). These statistics will be important to keep in mind as the time-based transit service areas are discussed.
EXISTING CONDITIONS
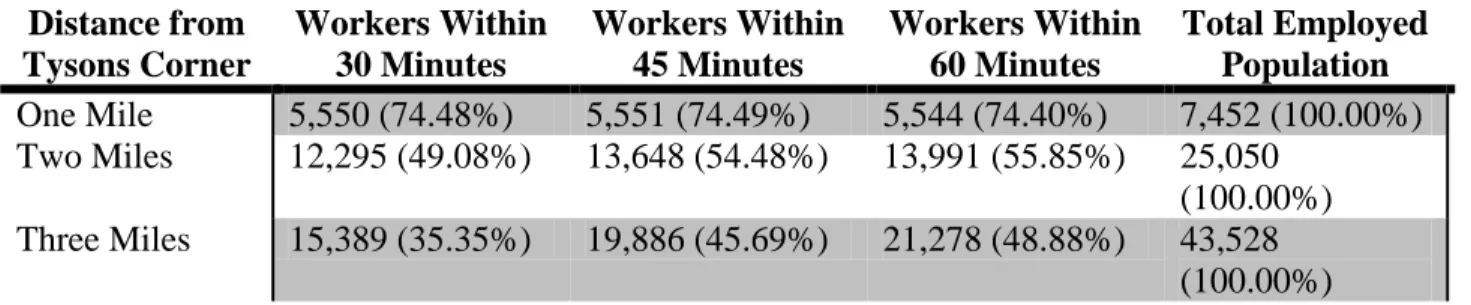
17 that this transit trip comprises one leg of a journey-to-work trip for someone who intends to use the Metrorail, the time traveling by bus transit is quite large.
Table 4 - Area Workers with Current Transit Access to Tysons Corner
Distance from Tysons Corner
Workers Within 30 Minutes
Workers Within 45 Minutes
Workers Within 60 Minutes
Total Employed Population
One Mile 5,550 (74.48%) 5,551 (74.49%) 5,544 (74.40%) 7,452 (100.00%) Two Miles 12,295 (49.08%) 13,648 (54.48%) 13,991 (55.85%) 25,050
(100.00%) Three Miles 15,389 (35.35%) 19,886 (45.69%) 21,278 (48.88%) 43,528
(100.00%) Source: U.S. Census Bureau, 2013
While the bus service that currently exists around Tysons Corner provides adequate coverage for people who live within three miles of the area, the transit service for those who commute to and from Tysons Corner for work is nowhere near as comprehensive. Maps 4 through 7 show the distance that a person can travel in 30, 45, 60, and 75 minutes (respectively) from Tysons Corner by transit if she leaves at 5 PM. An important thing to remember with these service areas is that the time is calculated from the four Tysons Corner locations where Metro stations are being built for Phase 1 of the Silver Line. Therefore, in the current scenario, it is quite probable that a person will have to walk for at least a few minutes in order to reach one of the existing bus routes that runs from Tysons Corner to other destinations.
As you look at the time-based service area maps, the following things become apparent:
30 Minutes – Transit Service Area: While the area immediately around Tysons Corner is covered by transit, the only other areas with transit coverage within 30 minutes extend along three major roadways; the transit coverage does not reach secondary roadways or more residential areas where people are more likely to live. Neither Arlington nor Washington, D.C. can be reached within this time frame. Of note is the purple patch of coverage that is south of Fairfax and Annandale. This coverage comes from an express bus that connects the Virginia Railway Express (VRE), a commuter railroad in Northern Virginia, with Tysons Corner.
18
Map 4 – Current 30-Minute Transit and Walking Service Area from Tysons Corner at 5 PM
19
Map 5 – Current 45-Minute Transit and Walking Service Area from Tysons Corner at 5 PM
20
Map 6 – Current 60-Minute Transit and Walking Service Area from Tysons Corner at 5 PM
21
Map 7 – Current 75-Minute Transit and Walking Service Area from Tysons Corner at 5 PM
22 60 Minutes – Transit Service Area: Within 60 minutes by transit, destinations in Washington, DC can be reached; Arlington has much more complete coverage; and destinations south of Tysons Corner, such as Springfield and Fairfax City, have better coverage. Unlike places in the eastern section of the county, Chantilly and Centreville are still unreachable from Tysons Corner within 60 minutes. One reason for this lack of coverage could be that the Fairfax Connector and Metro buses that serve the area connect with either the Vienna Metro Station or in Reston. Therefore, traveling to these destinations would require at least one transfer.
75 Minutes – Transit Service Area: By the time a person has been traveling from Tysons Corner by transit for 75 minutes, she is able to reach most locations in Fairfax County (with the exception of the towns in southwest Fairfax County). A larger proportion of Washington, DC is also accessible. A notable exception in coverage in this time-based transit service area is the Maryland suburbs of Washington, DC. Maryland is separated from Virginia by the Potomac River, and the only bridge that crosses from Fairfax County, VA into Montgomery County, MD does not have transit service. Therefore, anyone traveling by transit from Fairfax County to somewhere in Maryland would need to go through DC first.
When these transit service coverage areas are compared to the locations where people employed at Tysons Corner live, it appears that the bus service does a good job at reaching most of the more heavily populated areas (shown in dark green on the maps). The main areas with large numbers of residents who work in Tysons Corner and are lacking transit connections to Tysons Corner are TADs near Ashburn, VA and west of Oakton, VA. Ashburn, VA actually does have an express bus service to and from Tysons Corner that was put into service in 2010 by Loudoun County, VA. However, it does not appear on my maps because I only analyzed the routes and schedules of Fairfax Connector and WMATA transit. Even so, the bus takes much longer than one would expect because the route winds through Tysons Corner for the first 30 minutes to pick up passengers at various locations before traveling to Loudoun County (Loudoun County, 2013). Another important thing to remember is that Washington, DC and Arlington also have many residents who commute to Tysons Corner; the numbers are just diluted on the maps because both places are composed of multiple TADs.
23 by transit than the Brookings Institute report because I used ¼ mile buffers from transit stops based on block group-level employment information while the Brookings Institute report used ¾ mile buffers from transit stops based on census tract-level information. Regardless, I believe my findings highlight the need for a major investment in the public transit network near Tysons Corner, as it is the second largest employment center in the metropolitan area and should be accessible to more than 16 percent of the population in the labor force.
Table 5 – Current Employed Population in DC Metropolitan Area That Can Reach Tysons Corner by Transit
Within 30 Minutes Within 45 Minutes Within 60 Minutes Within 75 Minutes Within 90 Minutes Total Employed Population Number of People in Labor Force 17,531 (0.54%) 54,521 (1.68%) 159,794 (4.93%) 341,640 (10.55%) 515,564 (15.92%) 3,238,099 (100.00%)
Source: U.S. Census Bureau, 2013
FUTURE CONDITIONS
Because the bus schedules for the Fairfax Connector once the Silver Line opens have not been published, I relied on the proposed modifications to existing routes and new routes to speak generally about how the service coverage might change as a result of the transportation investment.
24
Table 6 - Frequency Changes in Modified Fairfax Connector Bus Routes (based on 5 PM departure)
Route # Current Frequency Future Frequency Frequency Percent Change Main Location Served
401 20 15 -25% Tysons Corner
402 20 15 -25% Tysons Corner
462 35 30 -14% Tysons Corner
463 35 20 -43% Tysons Corner
505 10 20 100% Reston
551 30 15 -50% Reston
552 30 18 -40% Reston
553 35 18 -49% Reston
554 30 18 -40% Reston
557 30 18 -40% Reston
574 60 30 -50% Tysons Corner
585 15 20 33% Reston
924 30 30 0% Reston
926 20 30 50% Reston
927 30 30 0% Herndon
929 30 30 0% Reston
950 15 30 100% Reston
951 30 30 0% Reston
952 30 30 0% Reston
980 6 12 100% Reston
981 25 20 -20% Reston
Source: Fairfax County, 2013b
Map 8 shows the Fairfax Connector bus routes that have been modified or added to complement the Silver Line. In addition to the Silver Line, the only other transit routes that are scheduled to run at headways of ten minutes or less are the three circulator routes that connect the new Tysons Corner stations with various destinations within Tysons Corner. These circulator routes will make it easier for people who work in Tysons Corner to reach their place of employment after getting off the Silver Line. As more residential units are built in Tysons Corner, the circulator buses will also provide quick access for residents to the Metro stations. The circulator buses will reduce the need for people to walk long distances to reach a transit stop, thus improving the system accessibility in Tysons Corner.
25 covered by multiple routes. Many Reston bus routes should also benefit from improved service reliability, as many of the routes that now start and end at Reston’s Phase 1 Metro station previously traveled an extra 11 miles each way to West Falls Church Metro Station.
Map 8 - Proposed Fairfax Connector Bus Routes by Headway
26 WMATA has tentative estimates of travel times between stations once the Silver Line opens. The travel times indicate that there will be a substantial increase in the number of people able to reach Tysons Corner. From Spring Hill Metro Station, the most westward of the Tysons Corner stations, the longest travel time during peak hour assuming a 5 minute transfer time between trains is 74 minutes to Shady Grove Metro Station in Maryland. Considering that the current conditions do not allow for any travel to Maryland within 75 minutes, this travel time represents a major increase in accessibility. Additionally, the travel time from Spring Hill Station to Rosslyn Metro Station, which is the last station in Arlington, VA before the train crosses into DC, is just 26 minutes (WMATA, 2013b).
If one takes into account just the rail transit accessibility gained from connecting Tysons Corner to the rest of the WMATA system, there is an increase in the number of people in the workforce that can commute by transit to Tysons Corner. Since I did not have enough information to calculate a transit and walking time-based service area, I did a simple calculation of the number of employed residents living within a half mile of a Metro station. The resulting population in the work force that lives within a half mile is 437,585 people. Since the farthest station from Tysons Corner during the peak service time is 74 minutes, this means that at least 437,585 people can travel from Tysons Corner to their home by transit within 75 minutes. This number is a 28 percent increase in accessible labor to Tysons Corner and does not even include population living within the improved service area of the Fairfax Connector.
Table 7 – Future Scenario: Employed Population within Half of Mile of a Metro Station That
Can Reach Spring Hill Station by Metrorail (no buses included)
Within 30 Minutes Within 45 Minutes Within 60 Minutes Within 75 Minutes Total Employed Population
Number of People in
Labor Force 79,496
(2.46%) 191,209 (5.90%) 393,877 (12.16%) 437,585 (13.51%) 3,238,099 (100.00%) Change in Population From Current Scenario
353% 251% 146% 28% n/a
Source: U.S. Census Bureau, 2013
27
DISCUSSION
This study provides a base level upon which future transit changes in Tysons Corner can be evaluated. Given the relatively small number of people living within Tysons Corner (approximately 20,000), employers in Tysons Corner need to draw from a much wider geographical area to fill the approximately 71,000 available jobs. Under the current transit system, only 54,521 people in the labor force can travel from Tysons Corner to their home by transit within 45 minutes, and the majority of these people probably do not work in Tysons Corner. Given that 46.2 percent of workers in Fairfax County are estimated to have a travel time to work that is less than 30 minutes, this discrepancy highlights why the car continues to be a more popular option for journey-to-work travel within the county. The current bus transit network can get people to their destinations, but the results suggest that the service is probably only used by captive riders. Additionally, the small percentage of people in the region who can access Tysons Corner by transit highlights the need for a transit investment and shows that the regional transportation system fails to provide good enough service to allow for broader geographical access to employees.
Given the dramatic time improvements in the journey-to-work trip when the Silver Line opens, I hypothesize that employers in Tysons Corner might find more people who are willing to make the commute from areas in Maryland or Washington, DC. The change in labor force population that can be reached by transit within 30 and 45 minutes is particularly striking, as it makes traveling to Tysons Corner by rail a much more viable option for workers who live in Arlington, Reston, and Washington, DC. For other areas, however, I think that traveling by car will still be a preferable commuting option due to its ease and convenience.
The increase in bus service in the Tysons Corner area is just as important as the Silver Line to the functioning of the transportation network in Fairfax County, especially if we want people who live south and southwest of Tysons Corner to use transit. Because the area around Tysons Corner is composed of large, multi-lane roads or two-lane roads with no shoulders and few sidewalks, the buses provide an important alternative for short trips that might otherwise be done by biking or walking. They serve as a feeder system to the Silver Line and therefore must run frequently enough to ensure first and last-mile connectivity. The buses are also important due to the lack of permanent Metro parking garages at any of the Tysons Corner stations. If the bus network is seen as unreliable or inconvenient to area residents, it is quite likely that Metro riders will chose to drive and park at Metro stations that are slightly farther away from their home but offer parking. Vienna, West Falls Church, and Wiehle-Reston East stations (see Map 2 on page 11) all have sizeable parking garages that hold between 2,000 and 5,000 vehicles. Therefore, I think many people might opt to drive an extra mile to have guaranteed parking for their commute.
28 on Google Maps is only given information on Metro buses that run through the area, and this lack of information makes the transit system seem more deficient than it actually is. To my knowledge, the only place where directions involving both the Fairfax Connector and WMATA can be obtained is through WMATA’s online trip planner. Although this seems like a minor issue, I would argue that information accessibility is one of the more important aspects of operating a successful system.
Lastly, it is important to consider how the Silver Line will change the residential location choice of employees in the region. People who work in Tysons Corner might move closer to a Metro line in order to benefit from the improved access to the area. People might also be willing to move farther from their office, say to a more urban area such as Arlington or Washington, DC, because they are willing to trade a longer commute for a more vibrant residential environment if they are able to commute by rail (and thus avoid the region’s heavy congestion). Conversely, another issue that will be worth exploring in the future is how the extension of the Metro to Tysons Corner influences the population living within Tysons Corner. Will the Silver Line help Tysons Corner become an inviting multi-purpose destination, as the Orange Line did for the Clarendon-Ballston corridor in Arlington? Considering the small number of current residents within the area who can easily access the Tysons Corner stations by bus or walking, I think future use of the Silver Line will benefit from an increase in residential density within Tysons Corner.
LIMITATIONS
This study has a number of limitations that should be taken into account when analyzing the transit accessibility within Tysons Corner. The most major limitation was the lack of GTFS data for the future Silver Line; without this information, it was not possible to make a direct comparison between the existing time-based service areas and the future ones. When the new service begins in the summer of 2014, it would be helpful to revisit this topic and measure the transit accessibility from Tysons Corner using the actual route and schedule information for that time period.
Additionally, the methodology for this study relied on the assumption that the population within a block group is evenly distributed across the area. By proportionally distributing the employed population within a block group to a transit service area based on the area of the block group that overlaps with the service area, the location of roads or housing parcels is not taken into consideration. Some transit service areas could have a larger population living within their boundaries based on features of the built environment.
29
CONCLUSION
30
WORKS CITED
American Association of State and Highway Transportation Officials. (2013). Transportation analysis zones (TAZ) FAQs (2006-2010 ACS ed.). Washington, D.C.
American Association of State and Highway Transportation Officials. (2014). Census transportation planning products (2006-2010 ACS ed.). Washington, D.C. http://ctpp.transportation.org/Pages/5-Year-Data.aspx
Aratani, L. (2013). Metro’s silver line is coming to Tysons, but don’t look for lots of new commuter parking. The Washington Post.
http://www.washingtonpost.com/local/trafficandcommuting/metros-silver-line-is-coming- to-tysons-but-dont-look-for-lots-of-new-commuter-parking/2013/11/27/d6139e78-41b0-11e3-a751-f032898f2dbc_story.html
Bhat, C., Handy, S., Kockelman, K., Mahmassani, H., Chen, Q., & Weston, L. (2000).
Accessibility measures: Formulation considerations and current applications No. TX-01/7-4938-2. Austin, TX: Center for Transportation Research, The University of Texas at Austin.
Dong, X., Ben-Akiva, M. E., Bowman, J. L., & Walker, J. L. (2005). Moving from trip-based to activity-based measures of accessibility. Transportation Research Part A, 40, 163-180.
El-Geneidy, A. M., & Levinson, D. M. (2006). Access to destinations: Development of accessibility measures No. MN/RC-2006-16. St. Paul, MN: Minnesota Department of Transportation.
ESRI. (2014). Fifty largest shopping malls in the United States.
http://storymaps.esri.com/stories/2012/malls/
Estupiñán, N., & Rodriguez, D. (2008). The relationship between urban form and station boardings for bogota's BRT. Transportation Research Part A, 42(2), 296-306.
Fairfax Connector. (2013). Fairfax connector data for developers in GTFS format. Fairfax County, VA: Fairfax County. http://www.fairfaxcounty.gov/connector/data/
Fairfax County. (2013a). Fairfax county comprehensive plan: Tysons corner urban center. Fairfax County, VA. http://www.fairfaxcounty.gov/tysons/comprehensiveplan/
Fairfax County. (2013b). Silver line, phase 1 bus service.
http://www.fairfaxcounty.gov/connector/routes/silverline/routes.htm
Fairfax County Economic Development Authority. (2014). Fortune 500 list.
31 Gates, T. J., Noyce, D. A., Bill, A. R., & Van Ee, N. (2006). Recommended walking speeds for
pedestrian clearance timing based on pedestrian characteristics. Transportation Research Board 2006 Annual Meeting, Washington, D.C.
Greater Washington 2050 Coalition. (2010). Region forward: A comprehensive guide for regional planning and measuring progress in the 21st century. Washington, D.C.: Metropolitan Washington Council of Governments. http://www.mwcog.org/uploads/pub-documents/p15fX1g20100407104951.pdf
Handy, S. L., & Niemeier, D. A. (1997). Measuring accessibility: An exploration of issues and alternatives. Environment and Planning A, 29, 1175-1194.
Hansen, W. G. (1959). How accessibility shapes land use. Journal of the American Institute of Planners, 25, 73-76.
Hanson, S., & Schwab, M. (1987). Accessibility and intraurban travel. Environment and Planning A, 19, 735-748.
Kittelson & Associates, Parsons Brinckerhoff, KFH Group, Texas A&M Transportation Institute, & Arup. (2013). Transit capacity and quality of service manual, 3rd edition No. TCRP Report 165). Washington, D.C.: Transportation Research Board.
Lei, T. L., & Church, R. L. (2010). Mapping transit-based access: Integrating GIS, routes, and schedules. International Journal of Geographical Information Science, 24(2), 283-304.
Litman, T. (2012). Evaluating accessibility for transportation planning: Measuring people's ability to reach desired goods and activities.Victoria Transport Policy Institute.
Loudoun County. (2013). Tysons express. http://www.loudoun.gov/DocumentCenter/View/319
Mamun, S. A., Lownes, N. E., Osleeb, J. P., & Bertolaccini, K. (2013). A method to define public transit opportunity space. Journal of Transport Geography, 28, 144-154.
Matsuo, M. (2011). US metropolitan spatial structure and labor accessibility. Urban Studies, 48(11), 2283-2302.
Meyer, E. L. (2008). A shopping nexus outside Washington plots a future as an urban center. The New York Times.
http://www.nytimes.com/2008/12/17/business/17tysons.html?pagewanted=all&_r=0
Modarres, A. (2003). Polycentricity and transit service. Transportation Research Part A, 37, 841-864.
Morang, M. (2013). Add GTFS to a network dataset ESRI.
32 Murray, A. T., Davis, R., Stimson, R. J., & Ferreira, L. (1998). Public transportation access.
Transportation Research Part D, 3(5), 319-328.
Pisarski, A. E. (2006). Commuting in America III: The third national report on commuting patterns and trends. No. NCHRP 550, TCRP 110). Washington, D.C.: Transportation Research Board.
Polzin, S. E., Pendyala, R. M., & Navari, S. (2002). Development of time-of-day-based transit accessibility analysis tool. Transportation Research Record, 1799, 35-41.
Schoon, J. G., McDonald, M., & Lee, A. (1999). Accessibility indices: Pilot study and potential use in strategic planning. Transportation Research Record, 1685, 29-38.
Schrag, Z. M. (2006). The great society subway: A history of the Washington metro. Baltimore: Johns Hopkins University Press. Retrieved from
http://www.loc.gov/catdir/toc/ecip0512/2005012141.html
Thompson, G., Brown, J., & Bhattacharya, T. (2012). What really matters for increasing transit ridership: Understanding the determinants of transit ridership demand in Broward County, Florida. Urban Studies, 49(15), 3327-3345.
Tomer, A. (2012). Where the jobs are: Employer access to labor by transit. Washington, D.C.: Metropolitan Policy Program at Brookings.
http://www.brookings.edu/~/media/research/files/papers/2012/7/transit%20labor%20tomer/ 11%20transit%20labor%20tomer%20full%20paper.pdf
U.S. Census Bureau. (2010). 2010 Decennial Census. Washington, D.C.: U.S. Census Bureau. Accessed from http://www.socialexplorer.com/
U.S. Census Bureau. (2013). 2008-2012 American Community Survey. Washington, D.C.: U.S. Census Bureau. Accessed from http://www.socialexplorer.com/
Wachs, M., & Kumagai, T. G. (1973). Physical accessibility as a social indicator. Socio-Economic Planning Science, 7, 437-456.
WMATA. (2013a). Developer resources. Washington, D.C. https://www.wmata.com/rider_tools/developer_resources.cfm
WMATA. (2013b). What will the travel times be on the silver line?
http://planitmetro.com/2013/09/20/what-will-the-travel-times-be-on-the-silver-line/