Gregory E. Lawson, Mobile Device Interfaces: The Almighty App vs The Web Browser. A Master’s Paper for the M.S. in I.S degree. April, 2014. 70 pages. Advisor: Bradley M. Hemminger
Recent research indicates that users prefer downloadable native applications over mobile web applications. Therefore, many would say that creating a native application is the way to reach the largest number of users in the given mobile device market. The purpose of this study is to confirm that even though, for some information needs, a native application is the best option; information needs do exist to create necessity for mobile web
applications. To show this, I have created, implemented and analyzed a survey to ask respondents about their mobile device usage. The study will serve to show that not only are native applications necessary in the future, but mobile web applications also play a vital role in the future of mobile device usage.
Headings:
Mobile Device Applications
Mobile Computing
Mobile Device Application Development
MOBILE DEVICE INTERFACES:
THE ALMIGHTY APP VS THE WEB BROWSER
By:
Gregory E. Lawson
A Master’s paper submitted to the faculty of the School of Information and Library Science of the University of North Carolina at Chapel Hill
in partial fulfillment of the requirements for the degree of Master of Science in
Information Science.
Chapel Hill, North Carolina
April 2014
Approved by
_______________________________________
Table of Contents
INTRODUCTION 2
LITERATURE REVIEW 4
METHODOLOGY 8
Mobile Device Study 9
Survey Questions 10
LIMITATIONS 15
RESULTS 16
ANALYSIS 23
Age 23
Gender 29
Education 32
Preferences 34
CONCLUSIONS 47
BIBLIOGRAPHY 49
APPENDIX A: SURVEY EMAIL 51
APPENDIX B: PAPER SURVEY 52
APPENDIX C: ELECTRONIC SURVEY 58
Introduction
The mobile device market is arguably one of the largest information driven
markets of this past decade. The advances in the mobile device industry over the past
years have tied many consumers closer to their devices. Not only have the devices
themselves improved immensely, but the software that powers them has as well. Today,
users can check their bank account, read the news, play games, and utilize social media
all on the same device. Users have the ability to do just about everything on a mobile
device that they can on a full desktop or laptop computer. These rapid advances in
mobile device technology have changed the way users will get information from their
devices forever. Users can be very particular about how they get information on their
mobile devices. Some would rather use a downloadable application, while others would
prefer to use their devices mobile web browser to obtain information. In the past, the
mobile device industry has dictated how users could utilize their devices for certain tasks.
However, now the industry has found that users are dictating how developers should
create mobile applications. Advances in information technology such as HTML 5 have
split the market for software development up into two major groups: those who create
mobile applications using HTML 5 compliant mobile web applications and those who
create native downloadable applications. In short, most developers would rather create
one mobile web application that costs less to create, is easier to make using HTML 5
engine optimization instead of creating several iterations of the same native application
for each different major mobile device platform. This may work for some mobile device
applications; however there is no guarantee that consumers will utilize it. The problem
lies in how users utilize a given mobile device application. Deciding on which to create
mainly depends on the opinions of the users. Most users may trust downloadable native
applications more for some tasks over mobile web applications. While for other tasks,
users may want increased functionality that comes with mobile web applications. As an
example, some users may trust the reliability of native downloadable applications for
tasks such as banking and anything that may need to be done securely while users may
use mobile web applications for searches and tasks where getting multiple different
results is necessary. Research indicates that users prefer downloadable native
applications over mobile web applications, however, both play a role in the future
depending on the user’s specific information needs. This study shows how users utilize
downloadable native applications and mobile web applications as well as when they
prefer to use one over the other. But first, it may be advantageous to go over the strengths
Literature Review
There is significant research available discussing the pros and cons of both
native mobile applications and mobile web applications. Native applications are
applications that are downloaded onto a user’s mobile device through an application store
and are local only to the user’s device. They can only be made for each specific platform
and do not have cross platform compatibility. (Budiu, 2013) Native mobile applications
have some distinct advantages over mobile web applications. Some of these distinct
advantages are that native apps can fully exploit the hardware and user interface of a
user’s specific mobile device. Basically, native mobile applications can directly access
nearly all device hardware such as cameras and sensors as well as directly access
operating system software such as GPS. (Borg, 2013) Also, native applications are
mostly localized applications that have access to local storage space. The ability of
native applications to access local storage means that they have the potential to be faster
because they don’t have to access the internet one hundred percent (100%) of the time
and they can also move more data around within the local file system quicker. (Borg,
2013) Another factor includes the ability for native mobile applications to be used when
there is no internet connection. Because native mobile apps are stored in the local file
system they can be accessed by the user at any time. (Lionbridge) Ease of use is also one
of the large advantages to native mobile applications. Because native mobile applications
devices “application list screen” for daily visibility. (Lionbridge) Lastly, native
applications have the ability to send notifications to the user about updates, news, or
pertinent information about the application. These features give native mobile
applications a leg up against mobile web applications. However, mobile web
applications also have their own set of unique strengths.
Mobile web applications are applications that are formatted for smartphones and
tablets and are accessed through the mobile devices web browser. (Lionbridge) The
difference between native mobile applications and mobile web applications is that instead
of using a programming language such as Java or Objective C, mobile web applications
are created using HTML, CSS and usually JavaScript. (Lionbridge) The main advantage
that mobile web applications have over mobile native applications is that they are
cross-platform compatible. In other words, you can access the exact same mobile web
application through many different mobile devices even when the devices run different
operating systems. Companies would like for users to utilize mobile web applications
because the company would only have to create one application for all platforms instead
of multiple different iterations of the same application to run on different devices. This
makes mobile web applications powerful yet also takes away key functionalities that
native mobile applications use daily. Because only one application needs to be developed,
development costs are lower. It boils down to the cost of creating several versions of the
same application or only creating one version. Development costs are usually related to
the amount of labor it takes to get a mobile application completely functional. More labor
equals higher cost. Mobile web applications are easier to maintain as well. This relates
platform optimization, mobile web applications can be easier to access than native mobile
applications if you think about them in a different way. They do not require
downloading, one just simply access the URL on their mobile browser to find the correct
application. Mobile web applications can also utilize SEO or search engine optimization.
Search engine optimization can be utilized to increase a mobile web applications
visibility in the market. Because native apps are local environments, they cannot be seen
by search engines and they will not impact the ranking of a search. (O’Dell, 2013)
Mobile web applications do not have this problem because they are inherently on the
internet and therefore can be searched through. In the past, business have been able to
dictate the way users find and user their applications, however, because of market
saturation, users dictate how businesses need to create mobile applications. Because of
this, native mobile applications are winning the battle over mobile web applications.
Most of the research analysis in this field tends to suggest users prefer the use of
native mobile applications. There has been a large amount of analysis done on whether
people use native mobile applications or mobile web applications. Flurry, a major
application analytics firm that tracks applications usage of roughly 300,000 apps over
billion devices, has studied the usage between native mobile apps and the web apps on
the browser. Flurry states that we spend, on average, 158 minutes each day using our
mobile devices. Of that 158 minutes more than two hours is spent in native applications.
This means that roughly thirty minutes is spent using our mobile devices browser. Most
of the difference between usages of native apps versus mobile web apps relates to game
usage. Games account for thirty two percent (32%) of the usage of native apps while
six percent (6%) according to Furry. (Koetsier, 2013) Other studies conclude the same,
with native mobile applications pushing ahead of mobile web applications. A study done
by Yahoo and Ipsos in 2011 shows that consumers, to perform some functions, would
rather use native mobile applications. Shopping, searching and entertaining were all best
done using native apps while connecting, navigating and informing were best suited for
the mobile web. But in this field 2011 is ancient history. (Cavazza, 2011) A more recent
survey conducted by Compuware shows that nearly eighty five percent (85%) of
consumers favor apps over mobile websites for several different reasons. (Marcheider,
2013) These reasons boil down to speed, ease of use and convenience. (Marcheider,
2013) Understanding these reasons is paramount for businesses trying to decide which
applications to build. One cannot build an application meant to reach the largest number
of users without knowing exactly what the users use and why. There is not enough
research about “why” people decide native mobile applications over web applications and
Methodology
Mobile users are very particular in how they use their mobile devices. With such a
large saturation of content in the applications market, users are able to pick and choose
what they use and how they use it. Because of this, businesses are finding that they need
to cater more to the users of specific applications. It is no longer about trying to get users
to come to you but instead it has become trying to find your users. Creating an
application that best suits your user’s information needs is paramount in today’s ever
growing industry for mobile device applications. Research indicates users prefer
downloadable native applications over mobile web applications however, both play a role
in the future depending on the users specific information needs.
While there has been some analysis on whether people use native mobile
applications or mobile web applications, there has been little research done on why
people use what they use. Businesses trying to decide on whether to create a native
mobile application or a mobile web application don’t only need to know which one users
utilize the most, but also need to know why people use what they do. Clarifying for
businesses why people use what they do can help the businesses decide what to create
and how to create it. The preference of the user should help determine how the business
should create the application, whether it is a mobile web application or a native mobile
mobile application is not an easy task however. To make a decision for or against either
can be very difficult. The users need to be studied as well as why the users use what they
use. The best way to know exactly how users decide between using a mobile web
application or a native mobile application is to interview and ask users. This study was
designed to help better understand why people use what they do to find different forms of
information.
Mobile Device Study
To find out more about how users find information on their mobile devices I
decided to complete a study. The initial portion of the study consisted of a survey. This
survey was created for the sole purpose of understanding user’s habits when using their
mobile devices. For specific information needs, do users prefer to utilize mobile web
applications or do they prefer native mobile applications and why? The survey was
advertised by email and by randomly passed out paper copies. About 50% of the surveys
that were returned were electronic mail surveys, the other 50% were paper copies. Copies
of both the paper survey and electronic survey can be found in both Appendix B and
Appendix C. Surveys were disseminated over email and participants were asked if they
would send copies to friends and family to solicit them to participate. The email that was
sent out can also be found in the Appendix A. The paper copies were randomly
distributed to people in Charlotte NC, Raleigh NC and Chapel Hill NC. In all, around
120 people ended up turning the survey back in. The emails were anonymous and
discarded once the surveys were saved with coded identifiers to protect the individual’s
identities. To get information about different groups of people, the study had several
Survey Questions
Three types of questions were used in the survey: preliminary questions, general
usage questions and specific usage questions. The preliminary questions allowed the
survey to get information about the respondents who use mobile devices. The first
preliminary question was about the participant’s age. Age was binned into four separate
categories. Breaking age into four intervals allowed for sufficient data in each interval to
support statistical analysis, while maintaining sufficient granularity to answer the desired
questions. The first interval was comprised of individuals ages 18-25, and they
represented a younger group of usually very technically savvy individuals. This group is
usually defined by their heavy use of mobile devices and their willingness to adopt new
technology. The second group was individuals ages 25-35. This group represented the
new working force. They use their mobile devices mainly for business purposes. They
are special in that they are the first generation to own smart mobile devices before
entering the workforce. This means that they helped define how people use applications
for work related issues. The third group is comprised of individuals 35-45 years old. This
group is special as well as they were in the work place before owning any smart mobile
devices, and therefore mobile applications are used differently by them. In general,
non-dependent on their work, they still use mobile devices differently than the younger
generations. The last group represents our oldest age group. This group is comprised of
individuals 45-60 year old. I increased the difference in ages by five years here because
older individuals are less likely to use smart mobile devices and I needed to broaden the
age group to get relevant results. This did not affect the study in any way. Breaking the
mobile web application or native mobile applications. Being able to break the groups up
by gender may also help explain users habits about how information is gathered from a
mobile device and whether they use mobile web applications or mobile native
applications. Once questions about gender and age are answered, the survey will ask
about the user’s highest level of education. It is important to note that mobile use and
technology adoption are not only affected by age, but also by the user’s education level.
The question to ask here is, will a user’s education push them towards or away from
using mobile devices technologies, whether it is a native mobile application or a mobile
web application. The user’s ability to access the internet was also asked. Without the use
of internet, depending on the mobile device a user may own, there may be more or less
functionality. Being able to show that users with ample access to the internet were either
more or less likely to use the mobile device, and therefore, utilize mobile web
applications or mobile native applications was an important part of this survey. Even
when most mobile devices have built-in internet, it is still pertinent to ask about access to
the internet because it may be possible for people to use their devices differently
depending on the way they have grown accustomed to using or not using the internet
frequently. Users were also asked about their perceived proficiency with their mobile
devices. A perceived proficiency is important to this study because this study wants to
know how people rank themselves using their devices and what people of each perceived
ranking use to acquire information from their mobile devices. I also asked a generalized
question about whether the person being surveyed would rather use a mobile web based
application or a native mobile application. This will help me to get a broad perspective
General usage questions allowed me to get a feel for respondents overall usage of
their mobile devices. Half of the general usage questions asked respondents about how
much time per day they spend using devices. These questions also included the amount
of downloaded apps the respondents had on their mobile devices. The next questions
were about more specific general usage including one question about the amount of time
each respondent took each day using downloaded mobile native applications. The
respondents were then asked about the amount of time each day they spend using mobile
web applications. The next questions were based more on the different types of activities
respondents do on their mobile devices. For each of these questions, respondents were
given ten different types of activities that they may do on their mobile devices. These
activities included: Shopping, Banking, Travel, Food, Searching, News, Entertainment,
Games, Weather, and Other. The “Other” category gave the respondents the opportunity
to write in different activities that weren’t offered. The questions that were asked about
these activities were about the types of downloadable apps respondents have on their
mobile device as well as the types of websites they browse to on their mobile devices
browser. Also, usage questions were asked about the types of apps and websites people
use in a typical week. These usage questions are important so we can further understand
how respondents use their mobile devices for different activities and finding different
information.
Specific usage questions were also asked. These specific questions will help me
with user preference between downloaded native applications and mobile web
applications. This is particularly important because users may prefer something different
questions. For the activities described in the general usage section, we asked people to
choose whether they would prefer to use a downloaded native application or a mobile
web application through the browser. Once the respondents chose, they were asked why
they chose what they did. They were given different reasons why they chose what they
did including: Security/Trust, Quick access, Ease of Information Searching, Ease of use,
Increased Functionality, Content, and of course Other to give the respondents a chance to
come up with their own reasoning. These questions were quite possibly the most
important questions in the survey. This is because these personal preferences are based
on each respondent’s assumed needs. These assumed needs may be different from the
way they actually use their existing mobile device. This is where my belief stems from
that businesses may create mobile device native applications and web applications
differently than their user group wants them to be made. This mobile device survey has
allowed me to do an analysis of how different user groups use their mobile device given
the current climate around mobile native applications and mobile web applications. It
will also allow me to analyze how different user groups would prefer to use their mobile
devices via mobile web applications and mobile native applications. This analysis could
be very important to the mobile device application and web industry by explaining how
users would like to use their mobile devices. It is important to note that while I discuss
the results and analysis, instead of using the term mobile web application, I will use the
term mobile browser. This is purely because my survey asked questions about the mobile
browser so that respondents would know what I was asking. If I asked about mobile web
applications they may not know what I was talking about. Also, the mobile web browser
this study. Before I get into the results and analysis however, I will go into some
Limitations
There were a few very important limitations to the study. For instance, I chose
not to include users over the age of 60 years. Studies have shown that there are large
barriers that exclude this age group from the mobile device network. Even if some
businesses are trying to create mobile web applications or mobile native applications for
that demographic, there are too few of them who use newer mobile devices to come up
with accurate statistics. Quite simply put, the technology was not around when they were
young enough to adopt it. Therefore, for my study, finding enough people over the age
of 60 to take the survey and participate in the study would have been a real issue. As a
generalization, most people over the age of sixty just don’t use smart mobile devices that
allow for both web browsing and native mobile applications. The collection of data was
the real issue here. While there is a fair amount of data on use of mobile devices by the
elderly, that consideration is outside of the scope of my study. Another limitation
may be educational level. I was not able to get a very broad range of respondents with
different educational levels. Because of this, my analysis on respondents of different
educational levels may not be the most in depth. However, I will try to analyze the
groupings as much as possible. There were also limitations based on respondents
self-reporting estimations of usage as opposed to actually counting as well as their different
perceptions in understanding differences between mobile native apps and their mobile
Results
Once the data was collected it was statistically analyzed. Using Excel statistical
software, I was able to calculate the raw data results from the survey to come up with
figures about the respondents in the survey. In total, the survey was completed by 120
respondents. To begin, out of the 120 respondents, only 2.5% did not own a smart mobile
device. The age distribution of the respondents was fairly even. The largest group of
respondents was between the ages of eighteen and twenty-five consisting of 32.5% of the
total respondents. To continue with age groupings; 25% of the respondents were 45-60,
21.6% were 35-45 and 20.8% were 25-35. This pool of ages is fairly even as most of the
surveyed people were random or family and friends. With 56.6% of the respondents
being male and 43.3% of the respondents being female, the pool of males’ vs females
was also fairly even. When it comes to the educational level, however, my survey did not
reach all of the groups evenly. For instance, the group of respondents who never
graduated high school was only 1.6% large, while the group of respondents who
graduated from a four year college was 47.5%. At nearly fifty seven total respondents in
the four year degree category, this group represents nearly half of all the respondents.
The rest of the groupings fields are represented by high school graduates with 25 %,
graduate program graduates with 20%, and two year college graduates with 5.83% of the
total respondents. These uneven groupings of respondents may create a limitation during
access and proficiency proved to be not much different than educational level when it
came to the evenness of the respondent’s answers. However, in today’s information age,
these may not be bad things in general. The number of people who say that they always
have access to the internet was 112, meaning that 93.33% of respondents always have
access to internet. On the opposite end of the spectrum, 5% and 1.6% respectively say
that they have only internet at home or on their mobile device. To finish off the internet
access category, no one said that they have no internet. As stated above, proficiency
brings some of the same distributions as results, however with a slightly more even ratio
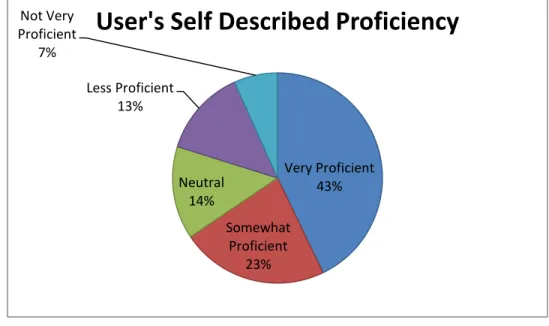
as shown in Figure 1. With nearly half of the respondents stating that they are very
proficient and
Figure 1- Users Self Described Proficiency
only 7% of them saying they are not very proficient there is still a fairly large gap
between those who are very proficient and not very proficient. However, this gap is
softened by the other three fields within this grouping. With 23%, 14% and 13% being
Very Proficient 43% Somewhat
Proficient 23% Neutral
14% Less Proficient
13% Not Very
Proficient 7%
“Somewhat Proficient”, “Neutral”, and “Less Proficient” respectively, there is still a
somewhat even distribution.
When asked about personal preferences about whether users would rather use
their browser or a downloaded app, users would actually in general prefer to use their
mobile devices browser. Out of the respondents surveyed, 54% said they would rather
use their devices browser while only 46% say they would rather use a download
application. To continue with general usage questions, when asked about the amount of
time spent per day on their mobile device, the majority of respondents are represented by
1-2 hours and 3-4 hours. Combined, these two categories make up 62% of the entire
group at 1-2 hours having 29.4% and 3-4 hours having 32.7%. Once these two have been
seen, the other four fields are all fairly equal with <1 hour having only 6%, 5-6 hours
having 7%, >6 having only 10% and 4-5 hours having 12%.
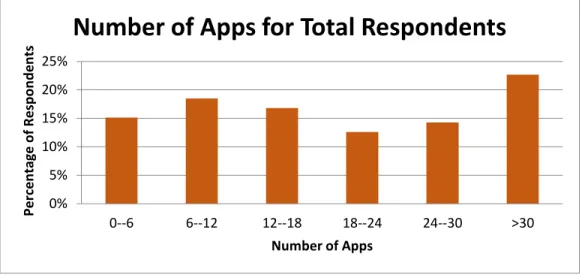
Figure 2- Number of apps by grouping of survey set
The amount of apps respondents had on their mobile devices differed greatly.
The largest amount of the respondents had more than 30 apps on their mobile devices
0% 5% 10% 15% 20% 25%
0--6 6--12 12--18 18--24 24--30 >30
Per ce n tage o f R e sp o n d e n ts
Number of Apps
with 22.6%. The other five groups were all within 7 respondents of each other as shown
in Figure 2.
To continue with more general usage data, 36.9% of respondents used
downloaded application less than one hour per day. The majority in the amount of time
spend on apps per day is 1-2 hours with 46.2% of the respondents. From there the
numbers drop to 14% for 3-4 hours per day, .8% for 4-5 hours per day, and 1.6% for
more than 6 hours per day. On the opposite side, the browser got used less than one hour
per day by 54.6% of respondents. This represents a slight difference between the amount
of time people spend on native apps versus the web browser. Respectively, 37.8% of
respondents used their web browser 1-2 hours per day, while those using their browser
3-4 hours, 3-4-5 hours, 5-6 hours, and more than 6 hours combined for only 8% of
respondents.
Now to move on to the types of apps and websites that respondents use to find
information as well as the types of apps and websites respondents use on a weekly basis.
The types of apps that respondents have on their mobile device are shown in Figure 3.
The graph depicts the percentage of respondents by the types of apps they have.
Figure 3- Types of Downloaded Applications by Percentage of Respondents
45.8% 56.7% 46.7% 44.2% 42.5% 65.8% 61.7% 69.2% 83.3% 27.5%
The types of websites that respondents browsed to on their mobile device are
shown in Figure 4. The graph depicts the percentage of respondents who choose each of
the different types of websites.
Figure 4- Types of Websites Browsed to by Percentage of Respondents
The types of downloaded apps used most often in a week are shown in Figure 5.
The graph depicts the percentage of respondents who use each of the different types of
downloaded applications.
Figure 5- Types of Downloaded Applications Used Most Often by Percentage of Respondents
41.7% 23.3% 33.3% 40.0% 75.8% 56.7% 34.2%
4.2% 28.3% 14.2%
Types of Websites Browsed to by
Percentage of Respondents
16.7% 32.5% 19.2% 19.2% 32.5% 51.7% 33.3% 33.3%
64.2%
18.3%
Types of Downloaded Applications
Used Most Often by Percentage of
The types of websites that respondents used most often in a week are shown in
Figure 6. The graph depicts the percentage of respondents who browse to each of the
different types of websites.
Figure 6- Types of Websites Used Most Often by Percentage of Respondents
To finish the results, I will present some of the user preferences that respondents
gave for different types of information needs. The bulk of the results for this section,
mainly the reasons for choosing between downloaded mobile applications and mobile
web browsing, are in Appendix D. I will only skim the surface of this section for now
and most of it will come back up later in the analysis.
The survey shows us that for shopping on mobile devices, apps were preferred by
42.2% of respondents, meaning that respondents picked using the devices mobile browser
57.7% of the time. The survey also shows that for banking, 73.3% of respondents prefer
using mobile native applications over the use of their mobile devices browser which only
got 26.6% of respondent’s votes. The next category, travel, received a fairly even
distribution with 53.5% of respondents preferring mobile web applications as opposed to
23.3% 15.0% 10.8% 20.8%
63.3%
38.3%
20.8% 5.8% 25.8% 11.7%
the use of mobile native applications, which received a close 46.4% of the votes.
Searching however, was a different story, with 81.7% of the respondents saying that they
would rather user their devices mobile web browser to search than use a mobile native
application. The next category is the respondent’s preference about how they access their
news. Out of both mobile native applications and mobile web applications and browser,
respondents preferred the use of mobile native applications 61.4 % of the time as opposed
to 38.5% for the mobile devices web browser. For the Entertainment category, 60% of
respondents preferred to access their entertainment through a mobile native application
whereas 40% of the respondents preferred the use of their mobile devices browser.
Gaming was not such a close comparison however, with nearly 86% of respondents
preferring to use a mobile native application for gaming rather than playing games on
their devices mobile browser via a mobile web application. Lastly, for the weather
category, 86% of respondents said that they would rather get their weather from a mobile
native application than a mobile web application via the browser. Subsequently, the
mobile browser only got 14% in this category.
Now that the results have been presented in a way that is readable, analysis of the
survey is imperative. The analysis will serve to find and show comparisons and
correlations in the data. These correlations may help businesses create whichever mobile
Analysis
The main question I want to answer with this study is why users use a particular
mobile application to reach their specific information need. To find this, first I have to
figure out which groups use which applications to fulfill specific information needs.
Analyzing the data will help me find correlations in the data as they pertain to what
people use, how they use it, and why they use what they do, whether they use mobile web
applications or native mobile applications. Some of the more independent variables are
the person’s age, gender and education level. To sum this idea up, depending on a user’s
age, gender or educational level, they may tend to use either native mobile applications or
mobile web applications. Finding correlations between these variables and the rest of the
data will help me truly get an understanding of whether or not a person’s age, sex or
educational level play a role in how they fulfill a specific information need.
Age
Age is expected to be a key factor in how people use their mobile devices. , some
of the older age groups may not utilize their devices the same way that some of the
younger age groups would. This is an analysis to find out if there are any correlations
between age and the way users act with their mobile devices as well as what they prefer
to use. The 18-25 year old age group is the youngest group from my survey. However,
because they are young and live in the information age, they are usually the first ones to
greatest understanding of mobile devices. Of the thirty-nine 18-25 year olds surveyed,
64% of them believe that they are very proficient with the use of mobile devices. This
group makes up nearly half of the total number of respondents that said that they are very
proficient with their mobile devices. When asked whether they prefer to use their devices
mobile browser or apps, 60% said that they would rather use their devices mobile web
browser to access information. They do however fall in line with the number of hours
per day that they use their mobile devices with the highest number of respondents saying
that they use their devices 3-4 hours per day. They are also in line with other survey
respondents in how many apps they own and how much time they use their apps. The
first real difference that was seen between 18-25 year olds and the rest of the total survey
respondents was the lack of travel apps. This is predominantly because younger people
between the ages of 18-25 may tend to travel significantly less. Therefore, they do not
need the native mobile applications to travel. Only 25.6% of respondents 18-25 even
have travel apps, whereas, nearly 47% of the total respondents have travel apps.
However, there was no discrepancy with the results of the 18-25 year old respondents
who use their browser for travel. This may be because when a browser is used, traveling
may just be in the preliminary stages, and a native mobile application may be used to
finish finalizing the travel process.
Now we get to user preferences for 18-25 year olds. There were several different
preferences by 18-25 year olds that were not shown in the results set as a whole. There
was almost a 10% difference in how 18-25 year olds prefer to access games.
Respondents who were 18-25 responded that they would rather use a native application to
tie to the way young adults have grown up playing games on their mobile devices. Some
of the main differences were in the categories of quick access, ease of use, and increased
functionality. Those 18-25 year olds found that quick access, ease of use and increased
functionality were all very important reasons behind why they would rather use a mobile
native application over a mobile web application. Weather also presented a prominent
difference. Out of 18-25 year olds, 78% of them would rather use a mobile native
application than a mobile web application whereas the entire group would rather use a
mobile native application 96% of the time.
The 25- 35 year old age group is the second group I will discuss. The 25-35 year
old age group represents one of the first groups to hit the working world having
knowledge of how modern digital information technology works. However, their
perceived proficiency is not much different than the entirety of the respondents. This
group however, has a much different perspective on using their mobile web browser
versus mobile native applications. This study finds that only 44% of respondents
between the ages of 25-35 would rather use their device’s browser, while 54% of the total
group would rather use their browser. There was also a difference in the number of apps
that 25-35 year olds have on their mobile devices. More respondents in the 25-35 year
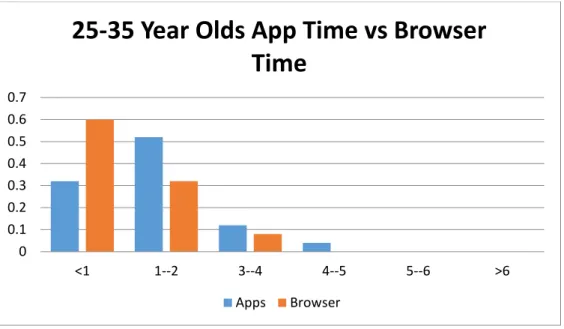
old age category had on average 10 apps more than the total group. Also, adults between
the ages of 25-35 spend more time in apps than they did using their devices mobile
Figure 7- App Time vs. Browser Time 25-35 age group
The types of mobile applications used also differed dramatically between adults
aged 25-35 and the rest of the survey respondents. There was a 6% increase in the
number of shopping apps for 25-35 year olds as well as a 16% increase in the number of
banking apps. You could conclude then that 25-35 year olds are more likely to do their
shopping and banking on a mobile native app than the rest of the group.
The preferences between mobile native applications and mobile web applications
are also different between the 25-35 year olds and the rest of the age groups. For
shopping, this age group would rather use apps 8% more than the total of all the age
groups, which tends to correlate with the increased number of shopping apps discussed
previously. Additionally, 20% more of the respondents in this category prefer mobile
native applications for a travel application than the rest of the respondents. This could
mean that while the total group only searches for travel destinations, this group may
utilize mobile applications to finalize flight reservations on mobile native applications.
0 0.1 0.2 0.3 0.4 0.5 0.6 0.7
<1 1--2 3--4 4--5 5--6 >6
25-35 Year Olds App Time vs Browser
Time
There was also a difference in the way 25-35 year olds would like to access their
entertainment. While about 60% of respondents of all age groups said they would like to
access their entertainment via mobile native applications, 25-35 year olds access their
entertainment through mobile native applications approximately 78% of the time.
The respondents ages 35-45 are the next age group that I studied. Their perceived
proficiency was much different than 18-25 year olds and the 25-35 year olds. As a group,
23% of 35-45 year olds believe themselves to be right in the middle on proficiency.
Whereas the total results show that only 14% of respondents chose a middle stance on
proficiency It was also interesting to note that this age group used their mobile devices
browser on average one hour more per day than the balance of respondents.
Figure 8- Websites most often browsed to between 35-45 year olds and the entire results set
The data shows that 35-45 year olds prefer to use their mobile device browser
more than they use mobile native applications. There is also a notable difference in the
types of websites they browsed to on their mobile devices as shown in Figure 8. The
45-60 year olds are the last age group to be analyzed. For this age group, the respondents
0.0% 20.0% 40.0% 60.0% 80.0%
Websites Most Often Browsed To
believed proficiency was right in line with the total results set. There was also very little
difference between this age group and the rest of the respondents when it came to
deciding about whether they preferred apps or their mobile browser. There was, however,
a difference between how much this age group used their browser and native applications
versus the balance of the respondents. In total, there were zero 45-60 year olds that use
mobile native applications more than 4 hours per day as well as zero that use their
browser more than 4 hours per day. One interesting differential distinguishing this age
group is that 10% more respondents in this age group use apps for news than those in the
other age groups. As for user preferences, 67% of the respondents in the 45-60 years old
category prefer to use their mobile devices browser to shop; compared to 57% of the
entire group. Once again, respondents between the ages of 45-60 would rather use an app
to receive their news. About 70% of 45-60 year olds would rather use an app than their
devices mobile web browser to get news. There was also a difference in gaming. While
all user groups preferred native apps for gaming, those respondents ages 45-60 had less
of a preference in comparison to the balance of the respondents. This is shown by the
statistic that 26% of adults aged 45-60 years would rather use their browser to game as
opposed to the only 14% of the entire group.
To conclude the analysis of the difference between certain age groups compared
to the entire grouping, there are numerous correlations between a respondent’s age and
the way they access information on their mobile device. In summary, eighteen to
twenty-five year olds are more likely to be technically proficient with their mobile devices.
Accordingly, they are more likely to prefer mobile native applications. However, they do
groups, as well as due to their income level. They also prefer the games they play to be in
mobile native application form for reasons like ease of access, quick access and the
increased functionality that come along with mobile native games. Generally,
twenty-five to thirty-twenty-five year olds prefer mobile native applications on nearly all fronts, possibly
because they like the ease of use and because of their increased ability to adapt to the
ever changing technological world. The thirty-five to forty-five year old age group is
where we start to see a correlation between respondents and their use of the mobile web
browser. The mobile web browser is how they did it when they first got into the work
place, and because of that it has carried over to the rest of their lives. They mainly use
their mobile devices for searching mostly. The respondents in the forty-five to sixty year
old category used both their mobile internet browser and their native apps less than
respondents in the other age groups. They tended to prefer the mobile browser more than
other age groups. In applications (other than news) where they preferred a native app,
they preferred it less strongly than the other age groups. Essentially, the data shows
what you would assume to be true: the younger age groups have more readily adopted the
newer technologies. This provides a correlation between age and the preference between
mobile web applications and mobile native applications.
Gender
There is always discussion about how educational level or even age may affect a
person’s technical skills or even their technical willingness, however, a person’s gender is
never brought into the equation. I will try to do this without bias. To start there is a very
different distribution between men and women and their perceived proficiency with their
34% of females see themselves as very proficient. The majority of women seem to be
closer to the neutral area when it comes to perceived proficiency. With 26% of females
and only 5% of males saying that they are a three on a scale of one to five, this is
definitely the case. There was also a fairly large difference between males and females
when it came to their preference between native mobile applications and using their web
browser. With 61% of females preferring the use of their web browser and only 49% of
males preferring use of their devices web browser. The data also shows that women
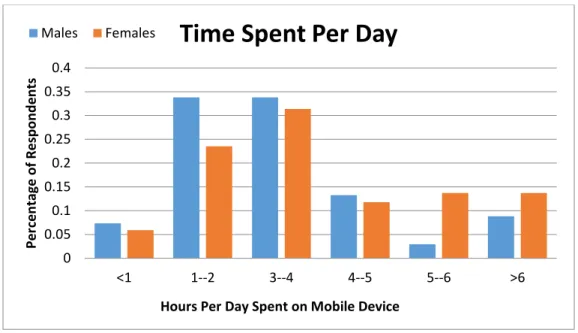
seemingly spend more time on their mobile device each day than men do. This is shown
in the Figure 9 below as women having a higher percentage in the higher hours per day
ranges.
Figure 9- Time spent per day on mobile devices.
Males also had a very different number of apps than females. While nearly 47%
of males had greater than 24 mobile native applications, women had the nearly the same
0 0.05 0.1 0.15 0.2 0.25 0.3 0.35 0.4
<1 1--2 3--4 4--5 5--6 >6
Per ce n tage o f R e sp o n d e n ts
Hours Per Day Spent on Mobile Device
Time Spent Per Day
amount, at 45%, in under 12 mobile native applications. Not only were there key
differences in the amount of time spent on mobile native applications but there were also
key difference in the types of websites between males and females. A fair comparison
for this is that only 30.8% of males responded to going to shopping sites and nearly 56%
of females responded the same way. On the other hand, 66% of men responded as using
their web browser for news while only 44% of women did.
When asked about preferences and shopping however, the answers tended to level
out. For instance, 61% of females preferred using a web browser to access information
while 55% of men preferred the same. While these numbers do even out a bit, the
reasons for accessing the information they did were very different. Approximately 51%
of women decided to use their browser to access shopping because of quick access.
While 51% of men decided to use their browser to shop because of ease of use.
Preferences about entertainment access also differed greatly. Nearly 68% of
women responded by saying that they would rather use mobile native applications 69%
of the time leaving the browsing statistic at only 31%. However, men said that they
would rather access their entertainment via mobile native applications 53% of the time.
This means that there is a 16% difference in the way males and females would like to
access their entertainment through their mobile devices.
Gaming also saw a fairly dramatic difference of 10% in the way males and
females access their information. Females responded that they would like to access their
mobile device’s games via mobile native applications a whopping 91.4% of the time.
Males said that only 81% of the time they would like to access their games via mobile
Men and women access very different kinds of information through their mobile
device. Men access their devices less, but they still have many more mobile native
applications than women do. While men do not tend to use their mobile devices for
shopping, they do access it for more utilitarian needs in some cases. These findings have
shown that not only men and women access very different kinds of information, but they
also access information in very different ways. There is definitely a correlation in the
different ways that men and women access their information.
Education
To begin, I did not get a very even distribution of the different educational levels;
therefore it will be very hard to describe the differences among them. Because only 1%
of respondents had less than a high school diploma and only 5% of respondents had a 2
year degree, leaving the other 94% to the other three categories, for this analysis I will
discard respondents who had both two year degrees and less than a high school diploma.
As far as proficiency is concerned, there was an actual correlation between the
respondent’s educational level and their perceived proficiency with their mobile devices.
For instance, in the somewhat proficient category, high school graduates answered that
they were somewhat proficient about 17% of the time, while respondents with a four year
degree responded with somewhat proficient about 21% of the time. Climbing up this
ladder, respondents with graduate level degrees responded by saying they were somewhat
proficient about 33% of the time. This is a correlation between different educational
levels and how proficient they perceive themselves.
There was also a fairly unexpected difference in the general amount of time
native applications or their mobile web browser. The amount of time spent started out in
the middle for high school graduates in the less than one hour category; at 40% then
dropped 5% for four year graduates. Then a 10% uptick was recorded for Graduate
students in the less than one hour category. This is only one example, however. The
results set shows that this fluctuation is apparent in all six answer choices of time spent.
There were other very obvious differences between the types of apps that were
used most often by all three educational levels that I analyzed. For instance, gaming was
accessed much less often by the graduate study educational level, by a total differential of
25%. While the graduate level identified only 25% for gaming, the respondents with a
four year degree answered 34% for gaming and the high school level responded with
37% for gaming. This could simply be because the higher the educational level, the less
time respondents utilize games. However, this went the opposite way for apps used for
shopping in that about 25% of grad students use apps for shopping most often and four
year students and high school students only use apps for shopping 19% and 10 %
respectively. There were also declines in the websites used most often in the food
category and the news category as we moved from high school to four year degrees and
then to graduate level educations. This more than likely means that graduate level
graduates do not have the time to visit the same types of websites that the other
educational levels are able to. It also probably indicates the different interests between
respondents at the different educational categories.
Preferences between mobile native applications and mobile web applications also
differed between the three educational levels. The use of the mobile browser went down
graduate level degrees all the way from 60% for high school degree respondents to 47%
of graduate level respondents. Banking however did not change at all even though I
thought it would have changed dramatically. I would have expected a person’s
educational level define how they manage their money. Travel did however note a
difference. High school graduates don’t use apps for travel as much, whereas four year
degree graduates and graduate degrees both use native applications to travel around 50%
of the time. There was a noticeable difference in Searching as well; graduate level
respondents use their browser to search about 20% more than the other educational
categories.
There are definitely correlations between respondent’s educational level and the
way they use their mobile devices. Generally, the higher the level of the education of the
respondent, the more proficient on their mobile device they considered themselves. Also,
the higher the level of education the more a person generally preferred apps over the
internet browser. More specifically, graduate students games less but shopped more. But
they also search using their mobile device more often. Most of these results one might
expect due to educational level, but the data verified the results.
Preferences
It is my belief that not only do age, sex and education all play a role in defining
how users get information from their mobile device, but also that the reasons for using
mobile web applications and mobile native application drive the user to use one or the
other. Each user has a different mindset about how they want to get their information and
used either their devices web browser or a mobile native application to access their
information.
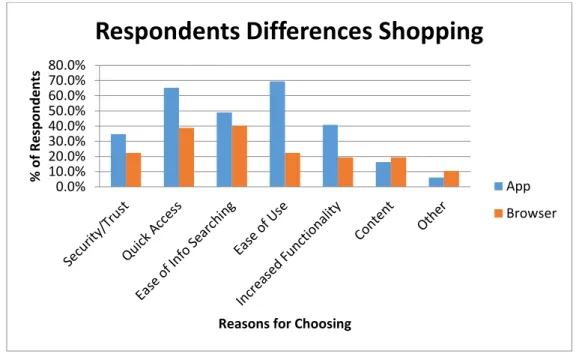
Shopping is first in the user preferences section; therefore I will analyze it first.
To begin this section, the reasons respondents used either mobile native applications or
their mobile browsers were all very different. Twelve percent of respondents felt using
an app was more secure than using a browser. The ability to access information quickly
was also a key note. Of those who accessed shopping through their browser, only 38.8%
responded that using their devices browser was quicker than using a mobile native
application. This represents a 26% difference from the 65% of respondents who found
that using a mobile native application was quicker. Also ease of information searching
was different in that respondents claimed that 49% of the time, using an app was easier to
search for information than a mobile browser when shopping. Ease of use also posed a
large problem for the mobile web browser while shopping. Where mobile native
applications got nearly 70%, the mobile browser got only 22%. This represents a
difference of 48%. Increased functionality also prevailed for the mobile native
applications with 41% over the mobile browsers 19%. The only two reasons where the
browser surpassed the native app were the content of the information being accessed and
the category for other. In other words, when looking for different types of content, users
preferred to use their devices web browser to shop, this is probably because of increase
the ability to query anything on the web instead of anything just within a given mobile
Figure 10 – The difference in respondents who chose Apps and those who chose the Browser.
This figure shows that for business creating either a mobile native application or
a web application, if the businesses sole care is the variability of content, then they
should create a mobile web application because it may get to the customer easier. This is
probably why most shopping businesses have applications that only supplement their web
sites, because if users cannot find the correct content by searching, they may not buy
from a business.
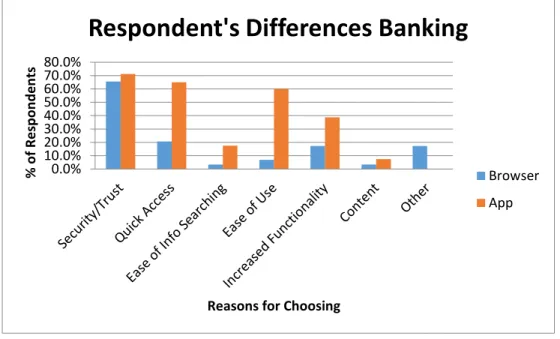
Banking is next on the list. To start, I will state once again that banking with
mobile native applications had 73% of the respondent’s votes while only 27% of the
votes were cast to the use of the mobile browser. Because of this, the reasons behind why
respondents chose the way they did, varied greatly. For instance, 71% of respondents
chose mobile native applications for banking for security or trust reasons, whereas only
65% of respondents chose their devices browser for banking for the same reason. There
is a 6% difference in security and trust based on the different ways users accessed their
0.0% 10.0% 20.0% 30.0% 40.0% 50.0% 60.0% 70.0% 80.0% % o f R e sp o n d e n ts
Reasons for Choosing
Respondents Differences Shopping
banking. A very large difference was in the quick access field. Of the respondents, 65%
said that they would rather use an app to bank because of quicker access while only 20%
said they would rather use their devices mobile browser. Ease of information searching
also had a 14% advantage for the percentage of respondents who would rather use a
mobile native application. One of the main benefit respondents said was that ease of use
increased for banking with a mobile native application. This was a dramatic difference
shown in the statistics. A significant 60% of respondents said that ease of use was a
prime quality when accessing their banking via mobile native applications. On the
opposite end, only 6.8% of respondents said that ease of use was a valuable reason for
using their devices browser. This represents a 53% difference in the reasoning behind
respondents wanting to use a mobile native application over their devices web browser.
Figure 11 shows the similarities and difference of respondents who chose mobile native
applications and their devices mobile browser.
Figure 11 - The difference in respondents who chose Apps and those who chose the Browser.
0.0% 10.0% 20.0% 30.0% 40.0% 50.0% 60.0% 70.0% 80.0% % o f R e sp o n d e n ts
Reasons for Choosing
Respondent's Differences Banking
All in all, the only place the browser was preferred was in the “Other” category.
However, this was mainly because some of the respondent’s banks did not have a mobile
native application for banking. For banks trying to decide whether to create a mobile
native application or a mobile web application, the former is preferred.
Next comes travel, in total, the browser was preferred in this category with 53.5%
of respondents saying that they would rather user a browser for travel purposes.
However, the reasons for choosing one over the other were fairly even, with respondents
feeling more strongly about the reasons for using mobile native applications for travel.
Only 6% of respondents claimed that they would rather use a mobile web application to
access travel information because of security and trust reasons compared to 16% for
mobile native applications. Of the respondents, 54% of the time quick access was picked
for mobile native applications over the use of a browser. One of the main categories
where the browser was preferred in travel was for the ease of information searching,
which ended up being around 44% of users who prefer mobile web browsers. Mobile
native applications were also picked by respondents because of ease of use nearly 64% of
the time. The rest of the categories, such as increased functionality, content and other
were all less than 5% apart from each other. Figure 12 shows the differences in reasoning
between those who picked mobile native applications and those who picked the devices
Figure 12 - The difference in respondents who chose Apps and those who chose the Browser.
Searching is the next category. In total, respondents decided by a landslide that
they prefer to use their mobile devices browser to search the internet on their mobile
devices. However, it seems as if they don’t know why they chose what they did. This is
mainly because the statistical reasons that respondents voted for are very skewed towards
mobile native apps. Even when users said that they prefer mobile browsers, they did not
check nearly as many boxes as did those who voted for mobile native applications. This
just goes to show once again that those who pick mobile native applications are much
more adamant at what they want out of their mobile device. Security was not an issue
with searching. However, quick access was an issue. Those who chose apps stated that
they preferred apps 61% of the time because of quick access, where as quick access on
the browser side only got around 40%. The one very large difference was that ease of
information searching heavily won in the browser column with nearly a 22% difference
in the number of people who chose their devices browser over a mobile native
0.0% 10.0% 20.0% 30.0% 40.0% 50.0% 60.0% 70.0% % o f R e sp o n d e n ts
Reasons for Choosing
Respondents Differences Travel
application. The mobile browser has shown that it can hold its own when ease of
information searching is a factor, which is probably obvious. Ease of use showed a
perceived benefit for the native app. Of the respondents, 42% preferred the browser,
while 52% chose the mobile native applications. The other categories had little to no
effect on the difference between the mobile native applications and mobile web browsers.
Figure 13 shows the differences between respondents who would prefer either mobile
web browsers and mobile native applications.
Figure 13- The difference in respondents who chose Apps and those who chose the Browser.
This has shown us that even if the browser is preferred for searching, those who
would like to search with a mobile native application are still more adamant about how
they want to use them.
Next we come to the news category, which provided very different results then
the rest of the types of information needs. Security and trust were no more than 2%
0.0% 10.0% 20.0% 30.0% 40.0% 50.0% 60.0% 70.0%
%
o
f R
e
sp
o
n
d
e
n
ts
Reasons for Choosing
Respondents Differences Searchnig
different between mobile native applications and mobile web browsers when it came to
news. However, users were very adamant about which they prefer for quick access.
Mobile native applications were chosen in this category 68% of the time whereas
respondents chose quick access only 38% of the time for quick access with their mobile
web browser. Ease of information searching however saw a different result. With nearly
an 11% difference between the two, ease of information searching with the browser
preferred over mobile native applications. Ease of use, however, saw once again the
opposite result with mobile native applications taking 64% of the respondent’s votes as
opposed to only 25% on the mobile web browser side. Increased functionality got a 31%
for news on the mobile browser side, beating out the mobile native application which
only got 19%. The last two categories, content and other, both did not hold much
variance. Figure 14 shows the difference between mobile native applications and the
mobile web browser, as they both pertain to the reasons people use them for news.
Figure 14- The difference in respondents who chose Apps and those who chose the Browser.
0.0% 10.0% 20.0% 30.0% 40.0% 50.0% 60.0% 70.0% 80.0% % o f R e sp o n d e n ts
Reasons for Choosing
Respondents Differences News
This shows me that if users want their news quickly and only want to skim
through stories easily, that they want to use a mobile native application, however, if they
care about the functionality and ability to search through large amounts of data to find a
story that they are looking for, they will utilize their mobile devices web browser.
Entertainment shows a very similar picture to news. The only real difference
between them was that ease of information searching won for the browser with 39%.
However, another landslide victory for quick access on the mobile native application side
with 63% shows us that there is starting to be a very strong correlation between why
people use mobile native applications and the fact that they can be accessed quickly,
usually at the touch of a single button. This is also shown in the ease of use category by
the 35% difference between mobile native applications and mobile browser statistics.
Content of the information being collected also played a role in how people choose
between mobile native applications and their devices mobile web browser. The rest of the
categories all produced little variance. Figure 15 shows the difference between the
reasoning behind respondent’s answers of either mobile web browsers or mobile native
Figure 15- The difference in respondents who chose Apps and those who chose the Browser.
This shows us simply that there is a correlation between how respondents would
like to access their entertainment information and increased functionality.
Next, we will look at gaming. Mobile native applications were preferred by nearly
86% of the total respondents. Security and trust only got 6% of responder’s votes in the
mobile native application domain; however this was enough to beat out the 0% of votes
by responders in the browser domain. In fact, there is really nothing to analyze in this
category, the native app was preferred over the browser pretty heavily when it came to
gaming. Only once was the difference less than a 6% difference between the two and the
highest difference was around 50%. The one occurrence where the mobile native
application got beaten by the browser was in the “Other” category. After going back to
look at this data in the surveys, this was only because two respondents put down that they
0.0% 10.0% 20.0% 30.0% 40.0% 50.0% 60.0% 70.0%
%
o
f R
e
sp
o
n
d
e
n
ts
Reasons for Choosing
Respondents Differences
Entertainment
had never played games in their mobile devices web browser. This was more of a
statement than an answer. The results of this analysis are posted in Figure 16 below.
Figure 16- The difference in respondents who chose Apps and those who chose the Browser.
This tells us that, at lease on mobile devices, all respondents’ categories preferred
games to be played via mobile native applications. This is very obvious at the large
amount of variance between respondent’s answers for or against mobile native
applications and mobile browser applications.
Weather also showed a large preference for the mobile native applications. Of the
respondents, 86% said that they would rather use a mobile native application than their
mobile devices browser, which was only favored by 14%. The reasoning behind this may
just be likely the same as gaming. However, the numbers fluctuate greatly from just
either mobile native applications or mobile browsers taking a larger chunk of the votes.
Of the respondents, only 7.1% said that they would rather access their weather through a
0.0% 10.0% 20.0% 30.0% 40.0% 50.0% 60.0% 70.0%
%
o
f R
e
sp
o
n
d
e
n
ts
Reasons for Choosing