1 The Influence of Insurance Status
on Transfer of Patients and Hospital Length of Stay
By
Obafunto Abimbola
A Master’s Paper submitted to the faculty of the University of North Carolina at Chapel Hill
in partial fulfillment of the requirements for the degree of Master of Public Health in
the Public Health Leadership Program
Chapel Hill
2012
Advisor
Date
Second Reader
2 Table of Contents
Abstract . . . .. . . 3
Systematic Review . . . . 5
Background . . . 5
Methods. . . .. . . . 6
Data Sources and Searches. . . 6
Study Selection . . . 7
Data Extraction and Quality Assessment . . . 7
Data Synthesis and Analysis . . . 8
Results . . . 8
Quality Summary of Included Studies. . . 9
Discussion . . . .. .13
Limitations of Review . . . . 16
Limitations of Evidence. . . .16
Implications for Practice . . . 17
Implications for Research . . . .17
Conclusion . . . 18
Original Research . . . 19
Abstract . . . .. . . 20
Introduction . . . ..21
Methods . . . .. . . .22
Data Source . . . .. 22
Target Population. . . .22
Study Design . . . . 22
Statistical Analysis. . . .23
Results . . . 23
Demographics . . . .23
Hospital Length of Stay . . . .24
ICU Length of Stay . . . 24
Discussion . . . .. .24
Limitations . . . . . . 26
Conclusion . . . .. 26
Acknowledgments . . . 26
Appendix A: Tables and Figures for Systematic Review . . . . 29
Appendix B: Tables and Figures for Original Research. . . .38
3 Abstract:
Background: Patients who are uninsured or underinsured have worse healthcare outcomes. Understanding how this translates to outcomes for patients in orthopedic traumas is important. There is some evidence that these patients who lack optimal insurance plans (uninsured, or government plans) may have decreased access. The purpose of this paper is to evaluate current evidence of patient treatment outcomes and then to investigate how insurance influences hospital and intensive care unit (ICU) length of stay.
Systematic Review: Purpose: A review of the literature was conducted in order to investigate the current evidence of how disparities for the uninsured or government-insured patients in orthopedic traumas influenced patient treatment and management. Methods: EMBASE, MEDLINE, and COCHRANE online databases were searched for related articles. Results: Seven articles that met inclusion and exclusion criteria. A hand search resulted in the identification of an additional 2 studies. Articles assessed
according to USPSTF methodology. One study had the rating of “good- very good” study quality, six studies were found to be of “good” study quality and 2 were graded as of “fair” study quality. Conclusion: This review of the evidence found that the literature on
how insurance disparities influence treatment and management of trauma patients is limited to transfer of patients in orthopedics. Though limited, there is evidence that patients who are uninsured or underinsured have decreased access to care.
4 Medicaid insured, or had private insurance. Statistical Analysis: Pearson’s correlation, Student’s t-tests, one-way ANOVA, and test of proportions were used to look for
5 Insurance Status and Transfer of Care in Orthopedic Trauma Patients:
A Systematic Review
Background:
The Institute of Medicine has stated that patients without insurance have worse medical outcomes, more illness, and shorter life expectancy than insured adults due to less access and poorer quality of care. 1, 2 In 2007, 46 million Americans lacked
insurance, 19.6% of whom were under the age of 65years old. 2 With increasing costs of
care and health insurance premiums, the number of uninsured will continue to grow. 3
Socioeconomic and racial disparities in preventive and therapeutic services are well documented. 4-7 Disparities have been reported in analgesic use in the emergency department, elective procedures, emergent conditions, and even the management of various cancers. 7 They occur for both orthopedic and non-orthopedic conditions and in ambulatory and inpatient settings.7 Insurance coverage has been accepted as reflection of socioeconomic status. 5 In 2005, Shoen and her colleagues demonstrated that adults who were underinsured or uninsured had lower incomes than those who were fully insured. 3 They also showed that race was correlated with insurance status as African Americans and Hispanics were both more likely than whites to fall in the categories of underinsured or insured.3
Studies have evaluated multiple different outcomes and how they were influenced by insurance status or other socioeconomic factors. Limiting how social factors prevent patients’ care is a goal in all fields of medicine, including orthopedics.
6 and outcomes in orthopedic care, specifically at how insurance status affects inpatient and emergency room transfer to level 1 trauma centers and follow up care. 8-14 There are
no currently published reviews on this particular topic.
In this systematic review I hope to answer the following Key Questions:
1. What is the evidence of treatment or management disparities for the uninsured or government insured in orthopedics?
2. How are these disparities/differences quantified and reported?
Methods:
In order to address the focused question of identifying and quantifying how treatment and management outcomes differ based on insurance status, I performed a systematic search of the available literature. Because this question deals with social variables influencing treatment and management outcomes, I decided to consider these outcomes to include all health care services received by patients at initial time of
presentation.
Data Sources and Searches:
With the help of an experienced research librarian, I performed an exhaustive search of EMBASE, MEDLINE, and COCHRANE online databases to identify relevant articles. I used MeSH terms including “insurance coverage”, “insurance status”,
“orthopedics”, “trauma”, “health care”, and “treatment outcomes.” I examined the results,
7 the research question. From this final pool of articles, I performed a hand search to
identify any other studies. I then read the articles that were left in their entirety.
Study Selection:
This systematic review contains original research papers that are relevant to the topic of insurance status and access to care as well as answering the key questions stated earlier. I included prospective and retrospective cohort studies, all of which utilized patient medical records as the source of data. Randomized controlled trials were excluded. Systematic reviews were eligible to be included. To be eligible, studies
needed to include adult patients with orthopedic trauma complaints or conditions. In one study, pediatric patients were included in the cohort, and we included this particular paper because it included adults in its study population. Studies that were published after 1986 and looked at treatment or care at any point after the initial injury were included in the review. This particular year for the publication cut off was chosen as EMTALA (Emergency Medical Treatment and Active Labor Act) was passed and implemented. Because this law was a major policy change in the health care and increase of access for the population, I chose only to include a time frame that reflected effects of this law.
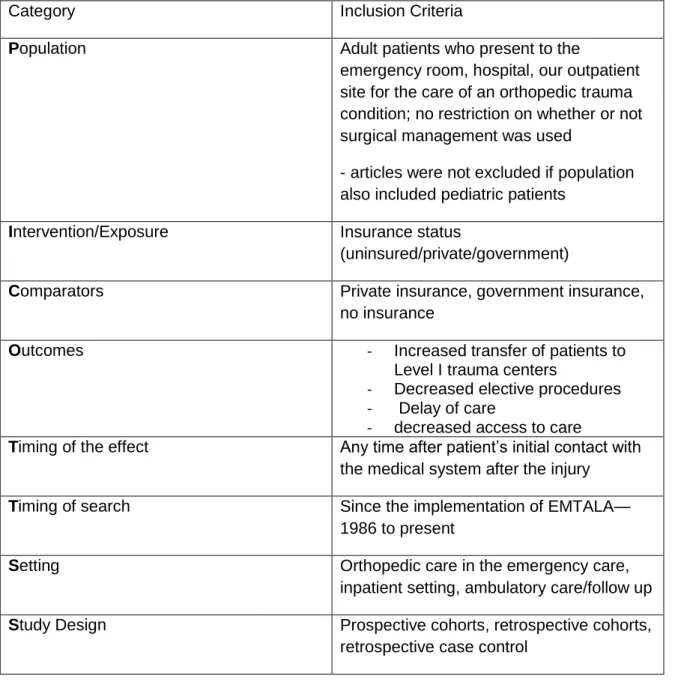
I found no need to place restrictions on settings for care, as patients with injuries often seek care at the emergency department or their physician. All of the inclusion criteria for this review are described using the PICOTTSS framework in Table 1.
Data Extraction and Quality Assessment
8 described in Table 1. Quality assessments were performed using the USPSTF
methodology.15 In this review, I made no attempt to contact primary authors to obtain
additional data.
Data Synthesis and Analysis
I performed a qualitative synthesis for each of the outcomes of interest. The qualitative synthesis is preformed due to the heterogeneity of the study populations. I did not assess the heterogeneity of the studies formally due to differences in eligibility criteria and protocols for each across the studies.
Results:
A total of 181 titles and abstracts were identified and reviewed using the research strategy as stated above. After an initial title and abstract review, 23 articles remained (Figure 1). A hand search was performed on these articles which yielded two additional studies to review. These 25 articles were assessed for eligibility. Studies were excluded if not performed in the United States, if using including Veteran’s Benefits in patient
population, or duplicate publications. A total of 7 articles were ultimately included, three retrospective cohorts, one retrospective case control, and three prospective cohorts. Table 2 summarizes the descriptions and demographics of the studies.
Quality Summary of Included Studies
9 level 1 and 2 trauma centers in the same category whereas the other studies considered transfers from level 2 centers to level 1 centers separately. For the most part there were no problems with drop out or retention issues with the papers as they were all
retrospective or prospective cohorts and data was collected on patients with no need for follow up nor an intervention involved. Thus little selection bias was introduced due to that particular issue. Measurement bias was introduced in the studies since criteria for determining whether a patient had been appropriately transferred were based on the individual investigators, with only one10 citing the rationale for or the source of the criteria. There are currently no validated scores or published criteria, making it difficult for investigators to create a study design that is easily generalizable. In general, the results of the studies were generalizable on a large scale; however, some of the studies did not report the distance of transfer or mode of transfer. 10 Quality assessments of the included studies are found in Table 4.
Goldfarb et al10
10 Total cases transferred that cited the reason as “too complex” were 81 case
(63%). There was one case where the orthopedist refused to see the patient resulting in the transfer. There were a total of 20 patients with a VAS score under 5 (deemed
noncomplex and transfer unnecessary). Of this group, 13 were transferred citing complexity as the reason for transfer. To add, there was an on call orthopedist at the hospitals for these 13 patients. Three patients in this group (15%) had private insurance; 9 patients (45%) were uninsured or had Medicaid and 6 patients (30%) had Medicare, totaling 15 patients (75%). The insurance status for this group was significantly different (p<0.05) from the group of patients with a VAS ≥5 with 75% of transferred patients
having Medicare, Medicaid, or no insurance, and 25% with private insurance or workers compensation.
Wolinisky et al14
11 up with surgical care at a later date. Because this study is retrospective, it is difficult to
accurately determine the reasons for choosing this care at the Level 1 trauma center.
Thakur et al13
Investigators of this prospective cohort study observed transfer trends of 216 patients over 5 months. In order to determine appropriate transfer, three orthopedic surgeons were given the diagnosis of transfer without any other patient information. Fifty one percent of the total transfers were uninsured. The orthopedic surgeons determined that 52% of the patients transferred were done inappropriately. Of these inappropriately transferred patients, 59% were uninsured (LR =2; p<0.02). Interestingly, investigators also found that 66% of the uninsured patients were transferred over the weekend (Friday through Sunday).
Crichlow et al9
Five hundred and forty six patients were transferred over the course of the year and data was collected prospectively for these cases to determine appropriate transfer trends. The cohort was subdivided by insurance status and by type of transfer. Group A consisted of patients who were privately insured or receiving worker’s compensation and
12 appropriate to transfer (9-10). These categories seem to be arbitrarily divided, however make it clear that there are cases that are clearly appropriate or inappropriate to transfer. Thirteen percent of the patients in Group A were completely inappropriately transferred yet 19.2 % of patients from group B were completely inappropriately transferred with an odds ratio of 1.4 (p=0.0909).
Koval et al11
The National Trauma Data Bank provided the source population for this retrospective case control study. All 97,393 patients presented to a Level 2 or lower trauma center and as determined by the information in the data bank, did not need Level 1 center care as injuries were minor. Approximately 21% were transferred to a level 1 trauma center and served as the cases while the remaining 78.8% were treated at the hospitals to which they initially presented and served as the controls. Adjusted odds ratios for transfer of patients with Medicaid with reference to insured was 2.02 (as reported in their table 1); however, the odds ratios for transfer of patients who were uninsured with reference to insured was 1.01. No confidence intervals or P values were reported.
Archdeacon et al8
This retrospective cohort study used a group of 243 patients with femoral fractures who presented directly to the Level 1 trauma center or to Level 2 or lower trauma centers. Only 38 patients in the cohort were transferred to the Level 1 trauma center and of those, 47% were considered to have met criteria for appropriate transfer. Of the patients who were not transferred, 100% were insured. A little more than half (57.9%) of those patients transferred were without insurance and 42.1% of those
13 when any type of coverage (managed-care, Medicare, Medicaid, commercial, Workers’
Compensation, or indemnity) at the time of definitive treatment.
Parks et al12
The investigators of this retrospective cohort used the National Trauma Data Bank to obtain 79,726 patients. All of the patients presented to a level 3 or 4 trauma center, but 91.9% were transferred to level 1 or 2 trauma centers. Of those transferred 18% were uninsured in comparison to the 14% who were not transferred. Patients who were transferred had more severe injuries and so the investigators adjusted for that in their final analysis and found no difference in odds {0.95 (95% CI: 0.88-1.04)) for being transferred if uninsured.
Discussion:
In this systematic review, I attempted to identify and quantify how treatment outcomes in orthopedic trauma patients differ based on insurance status. The literature on this particular topic is limited and therefore the treatment outcome reviewed and to be discussed is transfer of patients. Although transfer of patients is not traditionally
mentioned when discussing treatments, patients have entrusted their care to health professionals and decisions made about their care after that point is considered management. Inappropriate transfer of patients is important because when prevented, continuity of care for patient’s increases, there is decreased time to definitive care, and
patients aren’t incurring higher medical costs by being seen at two different facilities.
Transfer of patients
14 Level 1 trauma center, although not unanimously. Assessing how insurance status influences transfer trends in orthopedic trauma patients was performed using different methods, transfer criteria, and measures of the outcomes making the task of arriving at an ultimate conclusion difficult. Three of the studies found no statistical difference in the transfer of patients: Crichlow et al, Goldfarb et, and Parks et al.9, 10, 12 Of note, Crichlow et al reported an odds ratio of being transferred due to marginal or no insurance at 1.4 (p=0.0909). 9A larger cohort may have made this odds ratio statistically significant. Also, they included Medicare and Medicaid patients in the same group as patients with no insurance. This may have hidden the effects of lack of insurance in this study. They attributed the inappropriate transfers to lack of orthopedic coverage.
It is also important to point out an important difference in study methods in Parks et al. They combined patients at a level 1 and 2 trauma center into one group, where other studies had any patient transferred to a level 1 trauma center in a group by themselves. Thus, patients who were transferred from a level 2 to a level 1 trauma center were not accounted for in the analysis. This may have masked the effect of insurance on transfer since a large group of transfers were being excluded, and thus weakens the reliability of the results and the strength of the study itself.
This variable was addressed in other studies as well and included as a factor in the studies.8, 10, 11 Interestingly, this has been considered as a reason for inappropriate transfer and should studies attempting to quantify how much of a role this plays in
transfer of patients are needed.
In Goldfarb’s study their outcome of interest was patient transfer by insurance
15 or uninsured versus the 49% that had private insurance or were receiving workers’
compensation. However, of the patients inappropriately transferred, 75% were in this
former group.
Archdeacon and his colleagues looked at how being insured affected where patients were likely to be definitively treated for a femoral fracture. 8 They found that insured patients were more likely to receive care where they initially presented. Of the population of patients who were not transferred, 100% of them were insured. None of the patients that were kept at the outside community hospitals or Level 2 trauma center were uninsured or self-pay. Unfortunately, as a result of how the insurance status was categorized it is impossible to make any guesses as to the make-up of patients with Medicaid in that group that was not transferred.
These findings, although not surprising, are concerning. Health care disparities abound in medicine. Insurance is an important component for access to health care. Unfortunately in 2006, 47 million Americans were uninsured. 4 The majority of those who are uninsured are between the ages of 18 and 65. Additionally, minorities are more likely to be without insurance.4 Patients present to the Emergency room seeking care, and at one point due to their insurance status 87% were transferred to other hospitals. 9Some hospitals refused to treat uninsured or “indigent” patients. This causes delay of care and
disproportionately high volumes at the hospitals that are receiving these transfers. In 1987 the Emergency Medical Treatment and Labor Act (EMTALA) was passed with one of its goals to address this particular issue. 9-11 It appears that transfer of patients based on their insurance status occurs, as demonstrated by the studies in this review and by the continued hospital citations by the Health Care Financing Administration.9
16
Limitations of this review
There are a few limitations and biases in this systematic review. I conducted the review of the literature without a second investigator. For good quality systematic reviews, it is necessary to have more than one investigator performing the search. Selection bias was introduced in this study as I only included studies published in the United States and written in English. I am unsure how to avoid this, as they health care system in the US is unique in its reimbursement methods. Lastly, as I did not look for unpublished data, there is the possibility of publication bias.
Limitations of the evidence
The seven studies have various study designs, reported outcomes, and insurance category groups. Half of the studies looked only at patients that were transferred, while others looked at patients that were and were not transferred. With study designs only looking at transferred patients, it makes it difficult to estimate patient demographics, including insurance status, of the source population. This was mentioned as a study limitation, where this occurred.
The categories of insurance status differed between studies as well. This made it difficult to accurately determine trends amongst transferred patients. Archdeacon and his colleagues all insurance coverage types together and those who were uninsured or self-pay were segregated.8 Wolinsky and his colleagues divided statuses into insured, uninsured and underinsured where patients who were considered to have insurance were those who had plans where reimbursement rates were more than Medicare.14
17 complexity score was the best method, however in Crichlow et al this score was further subcategorized into completely appropriate transfer, indeterminate appropriateness, and completely in appropriate transfer; this made it difficult to even compare this study to the Goldfarb study—both studies that used the VAS complexity score. 9, 10
Implications for practice
There is no current standardized method or published guidelines that aid physicians in making the decision of whether orthopedic patients should be transferred to receive Level 1 trauma care. Creating such guidelines may help to decrease the amount of inappropriate transfers and the disproportionate amount of patients without insurance or with plans with undesirable reimbursement rates from being transferred.
Additionally, physician biases are present as evidenced by the transfer trends. Being more cognizant of personal biases may help to decrease the amount of non-insured or undernon-insured patients being disproportionately and inappropriately transferred to Level 1 trauma centers.
Implications for research
The initial goal of this systematic review was to identify how disparities in treatment or management outcomes are characterized in the orthopedic trauma
literature. For adults, currently the literature is dominated by transfer trend data. Future studies should look at surgical outcomes, patient functional outcomes, and patient
satisfaction. Expanding the literature will help identify where the disparities lie and hopefully provide clues as to how to decrease them in orthopedic patient care.
18 using this analysis method but with a much larger cohort, such as the one in Koval et al
may provide additional important information and revelations about this topic. 11
Conclusion
Insurance status has been well documented in the literature as influencing health care of patients and their access to care. Unfortunately, in many cases, those who lack adequate insurance are the ones who have limited access to care and who receive poorer health care. EMTALA was a policy that hoped to help decrease these types of situations. However, disparities continue to exist. Patients with orthopedic traumas and lower insurance statuses are more likely to be unnecessarily transferred for care to a Level 1 trauma center. This problem is likely reproduced in other aspects of patient care. How these trends translate to other outcomes has yet to be reported as the evidence is not there. Hopefully future research will look at other outcomes to bring to these
problems to light and begin the process of improving patient care despite one’s ability to
19 Unequal Footing? Insurance Status and Hospital Length of Stay
Obafunto Abimbola,BA
University of North Carolina at Chapel Hill School of Medicine
Anthony Viera, MD, MPH
University of North Carolina at Chapel Hill Gillings School of Public Health
Anthony Charles, MD, MPH
University of North Carolina at Chapel Hill Department of General Surgery
Laurence Dahners, MD
University of North Carolina at Chapel Hill Department of Orthopedic Surgery
For proofs and reprints:
Laurence Dahners, MD
University of North Carolina at Chapel Hill Department of Orthopedic Surgery
CB7055
Chapel Hill, NC 27599
Phone 919-966-3340 Fax: (919)966-6730 [email protected]
20 Abstract:
Purpose: To investigate the association between the quality of insurance coverage and
in-hospital length of stay and intensive care unit (ICU) length of stay.
Methods: Retrospective cohort study using the UNC Trauma registry. Patients included were adults who had injury severity scores less than 18 and were either uninsured, Medicaid insured, or had private insurance.
Statistical Analysis: Pearson’s correlation, Student’s t-tests, one-way ANOVA, and test of proportions were used to look for associations between insurance status and
hospital/ICU stays, and then to examine the association of potential confounders with insurance status. Linear regression was used for analysis of the relationship.
Results: Hospital mean length of stay was 6.6 days for uninsured patients, 8.4 days for Medicaid patients, and 6.4 for privately insured patients (p=0.01). Mean ICU length of stay was 4.0 for uninsured patients, 5.8 for Medicaid patients, and 6.1 for privately insured patients (p=0.2).
Conclusion: In patients with minor to moderate orthopedic trauma injuries, Medicaid patients received increased amounts of care, as demonstrated by longer hospital stays. However, there was no difference in intensive care stays by insurance group.
Keywords: insurance status, reimbursement, length of stay, orthopedic trauma, health
21 Introduction
Trauma is the number one reason for visits to emergency departments for patients of all ages, and musculoskeletal injuries commonly result from trauma.1,2 There were over 128.9 million visits to emergency departments in 2009, with almost 3 million of them due to fractures of the upper or lower extremity.16, 17
Several investigators have examined how insurance status affects inpatient and emergency room transfers to level I trauma centers for orthopedic trauma patients.11, 12, 14, 18 Most studies have consistently found that a higher proportion of patients who were
uninsured or government insured were transferred to level I trauma centers in
comparison to their insured counterparts. One prospective study also found that patients who had less complex injuries were disproportionately transferred if they had “an
insurance status that was worse than that of the typical transferred patient.”10 This
supports the hypothesis that referring hospitals tend to disproportionately transfer underinsured patients, presumably to help their bottom lines. Parks and her colleagues, however, found no difference in percentage of uninsured or government insured patient transfers in comparison to insured patients.5
There have been other studies that look at how access to care is limited based on insurance coverage, finding that patients with private insurance often receive better follow up and more resources for care.1, 19 Though previous investigations have dealt with how insurance may influence location of care in orthopedics, procedure choice, or access to care, there is limited information regarding orthopedic trauma patients and
their utilization of clinical resources. 7
22 insurance coverage and number of days in the intensive care unit (ICU) as well as in-hospital length of stay among orthopedic trauma patients. We hypothesized that patients with higher quality insurance would have longer length of stay and more time spent in the ICU.
Methods
Data Source
Approval from the University of North Carolina at Chapel Hill (UNC) Institutional Review Board was obtained. The data in this study were obtained from the University of North Carolina at Chapel Hill (UNC) Trauma Registry. This database includes all trauma patients who are admitted from the UNC emergency department.
Target Population
The source database included the 24,369 patients who were admitted to the UNC emergency department during the ten year time period from 2000 to 2010. There were 5,736 adult patients with a lower extremity fracture as identified by ICD 9 Codes (821-829 lower extremity fractures other than pelvic fractures and 808 pelvic fractures).
After excluding patients who were below the age of 18 years, died before an orthopedic surgical procedure was performed, did not fall into one of the three insurance groups of interest or had injury severity scores greater than 18 the final study population total was 2,571. 20
Study Design
23 government insurance), and private insurance (representing better payers). Age (years), gender (male or female), and ISS, were collected and reported as demographic
information. Primary and secondary outcome of interest were length of stay (days) and ICU length of stay (days).
Statistical Analysis
Sample size estimation was performed to make sure that study results would have adequate power (80%) to find a difference of at least one day between means. Univariate analyses were performed on all independent variables. The distributions of the continuous variables were skewed. Both parametric and nonparametric tests were used for the analyses. However we are reporting the results of the parametric tests since results for differences among groups were similar. One-way ANOVA and chi square cross tabulation were used to compare demographic characteristics across groups and reported as means and percentages. Pearson’s correlation, Student’s t-tests, one-way
ANOVA, and test of proportions were used to look for associations between insurance status and utilization, and then to examine the association of potential confounders with insurance status. Linear regression was used for analysis of the relationship between the insurance quality and health care utilization. Variables identified as confounders (age, race, gender, and ISS score) were included in an adjusted model. Statistically significant alpha level was set at <0.05 a priori. All statistical analyses were performed in
STATA 12, Statistical Software: Release 11, College Station, TX: StataCorp LP.
Results
Demographics
24 study population. The mean ISS was 9.0(± 4.5). Table 1 demonstrates the
demographics by group. Table 2 reports the demographics of the three insurance
categories.
Hospital Length of Stay
The mean length of stay for patients was 6.9 days and skewed to the right (skewness = 10.8). After adjusting for ISS, patients with Medicaid had the longest mean hospital stay (8.4 days). Uninsured patients followed with a mean of 6.6 days and patients with private insurance had the shortest stay (6.4 days) (p=0.01) (Table 3). Additionally, beta coefficients were derived for the adjusted model (uninsured vs commercial: 0.3, p=0.6; Medicaid vs commercial: 2.0, p<0.05) Thus, in comparison to private insurance, Medicaid patients stayed 2.0 days longer (p=0.002) but uninsured patient length of stay were not statistically different (p=0.6).
ICU Length of Stay
There were 442 patients in the cohort who spent time in the ICU. The mean length of stay for patients was 5.2 days and skewed to the right (skewness = 6.8). The median length of stay was 2 days with a range of 121. ICU length of stay did not differ in the unadjusted (p=0.1) nor adjusted (p=0.2) models (Table 4). Though the difference between groups did not reach statistical significance, there is a 2 day difference in mean
days in the ICU between uninsured patients (4.0 days) and private patients (6.1 days).
Discussion
25 patients in the hospital longer. Instead, we found that Medicaid patients stayed in the hospital significantly longer than patients with other types of insurance and that patients with private insurance, in fact, had the shortest length of stay in the hospital. Medicaid patients actually stayed in the hospital almost 2 days longer than patients with private insurance. Although this was not consistent with what we expected, it is consistent with what some literature has previously reported. Medicaid coverage has been shown to be associated with greater utilization of both preventive and curative health care services.5
Interestingly, private insurance patients stayed in the hospital for the shortest amount of time. A possible explanation for the short hospital stays may be policy and guideline differences for care reimbursement that private insurance companies have for their patients. It may also be that patients who can afford private insurance are better able to cope with stressors such as early discharge. It is important to note that the difference between uninsured and privately insured patient mean length of stays were 0.3 days (approximately 7 hours). The importance of this difference may not be fully understood unless these hours are translated to costs.
We also found that there was not a statistically significant difference in length of stay in the ICU between different insurance types. This finding was surprising since it has been evidenced that patients without insurance experience disparate care.1, 2 We expected to see those same differences in this study. However, there was no overall
statistical difference between the three groups.
26 as the uninsured and the Medicaid patients didn’t achieve statistical significance. A
second explanation could be that more objective factors may be determining length of
ICU stay, though this would not completely explain our results.
The means for ICU length of stay demonstrate potentially important trends. However, because the relationship is not statistically significant and the confidence intervals are wide, it is difficult to draw any meaningful conclusions.
Limitations
There were several limitations to this study. As with most retrospective studies that use data banks as the primary source of data, we are limited by what data are available. There were data points that were missing and ambiguous language used to identify categories and variables which may introduce selection bias into our study. Also because of this study design, it is difficult to make any causal conclusions.
Another limitation to our study is that we only looked at primary insurance types. Many patients had supplemental insurance that helped to offset costs for patients. Not including this in the analysis introduces bias that should be considered when reviewing our findings.
Lastly, we did not include Medicare patients in our cohort, but instead used Medicaid as a surrogate for low reimbursement insurance. Medicare and Medicaid patients differ by age and by socioeconomic status and so, though reimbursement rates are similar, the actual patient population is different, especially in age which would have
been a major confounder.
27 In patients with minor to moderate orthopedic trauma, there is a difference in hospital length of stay by insurance type. Medicaid patients have increased healthcare utilization, as demonstrated by longer hospital stays. However, there was no difference in intensive care utilization, represented by length of stay in the ICU. This study is one of the first that we are aware of which looks at hospital utilization in orthopedic trauma patients by insurance status. Future studies should investigate how insurance categories affect treatment for patients with more severe injuries.
Acknowledgments
28 Appendix A: Tables and Figures for Systematic Review
Table 1. PICOTTSS framework for systematic review of Insurance status and orthopedic access to care
Category Inclusion Criteria
Population Adult patients who present to the
emergency room, hospital, our outpatient site for the care of an orthopedic trauma condition; no restriction on whether or not surgical management was used
- articles were not excluded if population also included pediatric patients
Intervention/Exposure Insurance status
(uninsured/private/government)
Comparators Private insurance, government insurance,
no insurance
Outcomes - Increased transfer of patients to
Level I trauma centers
- Decreased elective procedures - Delay of care
- decreased access to care
Timing of the effect Any time after patient’s initial contact with
the medical system after the injury
Timing of search Since the implementation of EMTALA—
1986 to present
Setting Orthopedic care in the emergency care,
inpatient setting, ambulatory care/follow up
Study Design Prospective cohorts, retrospective cohorts,
29 Figure 1. Flow diagram of search Strategy
Titles and
abstracts identified and screened
Abstract review led to the
exclusion of n= 69
-unrelated study - wrong study question -Inappropriate / wrong study design
Publications meeting inclusion criteria
Full text retrieved and assessed for eligibility
Abstracts reviewed
n= 92 Studies identified
from hand search
Review of titles caused the exclusion of n= 89
-unrelated study - Study not in English
Excluded n = 18
- Conducted outside of the United States n=5
-Unable to get access to article
n=1
- Solely pediatric patient population
30 Table 2. Description of Included Studies
Author Time period and State of data collection
Total subjects
Insurance Categories (%) Population Number
of Females (%) Number of Males (%) Age Range (years) Mean age (years) Goldfarb et al Jan 2004-Dec 2004 Washington
128 Private (20%) Medicaid (5%) Medicare (23%)
Self-pay/uninsured (12%) Worker’s compensation (14%)
Adult patients with isolated orthopedic trauma injuries; all patients were
transferred from a non-tertiary outside hospital. No spine patients were included
53 (41.4%)
75 (58.6%) 19-93 49
Wolinsky et al*
Jan 2004-Dec 2007
California
697 Underinsured = Medicare only or insurance reimbursement similar to Medicare
Uninsured= no insurance or reimbursement lower than Medicare
Insured= reimbursement rates higher than Medicare
All patients who received definite (surgical) care of ankle or distal radius fractures at the University of California at Davis Hospital as identified by CPT codes
423 (60.9%)
278 (39.1%) 9-93 --
Thakur et al 2007
Rhode Island
216 No insurance/Self Pay (50.9%) Insurance (49.1%)(Medicaid, Medicare, Private, etc)
All patients transferred from an outside community hospital with isolated orthopedic injuries
76 (35.2%)
140 (64.8%) -- 45
Crichlow et al
Jan 2007- Dec 2007
Indiana
546 Group A (50.4%) = Private insurance and workers compensation
Group B (49.6%) = Medicare, Medicaid, Self-pay
Al Patients transferred from an outside hospital to the Level 1 Trauma center Group 1: transferred directly to the orthopedic service
Group 2: transferred to the hospital with an orthopedic consult
215 (39.4%)
331 (60.6%) -- Group 1- 44.7
Group 2- 41.6
Koval et al 1988-2004
National Trauma Data Bank
97,393 Insured (72.5%)= commercial, no-fault, workers’
compensation or Medicare Underinsured (10.8%) = Medicaid
Trauma patients from that National Trauma Data Bank meeting the following criteria: transferred to a Level 1 trauma center from
42,152 (43.28%)
55,241 (56.72%)
31 Noninsured (16.7%) = self-pay a center that was likely to
be a Level 2 or lower trauma center, injuries did not suggest need for a transfer, ISS ≤9, and no level 1 emergency department disposition suggestion serious injury or special need
Archdeacon et al
Aug 1999- Dec 2001
Ohio
243 Insured (58.8%) = managed-care plan, Medimanaged-care, Medicaid, Workers’ Compensation, commercial insurance, or indemnity insurance at time of definitive treatment
Uninsured (41.2%)= No evidence of coverage at or prior to the time of definitive surgical treatment
Patients with femoral fractures that were definitively treated with intramedullary nail within the health care system; Patients may have been seen at the Level 1 trauma center, or a Level 2 or lower center within or outside of the hospital system
80 (32.9%)
163 (67.1%) -- --
Parks et al Unspecified
National Trauma Data bank
79,726 Insured (83%) = commercial, Medicaid, Champus, Medicare, Worker’s Compensation, “and others”
Uninsured (27%)= self-pay, charity
Trauma patients from that National Trauma Data Bank.
Two groups- transfer and non-transfer
Transfer patients defined as patients who received their definitive care at Level 1 or 2 trauma centers after being transferred from another hospital
Non-transfer patients were defined as patients who received definitive care at a level 3 or 4 trauma center
If insurance status or discharge disposition were unknown or missing, patients were excluded
25329 (31.8%)
54,397 (68.2%)
-- --
32
Table 3.
Results of included studies
Author (Year published) Total Number of Subjects
Description of outcomes measured % Presenting to community hospital % Transferred to Level 1 center for care
% of Transferred requiring care at a Level I trauma center (how determined) Odds of transfer Proportion of transfer by insurance status Goldfarb (2006)
128 Transferring physician type (ED physician, internist, orthopedic surgeon)
Reasons for transfer (complexity, lack of subspecialty care, patient request, lack of availability of the on call orthopedist, miscellaneous) Route of Transfer (ambulance, helicopter, car, fixed wing airplane)
Insurance Status
Hospital Demographics (state, hospital size, distance traveled for transfer, orthopedic staff)
100% (all patients)
100% (all patients)
84% (108 or 128 determined by the VAS score ≥5)
__ 51% vs 49%
(p>0.05)
Transfer population with Medicaid, Medicare, or no insurance versus patients with private insurance or workers’ compensation 75% of inappropriately transferred patients had Medicaid, Medicare, or were uninsured
Wolinsky (2011)
697 Demographics for the three different groups, Mechanism of injury, and insurance analysis
28.7% 28.7% 40.5% of patients transferred (one of the following criteria were met: insurance plan provided by that hospital, prisoner, injuries requiring tertiary care, geographical convenience, pregnancy, other associated injuries)
Group 2a: 1.07 ; p=0.799 (95%CI= 0.65-1.75) Group 2b: 2.53; p=0.005 (95%CI= 1.32-4.86)
82% vs 63% (p<0.001)
Under or uninsured transferred inappropriately vs transferred appropriately Thakur (2010)
216 Insurance status, patient
demographics, advanced imaging
100% 100% 48%
(3 senior level
--- 59% of
33 before transfer, time of transfer
(time of day and if on weekend)
fellowship trained orthopedic surgeons determined whether the diagnosis could have been managed by a board-certified residency-trained general
orthopedist in the community; no criteria was followed)
transferred patients were uninsured vs 42% of appropriately transferred patients were uninsured (p<0.02)
Crichlow (2010)
546 Patient demographics, transfer appropriateness, hospital demographics, route of transfer (helicopter, ambulance, car), risk factors for transfer (time of the week, time of the day, insurance type)
100% 100% 16.5% -
completely inappropriate transfers 34.2%- indeterminate appropriateness of transfer 49.3% - completely appropriate transfers (VAS complexity score; 0-1= completely inappropriate transfer 2-8= indeterminately inappropriate transfer 9-10= completely appropriate transfer)
34 Koval
(2006)
97,393 Risk factors for transfer once medical necessity has been excluded as a reason; reasons assessed included gender, age (0-17. 18-64, or 65 and older), injury severity score, race (white, black, Hispanic, or other), time transfer received (6am-12pm, 12pm-6pm, 6pm-12am, 12am-6am),
comorbidities (Deyo-Charlson comorbidity index), and insurance status
100% 21.2%
(cases; 78.8% represented the
controls)
0% of the cases (inclusion criteria for study
population: Patients with ISS score ≤9 and injuries recorded in the medical record do not suggest a need for transfer to a level 1 trauma center)
1.86 (99% CI: 1.65-2.11) ¥ for Medicaid with reference to insured
1.03 (99%CI: 0.92-1.16) ¥ for Self pay with reference to insured 17.84% were insured 38.60% received Medicaid 24.56% were uninsured Archdeacon (2007)
243 Patient demographics, complexity of injuries in patients transferred, proportion of open fractures transferred, injury data, insurance status
71 (29.2%) 38 (25.6%)
(100% of non-transferred patients were insured) 47% (Patients who sustained complex musculoskeletal injuries, open fractures, or came from a hospital lacking orthopedic coverage.
-- 57.9% of patients
without insurance were transferred
42.1% of patients with insurance were transferred
Parks (2009)
79,726 Predictors of transfer to a Level 1 or 2 trauma center—uninsured, age, gender, blunt mechanism of injury, abdominal injury, chest injury, head injury, Glasgow Coma scale, SBP, mm HG, injury severity score
79,726 (100%)
72,900 (91.4%)
-- 0.95 (95% CI:
0.88-1.04)^
18% vs 14% (transferred vs non transferred)
∫
p value was not reported
¥ Odds ratio adjusted for variables age, ISS group gender, race, insurance status, time of day m transfer received, and Deyo-Charlson comorbidity index
^
35 Table 4. Quality Assessment of included studies
Author (Year published)
Design Adherence/ Dropouts
Selection Bias Potential (+ to +++ scale)*
Measurement of outcomes (+ to +++ scale)*
Generalizability (+ to +++ scale)* Study Quality Goldfarb (2006) Prospective Cohort
n/a ++
Although patient population was defined to include only
transferred patients, investigators were unable to collect information about patients that were not transferred
No table describing patient characteristics of the cohort to determine if there is possible
confounding
+
The investigators used the VAS complexity score as a way to standardize the injury severity; However, the reliability of this score has yet to be validated
+
The use of the VAS complexity score as the only way to assess injury limits the generalizability of this study to larger or other populations as the score is only used at this institution for this study
good
Wolinsky (2011)
Retrospective Cohort
n/a ++
Patients were a subgroup of fractures that are treated by stabilizing first, and seeking definitive care later; since
retrospective, unable to determine exact reasons for seeking care at the level 1 center
+ - ++
Criteria for determining appropriate transfer was loosely described and somewhat subjective in some areas (“geographical convenience”)
+ - ++
A bit difficult to generalize results to patients who present to ED and require emergent definitive treatment.
There is also no mention of average distance of transfer so difficult to assess
generalizability on the basis of the actual trauma
facilities and health care community good Thakur (2010) Prospective Cohort
n/a + - ++
No table describing patient characteristics of the cohort to determine if there is possible
confounding
Limited demographic
++ - +++
Determination of what was transfer appropriateness was based on the opinions of three surgeons and there was no reported scale or criteria used to standardize
++
Difficult to generalize as measurement was subjective and very physician specific
36 information reported in
actual article and whether there were differences amongst groups
the decisions for all patients; additionally only diagnosis was given; no patient information was given to orthopedists Crichlow
(2010)
Prospective Cohort
n/a +
Patient demographics were evenly distributed amongst groups 1 and 2
++
The investigators used the VAS complexity score as a way to standardize the injury severity; However, the reliability of this score has yet to be validated
+
The use of the VAS complexity score as the only way to assess injury limits the generalizability of this study to larger or other populations as the score is only used at this institution for this study; it is further limited by the subcategories of the score as they seem to have been made arbitrarily good Koval (2006) Retrospective Case Control Lost 39,292 possible patients in the original source population due to missing data points; these patients that were not included did however meet the inclusion criteria
+
For the most part the patient demographics were evenly distributed in cases, with the exception of race (statistically more blacks than any other racial group; don’t believe this introduced much excess bias)
+
Inclusion criteria
determined which patients were kept in the analysis; data was taken directly from the patient medical records; this process limits the amount of
measurement bias introduced
+
Good generalizability as this looked at a very large population of patients who were inappropriately transferred good Archdeacon (2007) Retrospective Cohort
n/a +
Distribution of insurance status among groups based on initial presentation was disproportionate. More insured initially present to the Level 1 trauma center.
+
Investigators utilized a standard criteria for transfer amongst all patients
+
Generalizability slightly limited by the study of the hospital system; it makes the results more center specific depending on the actual hospital system policies and protocols
Good- very good Parks (2009) Retrospective Cohort
Not reported + - ++
The distribution of
+
Investigators used
++
Unable to determine
37 insurance status among
groups generally was evenly distributed. The patients in the transfer group had more severe injuries by most of the measures(mean ISS, % Glasgow coma scale ≤8, and % ISS≥16) Patients in the transfer group also had a greater proportion of head injuries, chest injuries, and abdominal injuries.
Inclusion criteria was not included and only a single exclusion criteria was noted.
discharge
disposition/transfer status as the criteria for groups; validates scales and objective measures were also applied evenly to determine injury severity
inclusion or exclusion criteria for study population. Also demographic
38 Appendix B: Tables and Figures for Original Research
Table 1. Descriptive Summary of Demographics of the Study Sample by Group N=2,571
Age (y) 55.2 (24.1)
Gender (%) Female Male
34.6 65.4
Insurance Category (%) Uninsured
Medicaid Private
38.7 17.0 44.3
ISS 9.0 (4.5)
39 Table 2. Summary of Baseline Demographic Information on Patients by Insurance status for Patients *
Uninsured Medicaid Private P Value
N (%) 996 (38.7) 437 (17.0) 1,138 (44.3) --
Age (y) 36.2 (±13.3) 41.0 (±18.6) 43.4 (±17.2) <0.001
Gender (%) Female Male
26.2 45.4
22.5 14.1
51.4 40.5
<0.001
ISS 8.8 (±4.7) 9.2 (±4.3) 9.1 (±4.4) <0.001
40 Table 3. Unadjusted and Adjusted Subgroup analysis for Primary Outcome¥
Uninsured Medicaid Private P values
Unadjusted Length of Stay
6.6 (5.9.0-7.3) 8.5 (7.4-9.6) 6.5 (5.8-7.2) 0.006
Length of Stay Adjusted for ISS
6.7 (6.01-7.4) 8.4 (7.3-9.5) 6.4 (5.8-7.1) 0.01
41 Table 4. Unadjusted and Adjusted Subgroup analysis for Secondary Outcome ¥
Uninsured Medicaid Private P values
Unadjusted ICU LOS
3.9 (2.3-5.5) 5.7 (3.3-8.0) 6.2 (4.6-7.8) 0.1
ICU LOS Adjusted for ISS
4.0 (2.4--5.6) 5.8 (3.4-8.1) 6.1 (4.4-7.1) 0.2
42 References
1. Asplin BR, Rhodes KV, Levy H, et al. Insurance status and access to urgent ambulatory care follow-up appointments. JAMA. 2005;294(10):1248-1254. doi: 10.1001/jama.294.10.1248.
2. McWilliams JM. Health consequences of uninsurance among adults in the united states: Recent evidence and implications. Milbank Q. 2009;87(2):443-494. doi: 10.1111/j.1468-0009.2009.00564.x.
3. Schoen C, Doty MM, Collins SR, Holmgren AL. Insured but not protected: How many adults are underinsured?. Health Aff (Millwood). 2005;Suppl Web Exclusives:W5-289-W5-302. doi: 10.1377/hlthaff.w5.289.
4. Bible JE, Lee RS, Friedlaender GE. The need for increased access to the U.S. health-care system. J Bone Joint Surg Am. 2009;91(2):476-484. doi: 10.2106/JBJS.H.00735.
5. Hanchate AD, Zhang Y, Felson DT, Ash AS. Exploring the determinants of racial and ethnic disparities in total knee arthroplasty: Health insurance, income, and assets. Med Care.
2008;46(5):481-488. doi: 10.1097/MLR.0b013e3181621e9c.
6. Ottenbacher KJ, Smith PM, Illig SB, et al. Disparity in health services and outcomes for persons with hip fracture and lower extremity joint replacement. Med Care. 2003;41(2):232-241. doi: 10.1097/01.MLR.0000044902.01597.54.
7. Slover J, Gibson J, Tosteson T, Smith B, Koval K. Racial and economic disparity and the treatment of pediatric fractures. J Pediatr Orthop. 2005;25(6):717-721.
43 9. Crichlow RJ, Zeni A, Reveal G, et al. Appropriateness of patient transfer with associated orthopaedic injuries to a level I trauma center. J Orthop Trauma. 2010;24(6):331-335. doi: 10.1097/BOT.0b013e3181ddfde9.
10. Goldfarb CA, Borrelli J,Jr, Lu M, Ricci WM. A prospective evaluation of patients with isolated orthopedic injuries transferred to a level I trauma center. J Orthop Trauma. 2006;20(9):613-617. doi: 10.1097/01.bot.0000249415.47871.e5.
11. Koval KJ, Tingey CW, Spratt KF. Are patients being transferred to level-I trauma centers for reasons other than medical necessity?. J Bone Joint Surg Am. 2006;88(10):2124-2132. doi: 10.2106/JBJS.F.00245.
12. Parks J, Gentilello LM, Shafi S. Financial triage in transfer of trauma patients: A myth or a reality?. Am J Surg. 2009;198(3):e35-8. doi: 10.1016/j.amjsurg.2009.01.012.
13. Thakur NA, Plante MJ, Kayiaros S, Reinert SE, Ehrlich MG. Inappropriate transfer of patients with orthopaedic injuries to a level I trauma center: A prospective study. J Orthop Trauma. 2010;24(6):336-339. doi: 10.1097/BOT.0b013e3181b18b89.
14. Wolinsky P, Kim S, Quackenbush M. Does insurance status affect continuity of care for ambulatory patients with operative fractures?. J Bone Joint Surg Am. 2011;93(7):680-685. doi: 10.2106/JBJS.J.00020.
15. Sawaya GF, Guirguis-Blake J, LeFevre M, Harris R, Petitti D, U.S. Preventive Services Task Force. Update on the methods of the U.S. preventive services task force: Estimating certainty and magnitude of net benefit. Ann Intern Med. 2007;147(12):871-875.
44 17. Agency for Healthcare Research and Quality. Statistics for U.S. community hospital ED visits , principal or first-listed diagnosis based on CCS (clinical classifications software), 2009. 2009.
18. Adler NE, Boyce WT, Chesney MA, Folkman S, Syme SL. Socioeconomic inequalities in health. no easy solution. JAMA. 1993;269(24):3140-3145.
19. Sabatini CS, Skaggs KF, Kay RM, Skaggs DL. Orthopedic surgeons are less likely to see children now for fracture care compared with 10 years ago. J Pediatr. 2012;160(3):505-507. doi: 10.1016/j.jpeds.2011.08.020.