Impact of Immigrant Population Share and Candidate Ideology on
Senate Republican Election Outcomes in U.S. Counties, 2010
-2016
By: Zoë Hazerjian
Honors Thesis
Economics Department
The University of North Carolina at Chapel Hill
April 2019
Approved:
_______________________________
Dr. Luca Flabbi
Abstract
In this paper, I study the impact of immigration to the United States on the vote share for
Senate candidates with varying degrees of conservatism in the Republican Party during the
period 2010-2016. This is done by analyzing the proportion of immigrants in a U.S. county,
candidate ideology, and candidate vote share. This paper finds that for the 2012, 2014, and 2016
Senate elections, when immigration levels and candidate ideology are interacted together,
candidates that are more ideologically conservative receive higher vote share in counties with
increasing proportions of immigrants. This paper also finds that for most election years analyzed,
an increase in the overall proportion of immigrants in a county leads to lower vote share for
Senate Republican candidates. Additionally, more ideologically conservative Senate Republican
candidates received lower vote share during presidential election years, but greater vote share
during midterm election years.
Introduction
The United States has a long, complex history with immigration. Immigrants have been a
driving force for population and economic growth in the U.S. and have contributed to the diverse
cultural melting pot that the country is today. The U.S. has a larger immigrant population than
any other country in the world, in absolute terms, and immigration continues to be an important,
sometimes divisive, topic of discussion in U.S. politics. Considering the variation among
immigrants entering the U.S., immigration offers a wealth of topics to analyze and explore.
As various literature indicates, attitudes towards immigrants and views on immigration
may vary depending on exposure to immigrants with different characteristics, or from different
countries of origin. One area of interest is the effect of immigration in politics. A specific area in
need of further analysis is the role of immigration on vote share for more conservative political
candidates. This paper will analyze the effect immigration has on vote share for Senate
Republicans of varying degrees of conservatism in recent years. It may be expected that greater
immigrant share leads to greater vote share for more ideologically conservative candidates. For
further examination into this topic, this paper will also analyze Senate Republican candidate vote
share and their ideology across counties broken up by demographic and political tendencies, as
well as with immigrants from certain regions of origin.
This topic provides a wealth of interesting topics to discuss, considering immigrants
accounted for 13.5% of the U.S. population in 2016 – nearly triple the share of immigrants in
1970 (4.7%) (Migration Institute Policy Data). While the rate of immigration has slowed since
2000, it is projected the number of immigrants will reach 78 million individuals, accounting for
The country of origin of the majority of immigrants entering the U.S. has changed in the
last few decades. In 1960, 75% of the foreign-born population residing in the U.S. was from
Europe, while in 2015, only 11.1% of the immigrant population was born in Europe (Grieco et
al.). Now, a majority of immigrants hail from Latin America and Asia. Additionally, the
geographic distribution of the foreign-born population has shifted. Over the last 50 years, the
distribution of the foreign-born population has shifted from the Northeast and Midwest regions
of the U.S. to the West and South (Grieco et al., 2012).
Recent political events such as the 2016 “Brexit” vote, nationalist and anti-immigration
parties receiving increased number of votes across Europe (The Economist, 2018), and
anti-immigrant rhetoric from elected officials in Latin America, point to the growing nativist
sentiment exhibited across cultures and borders (Encarnación, 2018). In the U.S., debates over
immigration have been the cited source for recent government shutdowns, numerous protests,
and has become an important, and sometimes, defining feature of political candidate’s platforms.
Immigration proves to remain an important topic of discussion in U.S. politics. Analyzing the
role of immigration on voting trends is crucial to understanding the role immigration may play
on the future of U.S. politics.
Approach
This paper will focus on analyzing the vote share of Senate Republican candidates with
varying levels of conservative ideology and levels of immigration at the U.S. county level. OLS
regressions will be run which control for a variety of demographic, economic, and other political
factors. The dependent variable across regressions is vote share for Senate Republican
interaction term between the percent of immigrants in each county and the corresponding
candidate’s ideology score.
It is to be expected that immigration has different effects across counties. In order to slice
the data, and look at the interaction more closely, OLS regressions focusing on total immigration
share for the year 2012 will be run in which “red” and “blue” counties and rural and urban
counties are analyzed. An additional OLS regression for 2012 will be run in which immigrant
levels are analyzed by their geographic regions of origin.
For additional analysis on the effect of immigration on vote share, 3x3 matrices for the
regressions of interest are created which compares the effects of various levels of ideology and
immigrant share. The tables are created such that increases or decreases in vote share are
compared to an “average” candidate; a candidate with a CFscore in the 50th percentile, with
immigration levels that are also in the 50th percentile. The CFscore and immigration levels are
compared at three different levels, those that are in the 25th percentile, 50th percentile, and 75th
percentile.
In order to analyze the relationship between various levels of immigration and vote share
for Senate Republican candidates with varying levels of conservatism, three main data sources
are required. Briefly, these include immigrant population share, candidate vote share, and
candidate ideology scores. U.S. counties will be the established geographic unit of measure. This
is due to limitations set by various sources of available data, and it affords a more local analysis
of the impact of immigration. Additionally, although election outcomes are available at the
district level for a variety of elections across time, district lines are liable to change over time,
This affords analysis of senate elections for the election years during the time period
2010-2016, as detailed immigration data is available at the county-level starting with the 2010
American Community Survey 5 Year Estimate database. It should be noted that 2012 and 2016
are election years, and 2010 and 2014 are the midterm election years post-Obama presidency
campaign runs. Due to the nature of election cycles, the years 2010 and 2016 have nearly all of
the same counties represented (absence due to California counties). Therefore, an additional
analysis is made to compare the 3x3 matrices results of the years 2010 and 2016.
Senate candidates identified use a measure of ideology grounded in an empirical analysis.
The source of this data comes from Bonica's candidate “CFscore” variable generated in the
Database on Ideology, Money in Politics, and Elections (DIME), which is available up to 2016.
This paper will focus on Senate Republican candidates, as the Republican party is the
major-party that is widely associated with more stringent views on immigration policy in the
years discussed.
An OLS regression approach looking at cross section data is useful considering the
limitations set by a small sample of years used. For initial analysis, the election results from 2012
will be discussed more in-depth than the other years, although other years are discussed as well.
It is important to note that each election cycle varies, and each comes with its own unique
political context.
An additional reason why 2012, a presidential election year, is the focus of discussion is
because presidential election years often have higher voter turnout. With higher voter turnout,
this may mean the voting population is more representative of the larger voting eligible
and therefore, only voters who are more politically engaged, which may mean more
ideologically conservative or liberal, turn out to vote. This can be seen in the average voter
turnout percentages for the election years of 2012 and 2016 ( 57.5% and 58.1%, respectively),
versus those in 2010 and 2014 (39.9% and 37.0%, respectively).
When considering these regression results it is also important to note that these results are
for Senate Republican candidates. Other elections of interest such as more local elections, or
Presidential or House of Representatives election results may have different conclusions. For the
2012, 2014, and 2016 elections, increased immigration levels for more ideologically
conservative Senate Republican candidates lead to increased vote share for more conservative
candidates. For midterm election years, candidates with higher CFscores generally do better in
the polls, and during presidential election years, candidates with lower CFscores tend to do better
in the polls.
Literature Review
In order to approach an analysis on the effect of immigration on voter behavior, an
understanding of the basic economic, political, and social theories motivating study on
immigration is useful.
Basic Economic Theory Motivation
The prominent simple labor market competition model predicts that natives will oppose
immigration of those with similar skill levels to them. This theory predicts that in the short-run,
immigrants enter the workforce and thereby increase the supply of labor. Without a
corresponding increase in demand of labor this outward shift in the supply curve leads to
workers oppose the immigration of individuals with comparable skill levels as they can expect to
receive lower wages.
Research into the economic concerns that generate anti-immigrant sentiment among
native citizens notes that labor market competition and concerns about the fiscal burden on
public services due to immigrants motivate natives’ attitudes (Hainmueller and Hiscox, 2010).
Studies also indicate that relatively rich and poor natives are equally opposed to low-skill
immigration in general (Hainmueller and Hopkins, 2014; Hainmueller and Hiscox, 2010).
The research on immigration and resulting wage changes have varied conclusions,
however, several studies have found evidence that does not support the basic labor market
competition model under certain circumstances. Studies using inter-county trade flows have
indicated adjustments in industry structure can absorb new supplies of labor with little or no
change in wages (Card et al., 2005). The National Research Council study concluded that
immigration has only a small adverse impact on the wage and employment opportunities of
competing native-born groups, and that immigration is unlikely to have substantially affected the
wage or job prospects of the average native-born worker (Levine, 2009). However, if immigrants
are concentrated in particular geographic areas, native workers who live in those communities
and possess characteristics similar to immigrant workers may be affected (Levine, 2009). With
the understanding that the effect of immigration may play a more significant role in concentrated
geographic areas with varying demographics, this paper will focus on immigration at the county
level.
According to a recent study on the fiscal impacts of immigration, the extent that
the state and local level (Orrenius, 2017). However, the expectation that immigrants pose a larger
financial cost than benefit may vary with age structure. For example, in countries with aging
populations, immigration may offer a net benefit, as immigrants “tend to be in their prime
working years and can contribute to a favorable readjustment in the age structure of the
population” (Card et al., 2005).
However, native’s attitudes towards immigration may not be solely based on economic
self-interest, and skill level may not be the only factor which shapes native’s perceptions of
immigrants. There may also be “non-economic concerns associated with ethnocentrism or
sociotropic considerations about how the local economy as a whole may be affected by
immigration” (Hainmueller and Hiscox, 2010).
Political Science and Social Theory Motivation
There is a strong interest in understanding the implications immigration has on political
activity and election outcomes by political scientists. One way of analyzing the relationship
between immigration and native citizen’s behavior is looking at immigration in a certain
geographic area and the corresponding voting behavior of natives in the same area.
Results from one study showed “the marginal impact of new immigrants on the
Republican vote turns positive when the share is very high, i.e. when recent immigration
becomes...a salient policy issue in voters' minds” (Maya et al., 2016). Yet this same study found
that the impact of immigration on average, across all election types in the U.S., has a negative
impact on Republican vote share (Maya et al., 2016). The questions asked in this paper differ
from Maya’s research, as this paper will explore the role of candidate ideology and how this
Republican candidates together as other research has analyzed, this paper seeks to distinguish the
impact of immigrants on voter support for Republican candidates of varying ideology.
As the labor market competition model implies, immigrant’s skill level may play a large
role in native’s attitudes towards immigration. A recent study found that counties with higher
levels of unskilled immigrants had higher levels of vote share for the Republican Party, and
counties with higher levels of high-skilled immigrants are associated with a decline in
Republican party vote share (Mayda and Peri, 2018). Once again, relative to these studies, this
paper contributes to this literature through closer analysis of the Republican candidate. While
this paper does not group immigrants by skill-level, this paper groups immigrants by geographic
region. By looking into these different immigrant-groups’ effect on voting behavior toward more
conservative Senate candidates, this paper bring new insight into the role immigration plays at
the polls.
European studies in political-economic theory and psychology have found that country of
origin is influential in people’s perceptions of low-skill immigrants (Helbling and Kriesi, 2014;
Ford et al. 2012). Additionally, literature finds that “while the perception of economic gains from
immigrants varies by skill level across natives, it is the perception of the impact of immigrants
on local culture and amenities that drives their policy preference” (Card, Dustman, and Preston,
2012). Attitudes towards immigrant’s origins are also explored in the U.S.; a study comparing
American and Canadian attitudes towards immigration found that American respondents are
As shown through various studies, immigrant skill level and economic concerns may not
be the only motivating factor which shapes natives’ attitudes toward immigration. It is suggested
that there are also psychological factors that affect an individual’s attitude toward immigration.
One leading theory in social psychology is the Realistic Group Conflict Theory. When
applied to immigration, this theory presumes that competition between immigrants and natives
for finite resources translates into intergroup stereotypes, antagonism, and conflict, while also
bolstering within-group cohesion (Schofield, 2010). Card notes this theory can be applied to the
political realm, where the “dimensions of perceived inter-group competition include political
power and control over accepted social and cultural practices” (Card et al., 2005).
Another theoretical model includes the Social Identity Theory. This theory suggests that
people look for favorable similarities, and differentiation between their own group and outside
groups. This may lead to discrimination and prejudicial views towards others in order to increase
their own group’s social identity. This theory applied to immigration supposes that natives may
hold prejudice attitudes towards immigrants in order to hold a more positive or favorable view of
their own identity.
Conversely, this theory can be applied where natives focus on their favorable similarities
with immigrants, thereby fostering more favorable views towards immigrants and immigration.
Card notes that natives’ various notions of other countries’ “tradition(s) of emphasizing fairness
and social justice ... could be helpful in explaining cross-country differences in opinions toward
immigration” (Card et al., 2005). Therefore, the attitudes of natives towards immigrants in each
county in the U.S. may vary based on the characteristics of the county and respective the
Now turning to election outcomes in the U.S., another branch of political science has
analyzed the trend towards party polarization and candidate-extremism. A recent survey
conducted by the Washington Post found that Republicans and Democrats in the U.S. are more
polarized on immigration than parties in the U.K. or Australia (Kefford and Ratcliff, 2018). This
study points to recent U.S. political events, such as the current U.S. administration’s travel ban
on five majority-Muslim countries and border wall plans for prompting Democratic push back,
leading Democrats to shift more left on immigration policies (Kefford and Ratcliff, 2018).
Electoral competition theory suggests that candidates should have to adopt a more
moderate ideology to win majority support. A study by Hall found that a when a party has a
chance to nominate a more moderate candidate, but instead nominates an extreme candidate, the
candidate may lose as much as seven points of vote share in the general election (Hall and
Thompson, 2017). This loss of vote share for more extreme candidates may be due to a variety of
factors — two often noted are mobilization and persuasion. Extreme candidates mobilize both
their own party’s base, but also the opponent’s base — perhaps leading a total net loss in voter
turnout. Hall also points out that extreme candidates may lose those voters that habitually vote
for their party to the opposing party, whereas moderate nominees tend to hold these voters.
This paper provides cross-section analysis on midterm and presidential years. There is a
wide range of voter turnout throughout these elections. While there exists a control for voter
turnout in each election, related literature has noted that low turnout in partisan legislative
elections means that winners are chosen in primary elections by small samples of partisan
extremists (Tucker, 2004). Therefore, when considering the regression results, the particular
What is considered “moderate” has evolved over the last few decades. A Brookings
Institute compilation reported that the average ideology of Senate Party Coalitions from the 80th
to 113th Congress (years 1947-2014), for both Democrats and Republicans have grown more
ideologically extreme. Additionally, the Republican party has become far more conservative than
the Democratic party has become liberal (Brookings Institute, 2014).
How does immigration, and attitudes towards immigrants play out in political elections?
As a study in Denmark noted the effects of immigration, either real or perceived, may also leave
their mark on the political scene. For example, “immigration [encourages] the rise of new
anti-immigration parties or the growth of those already existing as immigrant numbers rise”
(Gerdes and Wadensjö, 2008). Studies conclude that fears about increased labor market
competition from immigrants strongly shape voters’ attitudes towards immigrants (Scheve and
Slaughter, 2001; Mayda, 2006).
Immigration is an important part of party ideology, and is an issue that distinguishes
candidates, and may draw voters to one candidate over the other. A recent Gallup poll found that
20% of U.S. registered voters indicated “they will only vote for a candidate who shares their
views on immigration, with another 60% saying it will be one of many important considerations
they take into account” (Jones, 2015).
Empirical studies in Europe, such as Harmon’s (2012) study in Denmark, have shown
that immigrant inflows have led to increased support for right-wing parties. In a similar vein,
Brunner and Kuhn (2014) looked at the relationship between the cultural distance between
found that the greater the cultural distance between natives and immigrants, the greater share of
votes were cast in favor of anti-immigration bills.
One may simplify the nature of U.S. political races as North vs South, or “blue” state vs
“red” states. However, within most states there is much variation in voting patterns and
behaviors. While a whole state may be characterized as a red state, located in the deep south, and
therefore strongly associated with the Republican party, there may be strong support for the
Democratic party in various “blue” counties throughout the state, which do not receive much
media coverage or recognition. Wyoming is considered one of the more conservative states in
the U.S., however, the state has many “liberal” cities that support democratic candidates. For
example, in 2012 Presidential candidate Mitt Romney won Wyoming with 68.64% vote share,
however in Teton County, 54.7% of residents cast a ballot for Obama (CQ Elections Collection).
Because each state, and smaller regions within each state have a unique history, a variety
of demographics, and diverse political history, this paper explores how immigration and
candidate ideology affects Senate Republican vote share in 2012, by looking at this relationship
in “blue” and “red” counties as well as rural and urban counties.
In wrapping-up these various theories and empirical studies together, it appears that
native’s attitudes towards immigrants may not be solely charged by economic behavior, but also
by psychological attitudes. Additionally, immigration is an important distinguishing feature of a
candidate’s platform and is a topic of interest which affects voter behavior. States are made up of
diverse local areas, and therefore looking at voting behavior divided by certain political and
immigration across counties. Finally, more moderate candidates tend to do better in the polls, but
Senate Republicans have grown more ideologically conservative over the past several decades.
This paper will attempt to analyze the effect of immigration on U.S. voter behavior by
building off the studies that have addressed the role of immigration in political-candidate
ideology and voting behavior. This paper brings to light a new question: Does greater immigrant
share lead to greater vote share for more ideologically conservative Senate Republican
candidates in the U.S.? For further analysis into the role immigration may play in voter’s
political preferences, this paper will also analyze this relationship in rural and urban, and “red”
and “blue” counties, as well as analyze whether greater shares of immigrants from certain
regions lead to greater vote share for more ideologically conservative Republican Senate
candidates.
Empirical Model
There are economic and sociological theories which suggest that native attitudes towards
immigration vary according to a variety of factors and characteristics of both the respective
native citizens and the immigrant population. It is to be expected, therefore, that attitudes
towards immigrants vary throughout the U.S, and that these attitudes may play varying degrees
of importance at the polls.
One theory explored in this paper is that with greater shares of immigrants in a county,
there will be greater anti-immigrant sentiment expressed by the local population, leading to
higher vote share for more conservative candidates. On the other hand, it may also be true that a
greater share of immigrants in a county instead leads to locals holding more favorable views
One central challenge to looking at immigration data is the demand-driven location
choices made by immigrants. It is noted that mobility is likely geographically limited by
employment, family history, and other historical notions (Dustmann and Preston, 2001 & Card,
2001). Additionally, it can be supposed that immigrants tend to choose to live in areas with other
immigrant populations, and that immigrants may move to more economically booming areas in
search of work. It is suggested, therefore, to use an IV method to account for such endogeneity.
Those familiar with using an IV strategy for immigration analysis such as Card, address
this demand-driven challenge by using an instrument based on the existing locations of
immigrant enclaves (Card, 2001). For the IV strategy to be meaningful, the factors that affect
immigration must have dissipated over time, meaning historical immigrant data several decades
old should be examined. With the county-level geographic area defined in this paper, this
becomes difficult due to limited historical data.
Keeping this limitation in mind, the main regressions discussed in this paper will analyze
the proportion of immigrants in a county in the respective years identified. An IV is used in a
robustness check that will follow in lines of the IV used by Dustmann and Preston (2001), and
Brunner and Khun (2014). Both papers use an IV approach in which immigration data is
aggregated at a larger geographic scale in order to estimate the effect of immigration on natives’
attitudes.
The main assumption for this instrument is that the immigrant composition of the larger
geographic region is beyond the control of individuals and is therefore determined by various
factors outside of native’s attitudes towards immigrants. It is also assumed that there is a high
for analyzing local immigration in context (Dustmann and Preston, 2001 & Brunner and Kuhn,
2014). Therefore, a robustness check making use of state-wide immigration data as an
instrumental variable is analyzed. The IV method is utilized for total 2012 immigration as well as
2012 immigration by rural and urban counties.
An additional robustness check is run in which state dummy variables are generated. In
keeping with the focus of this paper, this robustness check is run in an OLS regression for 2012
in which total immigrant share of counties are the focus interest.
In order to look at the interaction between candidate ideology, immigrant county
population share and candidate vote share, data for the 2010, 2012, 2014, and 2016 Senate
Republican elections are analyzed. As discussed, focus of the analysis will be on 2012 data.
The proportion of votes for candidate a ,in county c is the dependent variable y cwhich is
defined as:
y
c=
(
(
Pac)
00
1−Pac
* 1
)
The equation of interest will be:=
+
+
+
+
y
cα
0α
1 IcPc
α
2CF
aα
3CF
IcP c a
+
χ
′cα
ε
cWhere the α1is the coefficient of the immigrant share of county population and α2is the
coefficient of the candidate ideology score in county c. The coefficient of the interaction term
between the proportion of immigrants and the Senate candidate CFscore, α3, is of particular
interest in the analysis. The term χ′cα is used to notate the additional controls used. These include
county-level demographics, as well as state level economic and political factors. As these include
noted at the county level as well. The error term, εc, captures the remaining factors affecting the
Republican vote share.
Data Description
In the U.S., many election results are reported at the district level. Using districts for
election analysis over time can be difficult however, as district lines may be altered, depending
on which political party is in power and who drew or redrew district lines. Therefore, keeping in
mind the limitations provided by other data sources used in this paper, general U.S. Senate
election data reported at the county-level will be used.
As of 2016, there were 3,007 counties, 64 parishes, 19 organized boroughs, 10 census
areas, 41 independent cities, and the District of Columbia for a total of 3,142 counties and
county-equivalents. Due to various missing data, and the absence of a senator representing the
District of Columbia, the total number of counties analyzed over the four election cycles is
3,111. In the year 2012, which is the year more closely discussed, the data looked at contains a
total of 1,876 counties.
The CQ Press Voting and Elections Collection provides voting data for a variety of
election results and is the source of data for the county-level election results used in this paper.
As senators serve six-year terms and elections are staggered, this means approximately one-third
of senate seats are up for election every two years.
The immigration data used in this paper comes from the U.S. Census Bureau American
Community Survey 5-Year Estimatesdata. The ACS provides county-level data for Place of Birth
for the Foreign-born Population in the United States (Excluding Population Born at Sea) for the
afford the most available detailed data at the smallest geographic unit available. Key immigration
controls were constructed by converting the raw number of immigrants in each county into
percentages. A histogram of the immigration share data for 2012 (the year of focus for this
paper), is noted in Graph 1.
The focus of this paper is on the total share of immigrants in a county, however, as
various studies have also pointed out, people may hold different attitudes towards immigrants
with different backgrounds. Therefore, this paper will also look county population share of
immigrants from six different geographic regions — North America, Southern/Latin America,
Europe, Asia, Africa, and Oceania.
Candidate ideology is drawn from the Database on Ideology, Money in Politics, and
Elections v3 (DIME). The DIME database was developed by Adam Bonica of Stanford
University as part of the project on Ideology in the Political Marketplace. Version 3 of the DIME
contains over 250 million donations made by over 20 million donors (both individuals and
organizations) to local, state, and federal elections, spanning over a period from 1979 to 2016
(Bonica et al. 2018). The measure of candidate ideology generated is the “CFscore.” This score
is calculated by “placing candidates on a unidimensional ideological scale on the basis of their
share of common donors. Individual donors are then placed on the same scale on the basis of the
weighted share of the donations given to candidates. The scale is normalized such that it has an
average of 0 and a standard deviation of 1” (Bonica et al. 2018).
It is important to note that many candidates run in multiple elections, and therefore, have
the opportunity to receive different CFscores across multiple elections. This is because the
each new election cycle. It will be important to consider each candidate’s CFscore in relation to
their election year, not the candidate themselves, as a measure of candidate ideology.
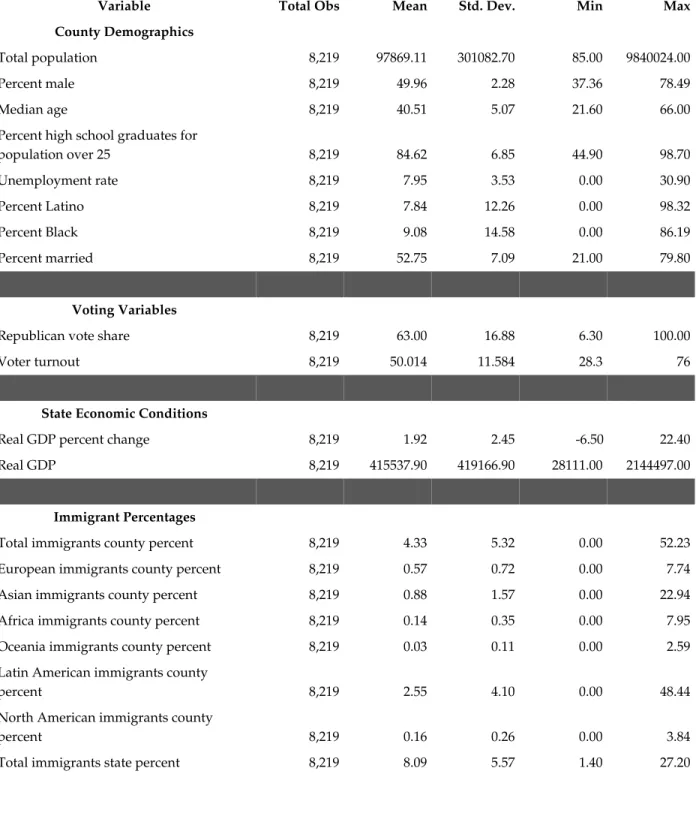
The controls used in the empirical model follow the controls used in existing literature
which is focused on vote share and immigration trends, such as Maya et el. (2016), and
DellaVigna, Kaplan (2007). The data comes from the ACS 5-Year Estimates data, and includes
county-level demographics, as well as state-level economic and political factors. The
county-level demographics include the total population of the county, median age, percent male
population, percent married (for the population 15 years and over), percent of the population that
is Latino, percent of the population that is Black, the unemployment rate, and the percent of the
population 25 years and older that are high school graduates.
The state-level economic condition controls include real GDP and the percent change in
real GDP from preceding period. State level political environment dummy controls include
whether there was a gubernatorial election the same year as the senate election, as well as
whether the governor in power was an incumbent or a Republican, and voter turnout reported at
the statewide level. Finally, dummy controls are created for states that border Mexico and
Canada, and whether states are considered part of the traditional deep south.
For the regressions focused on distinguishing between heavily Republican versus heavily
Democrat counties, those considered “red” are those with Republican vote share greater than
60%, “blue” counties are those with vote share less than 40%. The regression which
distinguishes counties by rural or urban pulls from the Census Bureau’s County Rurality Level
of the 2010 Census). Counties with less than 50% of the population living in rural areas are
classified as urban, and counties with 50% or greater are classified as rural.
Empirical Results
The following results examine the effect of increasing immigrant population share and
increasing candidate ideology scores on the vote share of Senate Republican candidates. The
focus of the analysis will be on the regression output concerning the year 2012, however the
other years of interest will be discussed as well.
The interaction term coefficient should be analyzed as the effect on candidate vote share
with a one percentage point increase in immigrant share along with a one unit increase in a
candidate’s ideology score. It is hypothesized that if voters in a county hold negative views
towards immigrants, this interaction term will be positive, and if voters hold more positive views
towards immigrants, this interaction term will be negative, or perhaps an insignificant variable.
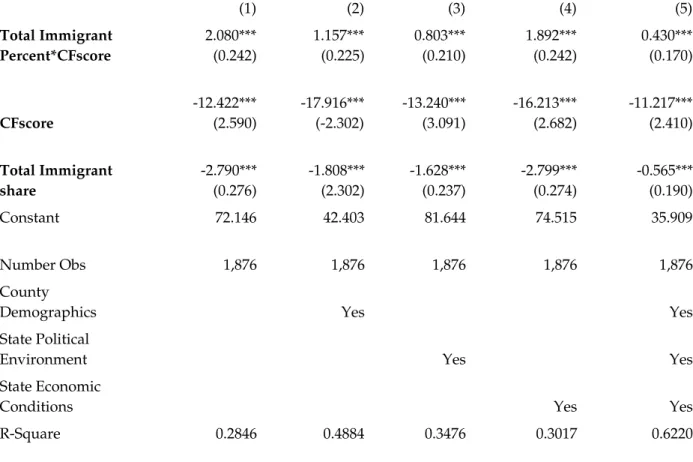
Table 1 shows the year 2012’s summary statistics. The results in Table 2 show the effect
of total immigration share of county population and Senate candidate ideology on the proportion
of votes the Senate Republican candidate received. The first column shows the raw estimates
without any added controls. These results suggest that an increase in the interaction term causes a
2.080% increase in vote share for Senate Republican candidates. This interaction term effect on
vote share when county demographics, and state political and economic conditions are controlled
for are presented in columns (2) - (5). Each set of controls decreases the effect of the interaction
term compared to the raw estimates.
Column (3), which controls for state political environment variables has the largest drop
effects shown in the raw interaction term are showing some of the correlation between the
interaction term and the statewide political environment. This highlights that the political
conditions of each state, and each election, such as voter turnout and whether the state is in the
south, plays a relatively significant role in Senate Republican vote share.
Column (5) examines the interaction term when all controls are added. As column (5)
indicates, if one looks at the median county and candidate, a one percent increase in total
immigrants interacted with a one unit increase in candidate ideology leads to a 0.430% increase
in vote share for Senate Republican candidates, which is significant at the 1% level. Put into
perspective, this is a fairly large increase in vote share, considering the average number of
immigrants in a county in 2012 was 4.998%, and elections tend to be close races, often decided
by only a few percentage points.
Additionally, results from Table 2 column (5) show that when looking at a median county
and candidate, an increase in CFscore by one unit leads to a -11.217% decrease in candidate vote
share, at the 1% significance level. This supports that theory that overall, more moderate
candidates earn higher vote share, or, in other words, more extreme candidates are punished at
the polls. The county immigrant percent variable indicates that a one percent increase in
immigrants leads to a decrease in Republican vote share of -0.565%, which is significant at the
1% level. These results are consistent with previous studies that find that an increase in
immigrants generally leads to increase vote share for Democratic candidates.
As Table 2 indicates, the effect of CFscore is quite large, as seen by the large negative
coefficient, while the effect of immigration share and the interaction term are relatively smaller.
for candidates are looked at in comparison to a candidate with a medium ideology score in a
county with a medium share of immigrants.
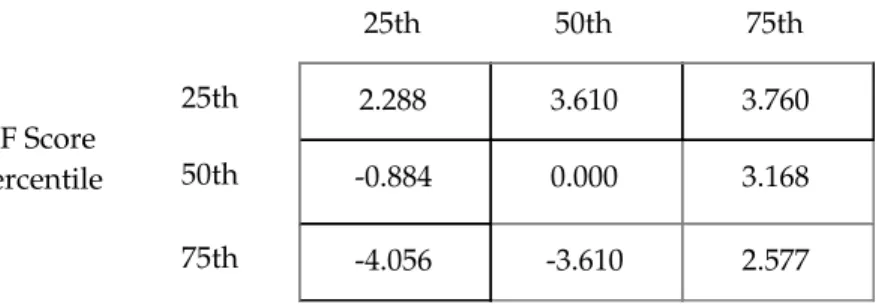
Table 3 is constructed in which the effect of 25th, 50th, and 75th percentile levels of
immigration and candidate ideology on Senate Republican candidate vote share is looked at
relative to an “average” candidate, or put another way, a candidate with medium ideology in a
county with medium immigration levels, i.e. 50th percentile for both CFscore and immigrant
share.
The results in Table 3 show that compared to an “average” Senate Republican candidate,
those with 25th percentile CFscores earned higher vote share overall. Across all CFscore
percentiles, the vote share of a candidate increased with increasing levels of immigrant
population share. In fact, for immigrant shares in the 75th percentile, all CFscore percentiles
received an increase in expected vote share compared to an “average” candidate. It appears that
candidates with 25th percentile CFscores received the largest increase in vote share with
immigrant shares in the 75th percentile. For those with CFscores in the 50th and 75th percentile,
immigration in the 25th percentile (and 50th percentile for CFscores in the 75th percentile) leads
to a decrease in vote share. For CFscore candidates in 75th percentile, immigrant share has a
negative impact on them at the polls, unless the share of immigrants is high. The greatest change
in vote share across immigration percentile levels is seen in 75th percentile CFscore candidates.
The results suggest that less ideologically conservative candidates garnered higher vote
than “average” or high CFscore candidates, even in counties with higher shares of immigrant
populations. Additionally, across all levels of CFscores, an increase in immigrant share leads to
CFscores can expect less vote share than an “average” candidate with lower levels of
immigration, but when immigration share is at the 75th percentile, this becomes a positive factor
for 50th and 75th percentile CFscore candidates.
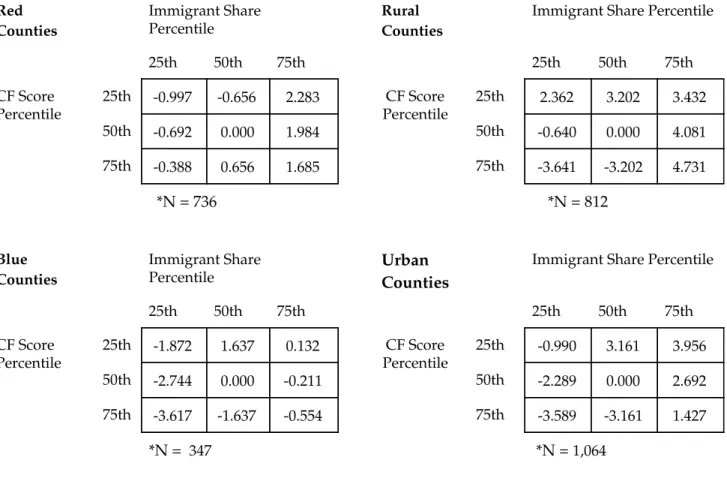
There appears to be heterogeneity in the effect of immigrants across counties. The
relationship between immigration, ideology, and vote share is explored in more detail in the
matrices found in Table 4, through analyzing vote share changes in "blue" and "red", and rural
and urban counties. Similar to the Table 3 results, in the “red” counties (i.e. Republican vote
share greater than 60%), for each CFscore percentile, as immigrant share percentile increases, so
too does the vote share received by Senate Republican candidates. Unlike the results in Table 3,
for immigrant shares in the 25th and 50th percentile, the 75th percentile CFscore candidates
received the greatest increase in vote share. It is interesting to note that in “red” counties, 75th
percentile immigration shares leads to the largest increase in votes for CFscore candidates in the
25th percentile. Additionally, the only positive impact on vote share that all CFscore candidates
receive is with immigration in the 75th percentile.
In the rural county matrix, for 25th and 50th percentile immigration shares, lower
CFscore candidates receive higher vote share, whereas when immigration share of a county is in
the 75th percentile, counties see higher CFscore candidates do better at the polls. Similar to
Table 3, and the results of the “red” county matrix, for each level of CFscore, there is an increase
in vote share with increasing levels of immigration.
These results from the more typical “pro-Republican” counties indicate that similar to the
overall 2012 results, candidates receive higher vote share with an increasing share of
in the rural and overall 2012 results (compared to the “red” and rural counties), as seen in the
larger change in vote share across candidates with increasing levels of immigration.
Additionally, while in the overall 2012 results lower CFscore candidates received greater vote
share than lower CFscore candidates, in the "red" counties, 25th and 50th percentile CFscore
candidates received greater vote share than an lower CFscore candidates, and in rural counties,
75th CFscore candidates received greater vote share than lower CFscore candidates.
The additional matrices in Table 4 are those from “blue” counties (i.e. Republican vote
share less than 40%), and urban counties, as defined by the Census Bureau. The “blue” county
results have a different pattern that is similar to the 2016 regression results found in Table 10
(Table 10 results discussed below). Low CFscore candidates have higher vote share across all
levels of immigrant population shares, which is similar to the overall 2012 regression matrix in
Table 3. Unlike Table 3, in “blue” counties, the 75th percentile CFscore candidates receive lower
vote share than an “average” candidate across all immigrant share percentiles. Additionally, in
“blue” counties, the only candidates that experienced an increase in vote share compared to an
“average” candidate are those in the 25th percentile of CFscore, and 50th or 75th percentile
immigrant share. Finally, an interesting pattern is seen in the 25th and 50th percentile CFscore
candidates, as such candidates receive highest vote share with immigrant share in the 50th
percentile, which is not seen elsewhere.
The results from the urban counties matrix indicate that lower CFscore candidates
received higher vote share across all levels of immigrant population share. Additionally, there is
greater change in vote share across immigrant share levels for each CFscore candidate compared
75th percentile CFscore candidates, in urban counties, such candidates receive 1.427% greater
vote share than an “average” candidate.
The results from Table 4 highlight the fact that immigration has heterogeneous effects
across counties. These effects are explored by looking at immigration, ideology, and vote share
in counties which vary by voting behavior and population density. These results when analyzed
show similarities and differences to the overall matrix results which do not group counties in any
particular fashion. The theory that more conservative candidates do better in the polls with
increasing shares of immigrants is supported by the results found in “red” and “blue” matrices as
well as in the rural and urban matrices.
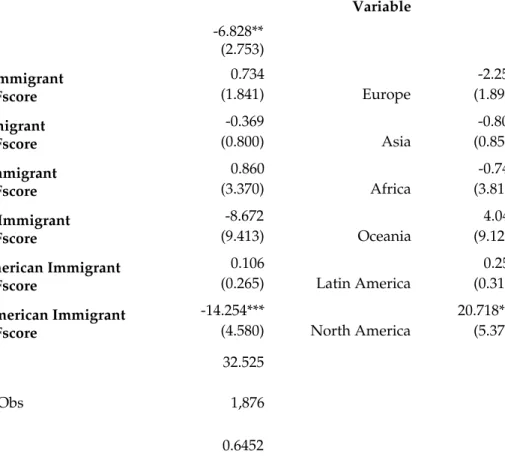
In order to look more closely at the differences among immigrants, and if, and how, this
impacts the vote share for more ideologically conservative Senate Republican candidates, Table
5 explores the region of origin of immigrants and the corresponding effect on vote share (across
all counties). Interaction terms are generated with CFscore and immigrants from Europe, Asia,
Africa, Oceania, Latin America, and North America. As Table 5 indicates, very few variables
were statistically significant. The CFscore in Table 5 is significant at the 1% level and is close in
scale to other CFscore coefficients. The only statistically significant interaction term is the term
with immigrants from North America, which leads to a -14.254% decrease in Senate Republican
vote share. Additionally, with a one percent increase in the share of North American immigrants
in county, there is a positive 20.718% effect on vote share, at the 1% significance level.
However, the average share of North American immigrants is 0.191%, meaning this large
positive coefficient when played out in real Senate elections is likely to contribute to only a few
A robustness check is run for the 2012 total immigrant share OLS regression in which
state dummy variables are created. For this check, a total of 33 state dummies were created, the
main coefficients of interest are the interaction term (0.287%), CFscore (-6.981%), and
immigrant share (-0.423%). The OLS regressions results in this robustness check are close in
scale and follow similar sign patterns for the coefficients of interest in the 2012 total immigration
OLS regression result without state dummy variables.
As discussed, there are various threats to dealing with immigration data specifically, as
well as voting outcomes. Some counties have persistent features, which may be appealing to
immigrants and may play a role in determining where immigrants decide to live. These include
economic opportunities, cultural and heritage factors, geographic and locational preferences, and
institutional features. By including various controls at the county and state level, this may reduce
some of the omitted variable bias, but it does not eliminate all bias.
Researches in the field of immigration have used a variety of instrumental variables to
account for such endogeneity. One method is to use aggregated immigration data as an
instrumental variable for more local immigration data. The idea for this instrument is that using
immigration data from a wider geographic region dissipates some of the endogeneity from
immigrant’s location choices that found at the more local level.
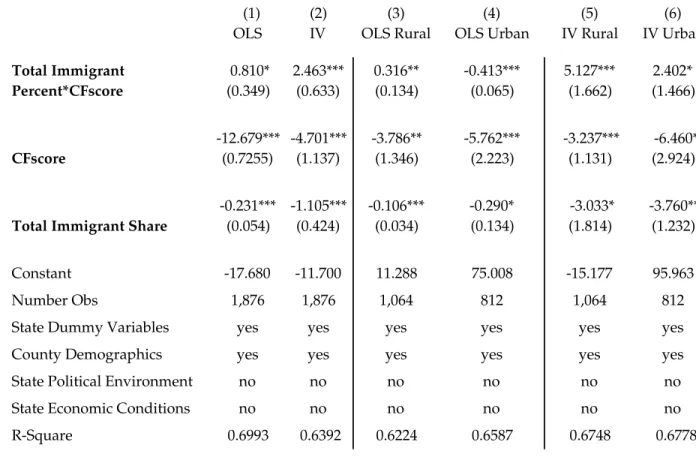
Table 6 is an attempt to use an instrumental variable approach to account for some of the
bias. The instrument used is immigration data aggregated at the state-wide level, and the
geographic area looked at is broken up by rural and urban, both using the IV and OLS regression
is run for the regression results, in which the first-stage F statistic exceeds 10, thereby indicating
this instrument passes a relevancy test.
The results in Table 6, columns 1 and 2 compare the OLS and IV regressions for 2012,
total immigrant share interaction term, and are inclusive of all counties in the 2012 election. An
analysis of the three terms of interest indicate that the interaction terms have a positive
coefficient, while the CFscore and total immigrant share terms both have negative coefficients. It
appears that the IV coefficient results in column 2 are larger in scale than their OLS counterparts.
This is seen throughout the other columns in Table 6. Columns 3 and 5 show the OLS and IV
regression results for total immigrant share in rural counties in 2012. The results show the
interaction term leads to a 0.316% increase in vote share for Senate Republican candidates in the
OLS regression, and a 5.127% increase in rural counties in the IV state-wide immigration level
regression. The signs still follow a similar pattern across rural counties as seen in columns 3 and
5, however, for urban counties (columns 4 and 6), the interaction term in the urban OLS column
is negative and is statistically significant at the 1% level, whereas the urban IV column
interaction term is positive at the 10% significance level. Rural counties (columns 3 and 5) in
Table 6 have a larger increase in vote share than urban counties (columns 4 and 6, respectively)
for a one unit increase in the interaction term. Additionally, in rural counties, Senate Republican
candidates are “punished less,” or receive a smaller decrease in vote share with increasing levels
of CFscore and immigrant share. Or, put another way, for the OLS and IV regression results,
Senate Republican candidates garner less vote share for increasing levels of conservatism and
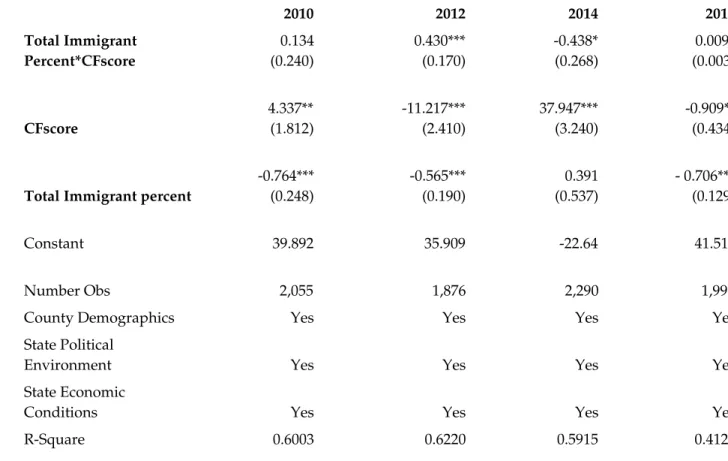
Table 7 offers average summary statistics across the years 2010 — 2016, it should be
noted that each years’ variable summary statistics vary slightly, but for ease of discussion, Table
8 presents average statistics across the four years. Table 8 provides the OLS regression results
focusing on total immigrant shares. Because each year represents a different combination of
states, generalized patterns for each year can be analyzed, but time series data would be
interesting and insightful, in order to explore the various relationships between immigrants and
vote share across time.
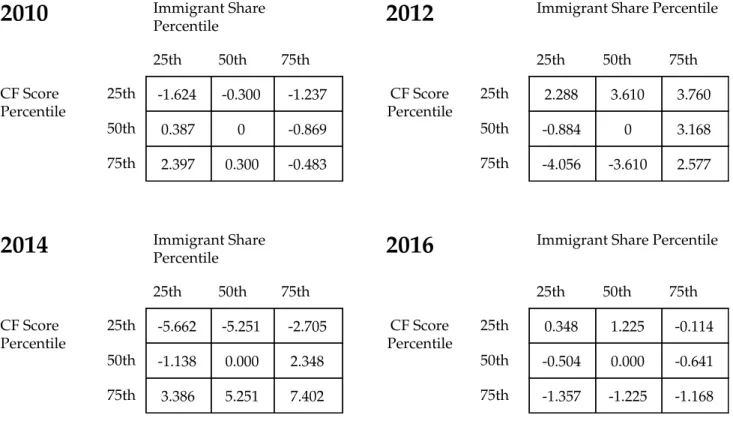
To begin the discussion of the results from the four different election years, the matrix
results from 2010 and 2016 will be compared. The years 2010 and 2016 have 1,995 of the same
counties represented in a Senate Republican election, due to the Senate election cycle occurring
roughly every three years across each state. There were 63 counties unmatched counties between
2010 and 2016. This is due to the unique election cycle in 2016 in which California had two
Democratic candidates run for office and did not have a Senate Republican up for election.
There are various similarities across 2010 and 2016. For example, for counties with
immigrant share in the 75th percentile, Senate Republican candidates of any CFscore can expect
to see a decrease in vote share compared to an “average” candidate. Also, for candidates with
CFscores in the 25th percentile, they can expect the greatest vote share in counties with
immigrant share in the 50th percentile (as opposed to immigrant share in the 25th or 50th
percentile). However, there are also changes between 2010 and 2016. Noticable differences
include that higher CFscore candidates receive greater vote share in 2010 across all immigrant
share levels, and in 2016, lower CFscore candidate receive greater vote share. Additionally, in
decreasing share of immigrants, however, in 2016, 75th percentile CFscore candidates receive
greater vote share with decreasing levels of immigration, and 50th percentile CFscore candidates
receive greater vote share with immigrant share in the 50th percentile.
These results show that while there are some similarities across time with the counties
represented in 2010 and 2016, there may be additional patterns and observations to draw from by
comparing and contrasting the Senate election years which coincide with midterm and
presidential election cycles. For example, another way to discuss the results in Table 8 is to
consider the results from 2012 and 2016, as these are both presidential election years. Although
the particular states which held senate elections differ, because both years are presidential
election years, there may be more normal distribution of voters (with respect to their ideology)
that showed up at the polls.
The CFscore and county immigrant percent share coefficients in 2016 are negative and
significant at the 1% level. However, it appears that more conservative Senate Republicans were
not “punished” as severely in comparison to 2012. This is seen in the coefficient for CFscore,
which indicates that in a median county, an increase in a candidate’s conservative ideology score
by one unit is meet with a -0.909% decrease in vote share in 2016, as opposed to the decrease in
vote share of -11.217% in 2012. The particular nature of the 2016 election cycle, such as the
Republican presidential nominee, Trump stirring up support for more ideologically conservative
candidates, could be responsible for some of this variation, it could also be due to the nature of
the candidates in the 2016 election. Nearly 80% of the 2016 Senate Republican candidates were
incumbents, and as compared to only 13% incumbent candidates in 2012. Additionally, 2016 had
Continuing a discussion of Table 8, the midterm election results of 2010 and 2014 are
discussed as well. Similar to the 2012 column results, a higher percent share of immigrants in
2010 led to a decrease in Senate Republican vote share of -0.764% which is statistically
significant at the 1% level. A higher CFscore actually benefited Senate Republican candidates in
2010 and 2014, as seen in the positive and statistically significant coefficients for CFscore. This
may be due to the specific nature of the candidates up for election, or perhaps, only the more
politically engaged voters who hold stronger, and more conservative political views actually
show up for these midterm elections.
Perhaps there was greater motivation among the more conservative voters who were
dissatisfied with the previous Obama presidency wins, which drove them in greater number to
the polls. It is also helpful to note that in 2014, there were 36 Senate races, of which the
Republican Party won 24. This net gain of nine seats was the largest Senate gain in a midterm
since 1958. For the various states with senate elections, immigration may have been a more
salient issue leading to the unique 2014 results, or perhaps more conservative candidates were
rewarded in the polls due more voters seeking to engage in the midterm elections after President
Obama’s second presidential win.
Table 9 provides 3x3 matrices for the results in Table 8. These results present the
expected vote share candidates in different scenarios can expect in comparison to an “average”
candidate, by taking into consideration the share of immigrants, CFscore, and the interaction
term. For the midterm election years (2010 and 2014), higher CFscore candidates receive higher
vote share than their respective candidates for each level of immigration share. This contrasts
outperform other candidates in each respective level of immigration share. Additionally, the
2010 results seem unique in respect to the findings that 75th percentile CFscore candidates
received higher vote share with increasing levels of immigration. For 2012, 2014, and 2016, 75th
percentile CFscore candidates receive greater vote share with increasing levels of immigration.
It is possible again that these results are related to the specific characteristics of the
candidates in each election. For example, 2012 remains the year with the lowest number of
incumbent candidates (13% compared to 35%, 40%, 80% for years 2010, 2014, 2016,
respectively). Perhaps during election cycles in which many nonincumbent candidates run, more
conservative candidates do better at the polls with higher immigrant population share, but for
election cycles and races in which established candidates run, the more conservative candidates
earn higher vote share with lower immigrant share.
Conclusion
Immigration has played and continues to play an important role in shaping the U.S.
culturally, economically, and politically. Given recent events in politics such as the rise of
nationalist parties, anti-immigration rhetoric used by candidates, and policies created with the
intent of tightening immigration, immigration is a topical subject with future political and
economic implications.
Much literature has analyzed the impact of immigration at the polls by studying the effect
of high versus low skilled labor. However, given the current trend in U.S. politics towards more
polarization, there is need for further study on the role immigration may play in the success of
and immigration and voting data across four Senate general elections, from years 2010 - 2016 to
analyze the impact that immigration and candidate ideology has on vote share.
The results from the various regressions show that the election year, and the
characteristics of the larger candidate pool are important indicators for Senate Republican
candidate success. During the 2012, 2014, and 2016 elections, an increase in immigrant share of
a county population for more conservative candidate lead to an increase in vote share for Senate
Republican candidates. This same relationship does not play out in the year 2010 however. When
focusing on candidate ideology scores, more conservative Senate Republican candidates can
expect a decrease in vote share in presidential election years. This contrasts with the midterm
election years analyzed which finds that Senate Republican candidates receive higher vote share
with increasing levels of conservative ideology.
There are strong indicators that the effect of immigration varies across counties. The
“types” of counties explored in this paper were rural and urban counties, as well as “red” and
“blue” counties. The differences in vote share received across candidates of different CFscores
and different levels of immigration in rural and “red” counties versus urban and “blue” counties
indicate that looking at the role of immigration in specific political and demographic context of
the local area adds an additional layer to the analysis.
Specifying immigrant share by immigrants from different regions of origin, as this paper
analyzed in 2012, is somewhat inconclusive, as looking at immigration levels from continents
yielded many statistically insignificant variables. This provides an opportunity for further
analysis into the effect of immigration at the polls. Perhaps immigrant region of origin matters
Both immigration levels and candidate ideology are variables which have shifted over the
course of American history. This paper focused in on four recent elections, and found different
patterns depending on the election year and election cycle. To add to the discussion of the
patterns analyzed in this paper, additional research into election results over a longer period of
time would be useful. Additional study into the historical effect that immigration and candidate
ideology has had on candidate success at the polls are interesting areas of future research. Also,
looking at different elections such as those on a more local level may be insightful as well.
Further analysis into the factors which drive native’s perceptions of immigrants, and whether
attitudes towards immigrants are a prominent driver for conservative candidate vote share will
add to the discussion of these results, and will be useful indicators to predict future candidate
Bibliography
Voter Support and Candidate Ideology
Bartels Larry, M. (August, 2016). Failure to Converge: Presidential Candidates, Core Partisans, and the Missing Middle in American Electoral Politics. The ANNALS of the American Academy of Political and Social Science. https://doi.org/10.1177/0002716216661145
Bonica, Adam. (2014). Mapping the Ideological Marketplace. Stanford University. doi:10.1111/ajps.12062
Bonica Adam, Chilton Adam, Rozema Kyle, and Sen Maya. (September 2018). The Legal Academy’s Ideological Uniformity. The Journal of Legal Studies Vol 47 (1).
Bonica Adam, Chilton Adam, and Sen Maya. (December 2016). The Political Ideologies of American Lawyers. The Journal of Legal Analysis, Vol 8 (2) 277-335. https://doi.org/10.1093/jla/lav011
Cohen, Marty, McGrath Mary, Aronow Peter, and Zaller John. (August, 2016). Ideologically Extreme Candidates in U.S. Presidential Elections, 1948–2012. The ANNALS of the American Academy of Political and Social Science. https://doi.org/10.1177/0002716216660571
Hall, Andrew B, and Snyder James M. Candidate Ideology and Electoral Success. (September, 2015). Department of Political Science Stanford University, Department of Government Harvard University and NBER.
Jordan Soren, Clayton Webb, and Wood Dan B. (2014). The President, Polarization, and the Party Platforms, 1944-2012. The Forum. 12(1): 168-189. DOI 10.1515/for-2014-0024
Sides, John. (September, 2016).“Presidential Candidates Are Ideologically Extreme. And They Pretty Much Get Away with It.” The Washington Post.
Thomsen, Danielle M. (May 2015). Would Primary Voters Support Moderate Candidates. Duke University, Presented at: Political Institutions and Public Choice Conference at Duke University.
Tucker, Harvey J. (April, 2004). Low Voter Turnout and American Democracy. Department of Political Science Texas A&M University, Workshop 9: Low Turnout – Does It Matter?.
Attitude Towards Immigrants
David Card, Christian Dustmann, and Ian Preston. (January 2005). Understanding attitudes to immigration: The migration and minority module of the first European Social Survey. Centre for Research and Analysis of Migration. Discussion Paper Series No 03/05.
Encarnación, Omar G. (16, April 2018).“The Trumpification of the Latin American Right.” Foreign Policy. https://foreignpolicy.com/2018/04/16/the-trumpification-of-the-latin-american-right/
Hainmueller Jens, and Hopkins Daniel. (February, 2014). Public Attitudes Toward Immigration. Annual Review of Political Science. doi:10.1146/annurev-polisci-102512-194818
Hainmueller Jens, and Hiscox Michael. (February, 2010) Attitudes toward Highly Skilled and Low-skilled Immigration: Evidence from a Survey Experiment. The American Political Science Review Vol. 104, No. 1 , pp. 61-84. doi:10.1017/S0003055409990372
Harrell A, Soroka S, Iyengar S, and Valentino N. (2012). The impact of economic and cultural cues on support for immigration in Canada and the US. Canadian Journal of Political Science 45(3): 499–530. doi: 10.1017/S0008423912000698
Kefford, Glenn, and Ratcliff, Shaun. (16 August, 2018.) “Republicans and Democrats Are More Polarized on Immigration than Parties in the U.K. or Australia. Here's Why.” The Washington Post, WP Company.
Levine L. (2009). Immigration: The effects on low-skilled and high-skilled native-born workers.
Congressional Research Service.
Marc Helbling, and Hanspeter Kriesi. (1 October, 2014); Why Citizens Prefer High- Over Low-Skilled Immigrants. Labor Market Competition, Welfare State, and Deservingness, European Sociological Review, Volume 30, Issue 5. Pages 595–614. https://doi.org/10.1093/esr/jcu061
Maya, Anna Maria. Who Is Against Immigration? A Cross-Country Investigation of Individual Attitudes toward Immigrants. Discussion Paper No. 1115. (April 2004) [Online 2006]. Georgetown University and The Institute for the Study of Labor (IZA), Bonn, Germany.
“Right-Wing Anti-Immigrant Parties Continue to Receive Support in Europe.” (10 Sept, 2018.) The Economist.
Scheve KF., and Slaughter MJ. Labor Market Competition And Individual Preferences Over Immigration Policy. (2001) The Review of Economics and Statistics, vol. 83, issue 1, 133-145.
Schofield, Janet W. (2010). Realistic group conflict theory. Encyclopedia of group processes & intergroup relations: Realistic Group Conflict Theory (pp. 682-684). Thousand Oaks, CA: SAGE Publications, Inc. doi: 10.4135/9781412972017.n208
Voting Behavior and Immigration
Brunner, Beatrice, and Kuhn, Andreas. (August, 2014). Immigration, Cultural Distance and
Natives’ Attitudes Towards Immigrants: Evidence from Swiss Voting Results. Discussion Paper No. 8409. University of Zurich, University of Lucerne and IZA.
DellaVigna, Stefano and Kaplan Ethan (August, 2007). The Fox News Effect: Media Bias and Voting. The Quarterly Journal of Economics. Page 1187 — 1234.