Predictors for Caregiver-Youth Agreement on the Youth’s Mental Health Emma Grace Choplin
Faculty Advisor: Eric A. Youngstrom Ph. D. Senior Honors Thesis
Abstract
Objective: Evidence-based assessment seeks unbiased estimates to guide decisions. Tested informant credibility, demographic, youth clinical, and family characteristics, as potential predictors of informant credibility, and caregiver-youth agreement metrics. Secondly, we analyzed the eight clinical syndromes as a profile of functioning for agreement patterns.
Method: From N=297 caregiver-youth pairs with treatment-seeking youths M=13.57 (SD=1.85) years old, 49% female, and 70% African-American we measured level, shape, and dispersion of agreement with Q-correlation, squared Euclidean distance, overall caregiver-youth ranked concerning behavior T-scores, and squared M(SD) caregiver-youth T-scores difference. Analyses included correlations, ANOVAs, ANCOVAs, Tukey’s HSD, and multi-regressions.
Results: Five out of seven predictor significantly correlated predictors predicted D2 individually. Q-correlation had four none were informant credibility and only youth’s sex and new step-parent predicted significantly.
Predictors for Caregiver-Youth Level of Agreement on the Youth’s Mental Health Evidence-based assessment (EBA) is used by clinicians and researchers to discover the specific problem using theory and research to lead the choices about what and how to measure someone’s mental health and the next steps after clinical evaluation of the results. The goal is to reach the unbiased truth so that one can make the correct clinical decision to best help the individual (Hunsley & Mash, 2007). Intake EBAs should guide decisions about whether, who, what and how to treat and to help mental health professionals customize treatment to the needs of children and their caregivers (Achenbach, 2017). EBA should serve the purpose of filling the gap between understanding mental health concerns and facilitating treatment (De Los Reyes et al., 2015).
Multiple Informants Approach for Evidence-Based Assessment
differing perceptions, clinical severity levels, and rater biases which all need to be interpreted (De Los Reyes et. al, 2015).
Multi-informant approach is also utilized when assessing college students. One study demonstrated that psychologists cannot just rely on college students’ recollection of symptoms and that over reliance on students’ self-reports can threaten the reliability of diagnosis and the appropriateness of medication and accommodations that follow. The study looked at the documentation of ADHD by college students seeking accommodations to see if each case had gathered information to be considered EBA of ADHD. Besides relying on the DSM-5 criteria, multi-informant data from interviews or filling out ADHD/impairment rating scales by another informant, medical/education records, was evidence of meeting the criterions for evidence-based assessment such as DSM-5 symptoms across multiple settings, childhood onset and impairment of functioning. The need for multi-informants was evident from the modest correlation between their report of their ADHD symptoms as a child and then their actual ADHD symptoms provided by others. The DSM-5 instructs clinicians to collect this data from multiple informants like caregivers, teachers, roommates, or employers who are familiar with the student’s behavior to cover across all occupations of life. Some students might purposefully fabricate the extent of symptoms to receive medication or school accommodations (Weis, Till, & Erickson, 2017).
of incremental validity in the context of multiple informant approach in assessment. They even suggest for future research on incremental validity to include measures holding item content, response labeling, and scaling constant for multiple informants to take so that methodological issues can be eliminated and for a specific criterion to be created for determining the incremental validity of an informant and if it is enough predictive power to be included in EBA (De Los Reyes et. al, 2015).
Construct validity is the judgement about the appropriateness of inferences drawn from (divergence or convergence of multi-informant reports) regarding individual standings on a variable called a construct (contextual variations in a patients’ mental health concerns).
Informant reports corresponded more for externalizing symptoms than internalizing symptoms since it is an observable behavior. Research on construct validity of multi-informant assessments has been extensively done for disorders like ADHD and ODD, for preschool and early
adolescence children but barely any research has been done for mood and anxiety concerns and other developmental periods like emerging adulthood. Thus, multi-informant approach research to estimate the consistency of low-moderate levels of correspondence for young adults needs to be pursued. It is still unclear in multi-informant approaches to assessment which informants should and should not be included in mental health assessments but consulting multiple assessment literatures’ data would help clinicians make these decisions (De Los Reyes et. al, 2015).
Multi-Informant Discrepancies
discrepancies could come from rater biases due to the relationship the reporter has with the patient and context of the development of it. The informant pair, domain of mental health, and method of measurement moderates the magnitude of correspondence between informants (De Los Reyes et. al, 2015). Achenbach first suggested the cross-informant disagreement now known as multi-informant discrepancies in scores on a patient could be explained by context-specific differences where children act differently in varying environments (e.g. school, home, the clinic) (Achenbach, McConaughy, & Howell, 1987). Informant discrepancies does not mean that one is right and one is wrong, rather, each informant provides important data but no informant provides that absolute whole truth. Agreements and disagreements between informant reports can both be informanitive in assessment especially if the clinician can find reasoning behind it. Reflection of different observations and mindsets can come from dyadic disagreement. Informant
discrepancies can also help identify the outlier informant so that the clinician can figure out whether the informant does not correlate with the others reports because of their interactions with the patient or if it is about the informant as an individual (Achenbach, 2017). There is limited research on how clinicians and researchers should measure and interpret caregiver-youth agreement. For example, a limitation in discrepancies research is the wide use of the difference in score method to calculate informant discrepancies which is just subtracting one informant total score from the others. This simple arithmetic reflects a difference in overall scores but fails to capture shape, level, and dispersion of agreement across the measures. Thus, discrepencies researchers suggests the use of metrics of patterns of caregiver-youth agreement instead (E. Youngstrom, Loeber, & Stouthamer-Loeber, 2000). A common trend seen time after time is the larger discrepency between caregivers and youth over internalizing problems like being
Caregivers As Informants
EBAs should include documentation of caregivers strengths and problems from assessment of the caregiver to assist them with their individual issues and to increase their
involvement in treatment of their child (Achenbach, 2017). Even though most caregivers have no clinical training and do not observe their children in all social situations and interactions with others they are the most common informant on the child’s psychological functioning for research and clinical use (E. Youngstrom, Izard, & Ackerman, 1999). Caregivers as informants are
answering reports about their child with parenting cognitions including their goals, attitudes, expectations, perceptions, attributions and ideas on how to raise a child and child development. Thus, caregivers perceive and interpret their children’s behaviors through the tinted glass of their cognitions. These parenting cognitions shape parenting practices (Bornstein, 2007). Information about multiple domains, caregiver-child relationship quality, communication patterns, and psychological characteristics of family members are needed to understand variations in parenting practices (P. A. Cowan, Powell, & Cowan, 1998). Parenting knowledge is the caregiver’s
and the next most significant correlate with agreement indices was the caregivers stress but substance abuse and paternal antisocial behavior did not correlate (Youngstrom, Loeber, & Stouthamer-Loeber, 2000). There is a dearth of research on the relationship between parenting cognitions, parenting practices, and complete child development (Bornstein, 2007). Multi-informants usually consist of reports from Multi-informants who share close relationships with the patient they are reporting about or spend a good amount of time observing their behavior (Achenbach, 2006). Those informants that are close to the youth and around them majority of time most often than not are caregivers. Caregivers and their knowledge and parenting style are not the only variables that could affect the dyadic agreement. Youths may not be just a passive recipient of family processes, and their clinical severity may play an active role in disrupting family functioning which could cause caregiver-youth discrepancies (Algorta et al., 2011). Bias Informants
Social desirability concerns may cause divergence of reports as seen in differences between adult reports about the child and the child self-reports ( De Los Reyes & Kazdin, 2005). In clinical samples of adolescents with anxiety exhibit social desirability concerns but the study did not directly assess for it but believe that under-reporting of the child compared to the
correlation between dysphoric caregivers and negative bias of their children they needed a non-biased informant to compare against like the child, teacher, spouse, or clinician. Thus, a criterion rater should observe and rate a child in the same setting the caregiver rates but without the
caregiver in the setting nor in contact with the criterion rater to make sure they are not influenced by them. The article supports the theory that depression-distortion bias can affect the appraisal of their child’s behaviors. This is just an example of a larger theory that emotions influence
appraisal, decision making and cognition. Therefore, if a caregiver is not dysphoric that does not mean that there is not another psychological phenomena at play affecting the perception of their child’s actions. Even though this study compared independent judges to mothers’ ratings of children behavior instead of mental health assessment for college students, it supports my theory that there needs to be a standard for comparison since a mother might be bias even if they may serve as a helpful insight since they have a familiarity with their child through personal
interactions throughout the child’s like that a independent judge does not have. When looking for evidence of bias, this study looked at variability in all the measures used (Youngstrom, Izard, & Ackerman, 1999). The same study mentioned earlier with the findings about patterns and correlates of agreement between informants indicated that caregivers have a natural tendency to report negative events and behaviors which supports concerns about rater bias when it comes to caregivers (Youngstrom, Loeber, & Stouthamer-Loeber, 2000). With treatment-seeking samples the caregivers are bringing their youth in because they believe they need help and this will then be reflected in filled out measures and diagnostic interviews the caregiver participates in. The rating of problems as high due to the desire for help for their child is called the outpatient referral pattern (Achenbach, McConaughy, & Howell, 1987; E. A. Youngstrom, Van Meter, Frazier, Youngstrom, & Findling, 2018).
There has been prior work on predictors of caregiver-youth agreement, and on informant credibility, and there have been some inconsistent prior studies but no prior work has looked at the association of credibility, dyadic agreement, and clinical, demographic, and familial
characteristics simultaneously (Kaurin, Egloff, Stringaris, & Wessa, 2016; Youngstrom et al., 2011). Therefore, this current study seeks to evaluate the credibility of caregivers and youth as informants for the youth’s mental health by analyzing the dyadic agreement on the youth’s mental health between the youth and their caregiver. Criterion variables or moderators that will be tested for their predictive power for level, shape, and dispersion of agreement will be
demographics of the youth and caregiver, family characteristics, youth clinical characteristics, and perceived informant credibility. These variables were chosen since past research on multi-informant approach to assessment lack methods of prediction besides another multi-informant,
physiological data, medical/educational history etc. To analyze the dyadic agreement, we created and tested metrics of caregiver-youth agreement across all eight of the clinical syndromes on the Achenbach System of Empirical Assessment (ASEBA) which is a profile of the youth’s mental health based on emotional and behavioral problems. Next, the main predictor of focus, caregiver and youth credibility as informants were tested along with the metrics of caregiver-youth
agreement on the ASEBA profile of youth’s mental health for predictors from demographics, family characteristics, and youth’s clinical characteristics and informant credibility. Only Informant Credibility operated as a predictor and a dependent variable when appropriate
Method Participants
From the CMHC a random subsample of families who sought out the center for treatment were invited to take part. Both infrastructures required that the child was 5-18 years old and the child and caregiver both spoke English. Demographic data was collected on the caregivers and the youths accepted into this study.
The outpatient academic medical center had multiple pharmacology studies going on at it. Enrollment into the study was based on presenting symptoms, willingness to participate in protocol of treatment, and if the child had a diagnosis on the bipolar disorder spectrum, unipolar depression, attention deficit hyperactive disorder, conduct disorder, and aggressive behavior regardless of diagnosis. The diagnoses were based on semi-structured interviews with the
caregiver and then youth. Another exclusion from the study at this facility was if the child had an intellectual disability or prevalent developmental disorder. Participants were recruited using advertisements and referrals described treatment studies, families interested in various treatment studies completed the diagnostic assessment as a screening/baseline evaluation, the children of caregivers with a diagnosed bipolar disorder participating in treatment or research at an affiliated adult mood disorders clinic were referred, and youths (including normal controls) were recruited by flyers and word of mouth to complete these descriptive psychometric instruments through the Child/Adolescent Psychiatric Clinical Research Center.
After listwise deletion on all the variables of interest we had 297 caregiver-youth pairs with youth between the ages of 11-18 years old (M = 13.57, SD = 1.85) that had completed all items and measures of interest. Power analysis for 297 participant pairs resulted in 80% power for r > .16. There were 153 male and 144 female children, of which 70% were African
Design
This research is a secondary analysis of the study, “Assessing Bipolar Disorder: A Community-Academic Blend (ABACAB)”, that collected 828 caregiver-youth participants from July 2003 to March 2008 (E. A. Youngstrom et al., 2005). The original study had a prospective design. All participants were treatment-seeking. Caregiver and youth participated in a systematic assessment of symptoms, diagnostic assessment and functional measures. Highly trained raters interviewed both with the semi-structured KSADS-PL interview. On average, it took the caregiver and the youth one day for five to nine hours to complete all background information, assessments, and to complete the interview package. that employed cross examination of informants; caregiver-report, and self-report, on the mental health of the youth, to develop and test different types of statistical measures of dyadic agreement. Two other dependent variables of interest were the credibility of caregivers and youths as informants. Demographics, youth clinical characteristics and family characteristics were selected as categories of variables to explore for potential predictors for how credible the youth and caregiver, separately, were as informants on the youth’s mental health. The same selected variables from the previously mentioned categories along with youth credibility and caregiver credibility were also explored as potential predictors for two different metrics for dyadic agreement on the youth’s mental health.
Constructs
Youth’s mental health.
as such supplies a robust measure for evaluating immigrant, refugee, and minority children from diverse backgrounds (Achenbach et al., 2008). Caregivers rated their youth’s behavior problems on the CBCL’s Age 6–18 Form of the CBCL, the caregiver-report of the Achenbach System of Empirically Based Assessment (ASEBA) (Achenbach & Rescorla, 2001). It is one of the most widely used instruments in both research and clinical practice for youths. Items are based off statistical methods from large samples of clinically referred and not referred children to
authenticate ranges and norms for each syndrome scale. The 113-item measure’s items are rated a 0,1, or 2, which correspond to not true, somewhat, or sometimes true, and very true or often true, respectively about the youth’s behavior. There are two scales, internalizing problems, and externalizing problems while the rest of the questions and symptom scales are other mixed problems that shed light about the youth’s mental health. The internalizing scale consists of 32 items from the following clinical syndrome scales: Somatic Complaints, Withdrawn/Depressed, and Anxious/Depressed. The externalizing scale consists of 33 items from two related but independent clinical syndrome scales: Delinquent Behavior and Aggressive Behavior. The other clinical syndrome scales are: Thought Problems, Social Problems, and Attention Problems.
Youth-report. The youths completed ASEBA’s Youth Self-Report Form (YSR) created for ages 11-18 years old. This 112-item instrument assesses the same behavior problems as does the caregiver form described above, and for most items the content is identical. Like the other ASEBA informant versions, the YSR assesses eight ASEBA clinical syndrome scales (Achenbach & Rescorla, 2001).
Demographics. Age of the youth. Age of the caregiver.
was Caucasian or not, coded as yes or no.
Caregiver’s highest level of education. This variable was composed of middle school, partial high school, high school graduate including GED, one to three years of college, business, or trade school, college or university graduate, at least one year of graduate or professional school, and completed graduate school.
Family characteristics.
Family environment. On the Global Family Environment Scale (GFES) Rater 1, the interviewer who conducted the K-SADS-PL and the whole bundled interview package, answers the single-item asking them to supply an overall rating of the youth’s most severe past quality family environment they experienced for at least a year and before the age of 12 from 0-90 based on all the information and observations they have gathered during the whole interview (Rey et al., 1997). 0 being no information and 90 being perfect. Raters did not rate
single-parent/nontraditional family environments negatively unless there were other factors of concern. 1-10 reflects a “very disturbed family environment” ending in removing the child from the home due to severe abuse, neglect, or deprivation. Scores 11-30 stands for a “very poor environment” with abusive discipline, severe inconsistent parental figures, care and supervision, or conflict between caregivers. Scores 31-50 show “poor family environment” characteristic of interactions with more than 1 step-parent, constant quarreling caregivers, volatile separations with custody battles, substantial inconsistent parental figures, care and supervision, some abuse or neglect and moving from homes or schools very often. 51-70 indicate a “moderately unsatisfactory
environment” with moderate discord between caregivers that may end in separation/divorce, inadequate conflict surrounding inconsistent discipline and standards, moderately unsatisfactory parental supervision and moving from homes or schools often. 71-80 signify “slightly
conflict and inconsistent parenting due to the caregiver working or being sick, child favoritism, or moving from homes or schools. 81-90 represent an “adequate family environment” which is stable, secure, nurturing, with parenting consistency, love, and appropriate discipline and
standards. The GFES has been shown across cultures and countries that raters with little training to have good inter-rater reliability (r = .84) (Rey et al., 2000).
Family pathology. The Family Assessment Device (FAD) was used to measure the family pathology the youth was raised in. Caregiver’s rated 27 statements about the family from 1- strongly agree to 4 strongly disagree. The percent of max possible total score was derived from the FAD since it was composed of the subscales: general family functioning, problem solving, and communication. High total scores represent unhealthy family pathology (Byles, Byrne, Boyle, & Offord, 1988).
Emotional criticism/dyad level of conflict. The Level of Expressed Emotion (LEE) questionnaire has a report for the caregiver and a report for the youth about the level of
expressed emotions in the caregiver-youth relationship. Two of the four-item measure asks about how upset they get and make the other and two items on how critical are they of the other and how critical the other is of them (Hale, Raaijmakers, Gerlsma, & Meeus, 2007).
Caregiver’s level of depression symptoms. The well-validated Parent Beck Depression Inventory (PBDI) was used to measure the caregiver’s severity and intensity level of depression symptoms. 21- items were rated by the caregiver from 0-3 about their own dysphoria (Beck, Steer, & Carbin, 1988).
but it screens best for Bipolar I (Hirschfeld, Williams, & Spitzer Robert L, 2000; Miller, Klugman, Berv, Rosenquist, & Nassir Ghaemi, 2004).
Caregiver’s marital status. Items 102 and 103 from the Child & Adolescent Trauma Scale (CATS) operated as a family characteristic variable. The CATS is a youth-report and item 102 provided information on whether the youth’s caregivers split or got divorced and item 103 if the youth got a new step-parent. Both items had response choices of Yes or No (March, 1999).
Youth clinical characteristics.
Youth mania-insight. The Young Mania Rating Scale’s item 11, provided the youth-mania insight summary item. The rating is filled out by the interviewer based on talking to both the caregiver and the youth, and then deciding whether the youth’s insight is compromised in the context of hypo/mania. Ratings are as followed: 0-Present; Admits Illness; Agrees with Need for Treatment to 4-Denies Any Behavior Change (Young, Biggs, Ziegler, & Meyer, 1978).
Youth’s clinical severity. The Children’s Global Assessment Scale (CGAS) is a
widespread unidimensional tool for children and adolescents rated by the interviewer about the severity of impairment and diagnosis (Shaffer et al. 1983). The CGAS attempts to captures youth’s functionality in all social contexts. Like the GFES, the interviewer rated the child’s functioning level from 1 being the highest level of impairment and 90 being functioning perfectly for their developmental stage (Shaffer et al. 1983).
integrated family history, observations, and discussions in consensus meetings. The number of comorbid diagnoses variable ranged from 0-10 axis I diagnoses that the youth met.
Youth’s level of bipolar symptoms observed by the caregiver. Mood Disorder
Questionnaire-Adolescent Version (MDQ-A) for adolescents is filled out by the caregiver about their youth. It is a screener for all bipolar disorders and scores range from 0 to 13, the larger the more symptoms and the more severe they are (Wagner et. al, 2006).
Youth’s level of bipolar symptoms reported by the youth. MDQ-A has a self-report version for the adolescent that mirrors the caregiver’s report version of the MDQ-A (Wagner et. al, 2006).
Informant credibility.
Caregiver credibility. An item at the end of semi-structured interview of the (K-SADS-PL) for school aged children informed by the caregiver. The interviewer rated the reliability of the information provided by the caregiver during the whole interview package as either 0-poor, 1-fair, or 2-good (Kaufman et. Al, 1997). The interviewers were blind to results on the
assessment package and the LEAD.
Youth credibility. Same as the caregiver credibility item but for the youth at the end of their K-SADS-PL semi-structured interview (Kaufman et. Al, 1997).
Procedure
with the other informant. After completion the informants would switch places and either do the semi-structured diagnostic interview or fill out the assessments or background information. On average, it took the caregiver and youth one day for five to nine hours to complete all
background information, assessments, and to complete the interview package. Metrics of Dyadic Agreement
Q-correlation.
The level of agreement between informants was analyzed using absolute difference in average and standard deviation of difference in scores, Q-correlation, and squared Euclidean distance, as there is not consensus that one is the best method.
The average absolute difference in mean scores for each ASEBA youth behavior informs us of on average which behaviors do the caregivers and youths in the sample have scores closer together than other behaviors. Small absolute mean difference in T-scores and small absolute standard deviation for difference in T-scores signifies low caregiver-youth discrepancy.
Comparing the order of overall means for caregivers and youth on the ASEBA behaviors shows the shape of agreement, e.g., looking at what behaviors they rated the highest or lowest and then seeing if it was the same for both caregiver and youth. Another way of looking at the spread or variance in caregiver-youth agreement is by comparing the overall absolute standard deviation of difference in T-scores for each behavior to see the consistency of dispersion for difference in T-scores overall. The larger the absolute standard deviation of difference in caregiver-youth T-scores then the more all over the place in variance of caregiver-youth agreement. The smaller the absolute standard deviation in difference between a youth and caregiver T-score for a behavior the more consistently the sample tends to agree in the level of concern for that behavior.
and for caregivers and then comparing the order of means will tell the shape of concerning behaviors for the caregiver and the youth but also the caregiver-youth agreement of the overall order or ranking of problems on average for this sample.
Q-correlation captures the shape of agreement for the multivariate model, which is the pattern of similarity in scores, and dispersion, which is the spread of the scores or the variance of agreement (E. Youngstrom et al., 2000). correlation is insensitive to level though. The Q-correlation quantifies agreement in ranking between the caregiver and the youth across all eight ASEBA behaviors. The larger the Q-correlation, the stronger the level of overall agreement is as a pattern across the eight ASEBA youth behaviors. Positive correlations for a predictor with Q-correlation means when predictor scores increase the level of overall agreement as a pattern across the eight ASEBA youth behaviors also increases (E. Youngstrom et al., 2000).
Euclidean squared distance (D2).
Euclidean distance is the most sensitive to shape, dispersion, and level of the multivariate model (E. Youngstrom et al., 2000). The level describes how high or low the average of scores are. Euclidean distance describes the difference between the caregiver and youth’s scores. It is a measure of similarity or proximity, and so the larger the distance value the more difference or disagreement between the caregiver and the youth on the youth’s behaviors across the eight ASEBA behaviors. When Euclidean distance is negatively correlated with predictors, this means the higher the score for that predictor the smaller the distance meaning more
agreement/proximity in scores and the larger that correlation the stronger the association. Data Analytic Plan
ANOVA, ANCOVA, and Tukey’s HSD posthoc test to examine differences across levels of informant credibility as rated by the interviewer. Exploration of interactions were also explored. Finally, we conducted multiple regressions with block entry method for Q-correlation, Euclidean squared distance, caregiver credibility, and youth credibility using the significantly correlated predictors as the predictors in their respective model. Additionally, the same correlated variables along with one or both of the informant credibility variables were added to the model if it was significantly correlated with the dependent variable. This was done to see if informant credibility was a significant predictor or would improve the model.
Results Difference in ASEBA Scores
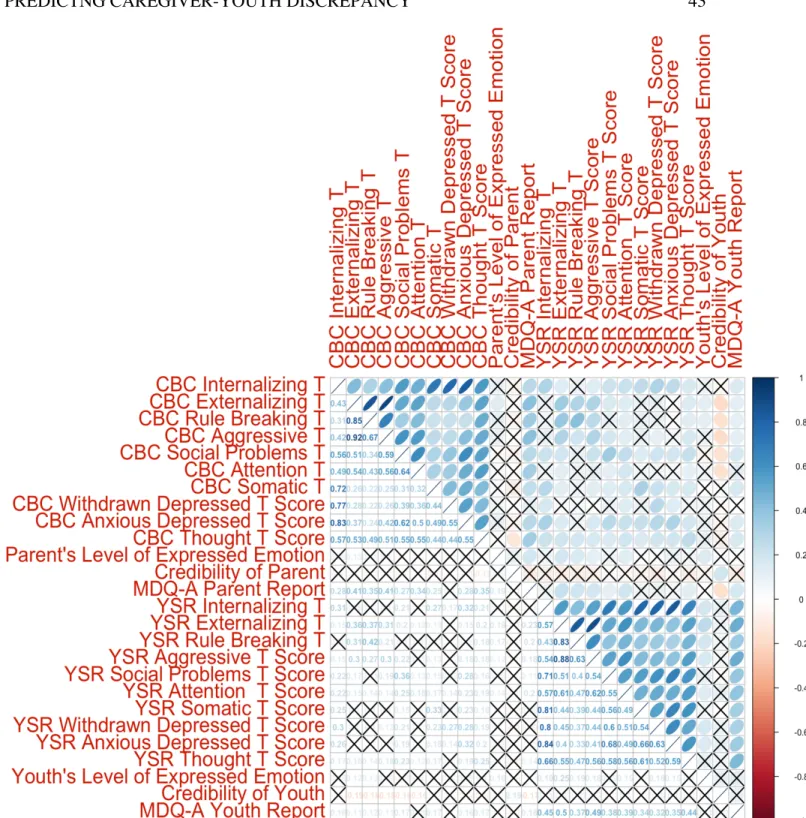
All correlations between ASEBA T-scores from the youth and the caregiver were statistically significant. Rule breaking T-scores for youth and caregivers had the largest correlation along with the smallest absolute difference in scores standard deviation and the 3rd lowest for absolute mean difference in scores. Social problems and Somatic complaints not only were in the top three for the strongest caregiver-youth T -score correlations but also in the top 3 for smallest standard deviation for difference in scores and smallest mean for difference in scores. Attention problems had the weakest correlation and was in the top three for largest absolute mean difference in scores and absolute standard deviation difference in scores.
Withdrawn/Depressed broke this trend slightly because they were only in the top three for largest absolute standard for difference in scores and top three for smallest correlation while being the 4th largest absolute mean for difference in scores. Thought problems also broke this trend by only being the 2nd largest absolute mean for difference in scores and 2nd smallest correlation but 5th largest absolute standard deviation for difference in scores. Anxious/Depressed also flopped but not as much because even though it was the 4th largest correlation and 4th largest absolute standard deviation in difference in scores but only 5th largest for absolute mean difference in scores. Figure 2 illustrates the discussed correlations in a correlation matrix.
Q-Correlation
Overall, Q-correlation is positively skewed as demonstrated in Figure 3’s histogram of distribution for Q-correlation. After analyzing the Q-correlation correlated with our
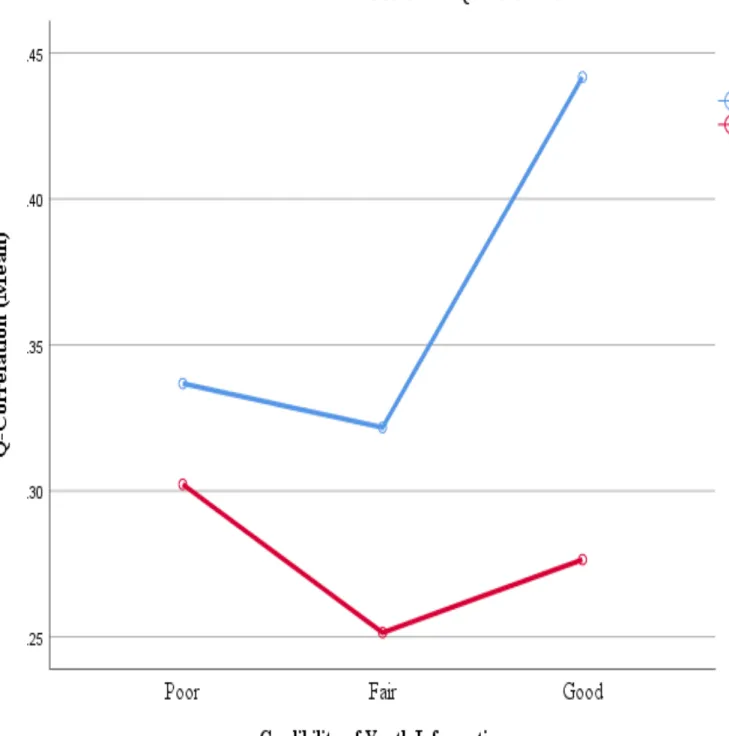
credibility of the youth’s information influenced Q-correlation, we conducted a two (sex of youth: male, female) by three (youth credibility: poor, fair, good) analysis of variance
(ANOVA). Figure 10 depicts this analysis in the form of an interaction line plot. We found a significant main effect of sex of the youth on Q-correlation, such that female youth had significantly higher levels of Q-correlation (n = 144, M = .37, SD = .34) than male youth (n = 152, M = .27, SD = .36), F (1, 290) = 6.74, p < .01. Figure 5 illustrates the difference between male and female youth’s Q-correlation means and standard deviations in a bee swarm box and whiskers plot. We did not find a significant main effect of perceived credibility of youth’s
provided information on Q-correlation such that youth rated as poor (n = 44, M = .32, SD = .36), fair (n = 154, M = .28, SD = .35), and good (n = 98, M = .37, SD = .35) credible informants all had the same level of Q-correlation, F (2, 290) = 1.43, p > .05. There was no significant interaction between the sex of the youth and the perceived credibility of the youth on Q-correlation, F (2, 290) = .73, p > .05. However, female youth rated with a good credibility of information rating had significantly higher levels of Q-correlation (n = 58, M = .44, SD = .32) than male youth with a fair credibility of information rating (n = 87, M = .25, SD = .35) (Q-correlation M difference = .19, p = .018).
All four of the significantly correlated predictors with Q-correlation together statistically significantly predicted the interviewer’s perceived credibility of the youth’s information (R = .26, F (4, 292) = 5.41, p < .0005) with an R2 of .069. Individually, only the youth’s sex (β = .137, p = .018), and if the youth got a new step-parent (β = -.135, p = .023) out of the four predictors significantly predicted the Q-correlation.
Squared Euclidean Distance
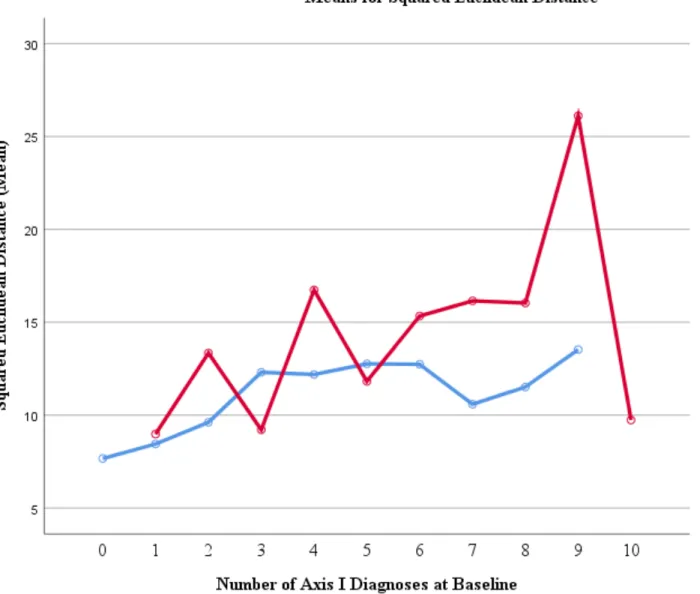
characteristics than Q-Correlation. The strongest to weakest significant predictors comes in this order: caregiver’s report on the youth’s bipolar symptoms on the MDQ, the severity of the child’s diagnosis or symptoms, credibility of the youth’s information, caregiver’s report on a self-report of adult bipolar symptoms on the MDQ, the number of Axis I diagnoses at baseline of the study, the youth’s age, and youth getting a new step-parent (r = .13, p < .0005). To determine whether the effect of youth comorbidity and the youth having a new step-parent influenced the squared Euclidean distance of ASEBA youth-caregiver reports, I conducted a two (new step-parent: no, yes) by 10 (youth’s number of axis I diagnoses at baseline: 1, 2, 3…10) analysis of variance (ANOVA). Figure 9 illustrates the interaction of this factorial ANOVA. There was a significant main effect of new step-parent on squared Euclidean distance such that youth with a new step-parent had higher levels of squared Euclidean distance (M = 13.51, SD = 5.56) than youth with no new step-parent (M = 11.65, SD = 5.18), F (1, 277) = 5.38, p = .021. The main effect for number of Axis I diagnoses at the baseline of the interview yielded an F ratio of F (10, 277) = 2.31, p = .013, indicating the existence of significant difference in levels of
step-parent and four Axis I diagnoses group had a significantly greater Euclidean distance mean by 8.29 (p = .02) than youth with no new step-parent and just one Axis I diagnosis. All the
significantly correlated predictors, including youth’s credibility, with Euclidean distance together statistically significantly predicted the parent-youth’s level, shape and dispersion of agreement from squared Euclidean distance (R = .44, F (7, 288) = 9.86, p < .0005) with an R2 of .193. Individually, five of the seven predictors significantly predicted D2 in this order of largest to smallest predictive power: youth credibility (β = -.166, p=.003), youth’s bipolar symptoms from MDQ Caregiver (β = .153, p = .008), youth’s age (β = -.133, p = .015), caregiver bipolar
disorder symptoms from MDQ self-report (β = .125, p= .026) and the youth’s clinical severity (β = -.127, p = .028). All predictors together without youth credibility in the model statistically significantly predicted the parent-youth’s level, shape and dispersion of agreement from squared Euclidean distance (R = .41, F (6, 290) = 9.82, p < .0005) with an R2 of .169. Individually, three of the six predictors significantly predicted D2 from most predictive power to least as follows: youth’s age (β = -.166, p = .002), youth’s bipolar symptoms from MDQ Caregiver (β = .180, p = .002), and clinical severity β = -.154, p = .008).
Credibility of the Youth’s Information
five of the predictors significantly correlated with youth’s credibility together without caregiver’s credibility in the model statistically significantly predicted the interviewer’s
perceived credibility of the youth’s information (R = .32, F (5, 290) = 6.78, p < .0005) with an R2 of .131. Individually, four out of five of the predictors, the youth’s age (β = .178, p = .002), diagnosis severity (β = .133, p = .021), sex of the youth (β = .121, p = .033) and the caregiver’s perspective of the youth’s level of bipolar symptoms (β = -.122, p = .043) significantly predicted the interviewer’s credibility rating of the information the youth provided. The youth credibility model with the caregiver credibility as a predictor and the other five predictors together
statistically significantly predicted the interviewer’s perceived credibility of the youth’s
information (R = .39, F (6, 289) = 8.36, p < .0005) R2 of .148. Individually, four out of six of the predictors, the youth’s age (β = .217, p < .0005), credibility of the caregiver’s information (β = .213, p < .0005), sex of the youth (β = .121, p = .029), clinical severity (β = .120, p = .034) significantly predicted the interviewer’s credibility rating of the information the youth provided.
To test whether mean levels of youth’s age differed between the poor, fair, and
good groups of youth credibility, I conducted a one-way analysis of variance (ANOVA). Results of the two-tailed t-test indicated a significant omnibus difference between groups, F (7, 288) = 2.31, p < .026.
To determine whether the sex of the youth and the age of the youth influenced the
interviewer’s perceived credibility of the youth’s information, we conducted a two (sex of youth: male, female) by eight (youth’s age: 11, 12, 13, 14, 15, 16, 17, 18) analysis of variance
such that younger youth were rated more poorly as credible informants than older, F (1, 292) = 9.05, p = .003. There was no significant interaction between the sex of the youth and the age of the youth on perceived credibility of the youth, F (1, 292) = .76, p = .384. A one-way between subjects ANCOVA was calculated to examine the effect of age of the youth on the credibility of the youth for the effect of sex of the youth. Age of the youth did show significant difference in terms of level of credibility of the youth F (7, 287) = 2.07, p = .047 after eliminating the effect of gender. Sex of the youth was not a significant covariate F (1, 287) = 3.24, p = .071. A one-way between subjects ANCOVA was calculated to examine the effect of the sex of the youth on the credibility of the youth for the effect of age of the youth. Sex of the youth did not show a
significant difference in terms of level of credibility of the youth F (1, 293) = 3.29, p = .047 after eliminating the effect of age of the youth. The youth’s age was a significant covariate F (1, 293) = 9.05, p = .003.
Credibility of the Caregiver’s Information
From most to least related predictors for caregiver credibility: global family environment score, youth credibility, youth’s age, youth’s credibility, white or not caregiver and youth, the number of Axis I diagnoses the youth had at the baseline of the study, and overall family
pathology were the only predictors with a statistically significant bivariate correlation. It did not come as a surprise that the two measurements on family pathology were significantly associated with the credibility of the caregiver. FAD total score had a small but significant negative
correlation with credibility of the caregiver (r = -.12, p = .045) and a small but significant negative correlation with GFES (r = -.24, p < .0005). GFES had a medium association that was 1.753e-07% due to chance. Overall, GFES for all 297 caregivers was (M = 66.48, Md = 70.00, SD = 12.19). There was a significant overall difference in GFES scores between the three levels
for caregiver’s information that was rated as “poor” their average GFES scores (M = 57.52, Md = 60.00, SD = 11.03) were significantly lower than “fair” rated caregivers’ GFES score (M = 63.90, Md = 65.00, SD = 11.18) by 6.37 GFES points, p = .048) and for “good” credibility caregiver information their GFES (M = 69.31, Md = 70.00, SD = 12.06) were 11.79 GFES points significantly (p = .00004) higher than the GFES for poor-rated caregivers. This is shown in Figure 7. The GFES difference in scores between fair and good-rated caregivers was the smallest with “good” 5.42 points higher but still significant (p = .0006). The mean difference between each group was (p < .05) and the GFES mean for poor was significantly smaller than fair and the GFES mean for good was significantly larger than fair. The Levene’s test of
homogeneity of variances showed that there was not a significant difference in variance between groups. Not only is the average GFES score lower for poor caregiver information than the overall sample of caregivers’ average GFES score but as demonstrated in Figure 5 the frequency
distribution of both poor and overall, the mode is less than overall’s mode and the distribution for poor caregivers is negatively skewed while overall’s frequencies piles up more near greater GFES scores hence the lack of overlap of distributions.
Besides the previously mentioned family characteristics, demographics like age of the youth which was the second strongest correlated predictor with credibility of the caregiver and if they were “white or not” also were associated credibility of caregiver information. After coming across these bivariate correlations, a deeper investigation into the validity of these trends ensued to test for potential confounding variable or explanations. Secondary analysis on the bivariate correlations between caregiver credibility and these demographic characteristics were conducted to see if these patterns still holds true.
white or not (r = .18, p = .002) and education of the caregiver had a stronger and more
significant correlation (r = .20, p = .0005). A welch two-sample t-test was performed for white or non-white caregiver as the grouping factor and level of caregiver education for the mean
comparison. There was a significant difference in education level achieved for the 226 non-white caregivers (M = 4.31, Md = 4, SD = 1.12) and 71 white caregivers (M = 4.85, Md = 5, SD = 1.06); t (122.65) = -3.62, p = .0004. Levene’s test of homogeneity of variance revealed that it was far from significant and okay to assume equal variance for white and non-white caregivers when it comes to education level.
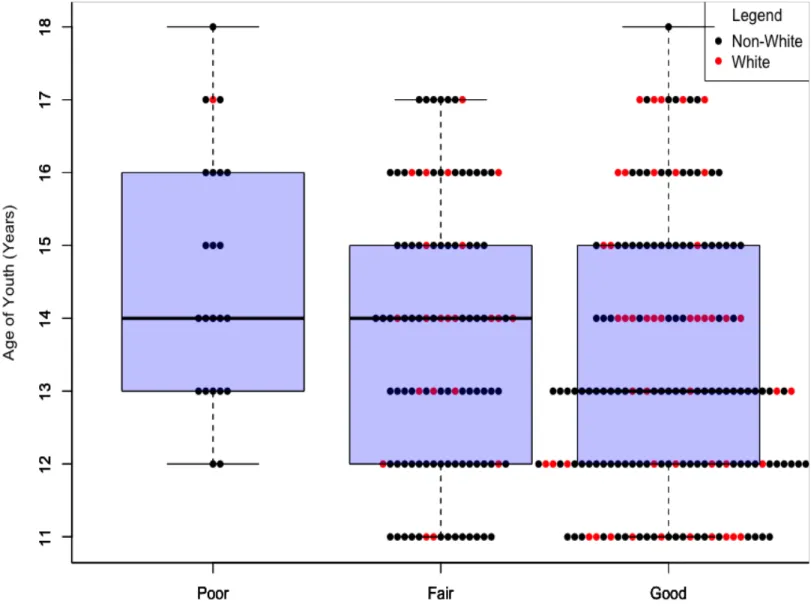
The perceived level of credibility of caregiver information had a weak but undeniable negative association with youth age (r = -.18, p = .002). Upon further inspection using a one-way ANOVA to test difference in youth’s age between the 3 levels of caregiver credibility, there was a significant effect of youth’s age on the credibility of caregiver’s information at the p < .05 level for the three conditions F (2, 294) = 5.71, p = .004, h2 = .04. To find this effect between the 3 levels, I conducted post hoc comparisons using the Tukey HSD test. This indicated that the mean score for poor caregiver information (n = 23, M = 14.7 years old, Md = 14, SD = 1.72 years) was significantly different than good caregiver information (n = 169, M = 13.3, Md = 13, SD = 1.83) at p = .004. However, fair rated caregiver information (n = 105, M = 13.7, SD = 1.84) did not significantly differ from the poor rated caregiver information at p = .064 and good rated
caregiver information at p = .238. The difference in youth’s average age per caregiver credibility rating is demonstrated in Figure 8.
The credibility of caregiver’s information multiple regression model used the five of the six predictors previously mentioned that were statistically significantly related to caregiver credibility as shown in Figure 3 but excluded youth’s credibility as a predictor. Results of the multiple regression analysis indicated that the predictors all together, without credibility of youth as a predictor, statistically significantly predicted the interviewer’s perceived credibility of the caregiver’s information (R = .36, F (5, 291) = 8.80, p < .0005) with an R2 of .131. Individually, three out of five of the predictors, global family environment (β = .224, p < .0005), white or not (β = .136, p = .014), and the youth’s age (β = -.117, p = .041) significantly predicted the
interviewer’s credibility rating of caregiver information. The caregiver credibility regression model, with all six significantly associated predictor which includes youth credibility as a predictor were added, all together the predictors statistically significantly predicted the
interviewer’s perceived credibility of the caregiver’s information (R = .42, F (6, 289) = 10.03, p < .0005) with an R2 of .172. Individually, four out of six of the predictors, global family
environment (β = .220, p < .0005), credibility of the youth (β = .209, p < .0005), the youth’s age (β = -.158, p = .006) and if the youth was white or not (β = .126, p = .02), significantly predicted the interviewer’s credibility rating of caregiver information.
Discussion Difference in ASEBA Scores
hence why caregivers are the ones who seek out treatment or assessment for their child rather than the child seeking it for themselves. Withdrawn/depressed, aggressive behavior, and attention problems were the only T-scores with a significantly different variance, more specifically, larger variance for caregiver T-scores than for youths. This means that the 297 caregivers do not as consistently hang around the same T-score as the youth do but are more spread out in their T-scores for withdrawn/depressed, aggressive behavior and attention problems.
Q-Correlation
Majority of dyad pairs were positive and around a medium correlation causing a positive skew meaning that most dyads agreed about the ranking of T-scores about medium amount. None of the youth’s clinical characteristics had a significant relationship with correlation. Q-correlation had four significant Q-correlations which was lowest amount out of all dependent variables. None of the informant credibility correlated and only youth’s sex and new step-parent predicted significantly which suggests that overall ranking of concerned behavioral and
emotional problems are more similar among female youths and youths without a new step-parent in their lives than for male youths and youths with a new step-parent.
Squared Euclidean Distance
of abundant correlations also indicates that level of agreement is easier to predict and drives associations.
Credibility of the Youth’s Information
The more potent clinical characteristics like the level of illness of the child were better at predicting the level of agreement based on distance and both informant credibility. Youth credibility was a strong predictor for D2 and caregiver credibility. Interviewers rated girls more credible than boys and older youth more credible than younger. Female youths agree more with caregivers about ranking of syndromes and the youth’s sex was strongest predictor for Q-Correlation. The small but positive correlation with caregiver credibility indicates a trend of information provided by youth are perceived as more credible when information provided by the caregiver is perceived more credible. Unsurprisingly, both were significant predictors in the whole model for each other and by themselves for the other.
Credibility of the Caregiver’s Information
The most significant and strongest correlation, a medium correlation, for the perceived credibility of the caregiver was the GFES score. The trend shows that the more that the
perceived credibility is lower along with the established relationship between GFES and FAD total score being confirmed by increase in healthy family environment tends to show an increase in family functioning which is reflected in lower scores. Based on the results, family pathology, and the perceived credibility of information from the caregiver had a significant effect on the global family environment scale score with 9% of the variance in the GFES scoring being accounted for by the perceived credibility of the caregiver.
The hypothesis as to why overall white caregivers tended to be perceived as more reliable than non-white members was that the trend was driven by SES not if they were white or not. A strong indication of SES is often, level of education. There is only a .04% likelihood that it was by chance that the average and the median is about one level higher in education for white caregivers than for non-white caregivers. This effect even considered that there was about a ratio of 3 white caregivers for every 10 non-white caregivers in this sample. The hypothesis that this trend is not a result of race-bias from the interviewer when it comes to the credibility of the caregiver but most influenced by the SES marked by education level which white caregivers tended to have a higher achieved education level than non-white caregivers was supported.
A significant relation was observed when it came to the age of the youth and how
credible the information for the caregiver was perceived. The variance in most 13-year old youth are in 7th to 8th grade in middle school while 14 to 15-year-old youth are first or second years in high school. This change in age marks a change in development and a move to a more
independent setting. This change in age could also mark a change in sharing information and relationship closeness with caregivers which might explain why caregivers would struggle at reporting credible information about an older youth since they may have less access to
informants might be more significant if there were more people in this sample or it might suggest that there are only two true levels of credible information from caregivers, poor and good. Factor analysis for perceived credibility of caregiver analysis could bring light to this.
The fact that adding either caregiver or youth credibility to all models, except Q-correlation because neither were significantly correlated with it, increased the predicted power and the percentage of variance explained suggests that informant credibility is a promising predictor that should be investigated further.
Limitations
for credibility. All the block entry method multi-regressions used had just one block with all the significantly correlated predictors in it.
Future Directions
This heterogeneous sample only reflects 11 to 18-year-old youth and can be parsed into smaller groups based on diagnosis since studies have shown more disagreement when it comes to internalizing problems like you would see in a child with social anxiety as opposed to a child with externalizing problems which are visible to both the child and the parent. Another benefit to analyzing difference in dyadic agreement between youths with and without the disorder and to other disorders is that profiles of agreement patterns like level, shape and dispersion can be found to explain why caregiver’s and youth might disagree on the eight syndromes ranking and T-scores if the pattern of disagreement can serve as an indication of a certain diagnosis. Future research should further investigate the promising findings of informant credibility starting with developing inter-rater reliability norms. The next step with block entry multi-regressions should be putting predictors in distinct boxes like demographics, youth clinical characteristics, family characteristics and credibility of informant variables being loaded into their respective block and then testing the order of blocks loaded into each block entry multi-regressions models. Cluster analysis for caregiver-youth ASEBA T-scores per youth diagnosis may identify agreement patterns across and influential predictors per profile. Polynomial regressions using the candidate predictors with Q-correlation, distance, and credibility ratings to determine if they are consistent predictors overall and for specific diagnoses. ANCOVA will provide help when testing
References
Achenbach T.M. (2006). As others see us: Clinical and research implications of cross-informant correlations for psychopathology. Current Directions in Psychological Science. 15, 94– 98. doi: 10.1111/j.0963-7214.2006.00414.x
Achenbach, T. M. (2017). Future Directions for Clinical Research, Services, and Training: Evidence-Based Assessment Across Informants, Cultures, and Dimensional Hierarchies. Journal of Clinical Child and Adolescent Psychology, 46(1), 159–169.
https://doi.org/10.1080/15374416.2016.1220315
Achenbach T. M., McConaughy S. H., Howell C. T. (1987). Child/adolescent behavioral and emotional problems: Implications of cross-informant correlations for situational specificity. Psychological Bulletin, 101, 213–232. doi: 10.1037/0033-2909.101.2.213 [PubMed: 3562706]
Achenbach, T. M., & Rescorla, L. (2003). ASEBA Adult Forms & Profiles: For Ages 18-59: Adult Self-report and Adult Behavior Checklist. ASEBA.
Algorta, G. P., Youngstrom, E. A., Frazier, T. W., Freeman, A. J., Youngstrom, J. K., & Findling, R. L. (2011). Suicidality in pediatric bipolar disorder: predictor or outcome of family processes and mixed mood presentation? Bipolar Disorders, 13(1), 76–86. https://doi.org/10.1111/j.1399-5618.2010.00886.x
Beck, A. T., Steer, R. A., & Carbin, M. G. (1988). Psychometric properties of the Beck Depression Inventory: Twenty-five years of evaluation. Clinical Psychology Review. https://doi.org/10.1016/0272-7358(88)90050-5
Bornstein, M. H. (2007). Parenting Science and Practice. In K. A. Renninger & I. E. Sigel (Eds.),
https://doi.org/10.1002/9780470147658.chpsy0422
Byles, J., Byrne, C., Boyle, M. H., & Offord, D. R. (1988). Ontario Child Health Study: Reliability and Validity of the General Functioning Subscale of the McMaster Family
Assessment Device. Fam Proc (Vol. 27).
Cowan, P. A., Powell, D., & Cowan, C. P. (1998). Parenting interventions: A family systems perspective. In Handbook of child psychology.
De Los Reyes A, Aldao A, Thomas SA, Daruwala SE, Swan AJ, Van Wie M, … Lechner WV. 2012. Adolescent self-reports of social anxiety: Can they disagree with objective
psychophysiological measures and still be valid? Journal of Psychopathology and Behavioral Assessment. 34, 308–322. DOI: 10.1007/s10862-012-9289-2
De Los Reyes, A., Augenstein, T. M., Wang, M., Thomas, S. A., Drabick, D. A. G., Burgers, D. E., & Rabinowitz, J. (2015). The validity of the multi-informant approach to assessing child and adolescent mental health. Psychological Bulletin. https://doi.org/10.1037/a0038498 De Los Reyes, A., Bunnell, B. E., & Beidel, D. C. (2013). Informant discrepancies in adult social
anxiety disorder assessments: Links with contextual variations in observed behavior. Journal of Abnormal Psychology. https://doi.org/10.1037/a0031150
De Los Reyes, A., & Kazdin, A. E. (2005). Informant discrepancies in the assessment of
childhood psychopathology: A critical review, theoretical framework, and recommendations for further study. Psychological Bulletin, 131(4), 483–509. https://doi.org/10.1037/0033-2909.131.4.483
Hale, W. W., Raaijmakers, Q. A. W., Gerlsma, C., & Meeus, W. (2007). Does the level of expressed emotion (LEE) questionnaire have the same factor structure for adolescents as it has for adults? Social Psychiatry and Psychiatric Epidemiology.
Hirschfeld, R. M. A., Williams, J. B. W., & Spitzer Robert L. (2000). Development and validation of a screening instrument for bipolar spectrum disorder: The mood disorder questionnaire - ProQuest. The American Journal of Psychiatry, 157(11), 1873–1875. Retrieved from
https://search-proquest-com.libproxy.lib.unc.edu/docview/220482048/64109F2168A04795PQ/1?accountid=14244 Hunsley, J., & Mash, E. J. (2007). Evidence-Based Assessment.
https://doi.org/10.1146/annurev.clinpsy.3.022806.091419
Kaurin, A., Egloff, B., Stringaris, A., & Wessa, M. (2016). Only complementary voices tell the truth: a reevaluation of validity in multi-informant approaches of child and adolescent clinical assessments. Journal of Neural Transmission, 123(8), 981–990.
https://doi.org/10.1007/s00702-016-1543-4
Kraemer, H. C., Measelle, J. R., Ablow, J. C., Essex, M. J., Boyce,W. T., & Kupfer, D. J. (2003). A new approach to integrating data from multiple informants in psychiatric assessment and research: Mixing and matching contexts and perspectives. American Journal of Psychiatry, 160(9), 1566–1577. https://doi.org/10.1176/appi.ajp.160.9.1566.
March, J. S. (1999). Assessment of pediatric posttraumatic stress disorder. In P. Saigh & J. Bremner (Eds.), Posttraumatic stress disorder: A comprehensive text. 199–218. Needham Heights, MA: Allyn & Bacon.
Miller, C. J., Klugman, J., Berv, D. A., Rosenquist, K. J., & Nassir Ghaemi, S. (2004). Sensitivity and specificity of the Mood Disorder Questionnaire for detecting bipolar disorder. Journal of Affective Disorders. https://doi.org/10.1016/S0165-0327(03)00156-3 REY, J. M., PENG, R., MORALES-BLANQUEZ, C., WIDYAWATI, I., PERALTA, V., &
WALTER, G. (2000). Rating the Quality of the Family Environment in Different Cultures.
https://doi.org/10.1097/00004583-200009000-00017
Rey, J. M., Singh, M., Hung, S. F., Dossetor, D. R., Newman, L., Plapp, J. M., & Bird, K. D. (1997). A global scale to measure the quality of the family environment. Archives of General Psychiatry, 54, 817–822. https://doi.org/10.1001/archpsyc.1997.01830210061006 Schaffer D, Gould MS, Brasic J et al. (1983). A children's global assessment scale (CGAS).
Archives of General Psychiatry. 40, 1228–1231.
Wagner, K. D., Hirschfeld, R. M. A., Emslie, G. J., Findling, R. L., Gracious, B. L., & Reed, M. L. (2006). Validation of the mood disorder questionnaire for bipolar disorders in
adolescents. Journal of Clinical Psychiatry. https://doi.org/10.4088/JCP.v67n0518 Weis, R., Till, C. H., & Erickson, C. P. (2017). ADHD Assessment in College Students :
Psychologists ’ Adherence to DSM-5 Criteria and Assessment, 1–17. https://doi.org/10.1177/0734282917735152
Young RC, Biggs JT, Ziegler VE, Meyer DA. A rating scale for mania: reliability, validity, and sensitivity. British Journal of Psychiatry. 133, 429–435.
Youngstrom, E. A., Meyers, O., Demeter, C., Youngstrom, J., Morello, L., Piiparinen, R., … Findling, R. L. (2005). Comparing diagnostic checklists for pediatric bipolar disorder in academic and community mental health settings. Bipolar Disorders, 7(6), 507–517. https://doi.org/10.1111/j.1399-5618.2005.00269.x
Youngstrom, E. A., Van Meter, A., Frazier, T. W., Youngstrom, J. K., & Findling, R. L. (2018). Developing and Validating Short Forms of the Parent General Behavior Inventory Mania and Depression Scales for Rating Youth Mood Symptoms. Journal of Clinical Child and Adolescent Psychology. https://doi.org/10.1080/15374416.2018.1491006
internalizing problems. Journal of Consulting and Clinical Psychology, 68(6), 1038–1050. https://doi.org/10.1037/0022-006X.68.6.1038
Youngstrom, E. A., Youngstrom, J. K., Freeman, A. J., De Los Reyes, A., Feeny, N. C., & Findling, R. L. (2011). Informants Are Not All Equal: Predictors and Correlates of Clinician Judgments About Caregiver and Youth Credibility. Journal of Child and Adolescent
Table 1
Descriptive Statistics for Predictors & Bivariate Correlations with Agreement & Credibility
Predictors M (SD) or n
(%) r (Q) r (D) Cred-C Cred-Y Demographics
Caregiver Received H.S.
Diploma/GED 82.15 %
-.02 -.03 .10 .07
Age of Youth 13.57 (1.85) .13* -.16* -.18** .19** Age of Caregiver 36.6 (10.26) -.03 -.08 -.04 -.02 Sex of Youth (Female %) 48.48 % .15* -.10 -.03 .13*
Race (White %) 23.90 % .10 -.10 .18** .03
Family Characteristics
PBDI .14 (.13) .09 .09 .04 .05
FAD Total Scorea .36 (.13) .04 .06 -.12* -.10
GFES 66.48 (12.19) 0.0 .02 .30*** .02
Split/Divorced Parents 15.82% -.15* .09 -.06 .03
New Step-Parent 15.82% -.15* .13* .03 .02
Caregiver’s LEEa .57 (.20) .11 -.01 .09 .03
Youth’s LEEa .56 (.22) .05 -.08 -.06 .10
MDQ Parent Self-Reporta .24 (.23) .06 .21*** -.05 .03 Youth’s Clinical
Characteristics Axis I Diagnoses at
Baseline (comorbidity) 4.10 (1.84)
-.01 .20** -.17** -.03
Youth Mania-Insighta .23 (.38) .04 .02 -.02 -.12*
CGAS 51.2 (8.44) .04 -.25*** .09 .17**
MDQ-A Youth Reporta .40 (.24) .08 0.0 -.10 .09 MDQ Caregiver Reporta .36 (.25) .10 .28*** -.10 -.17** Credibility of Information
Youth .62 (.32) .08 -.24*** .19** 1.0
Caregiver .72 (.32) -.05 .04 1.0 .19**
Table 2
Descriptive Statistics for Clinical and Demographic Variables, and Bivariate Tests of Association with Measurements of Agreement and Credibility of Informants
Mean (SD)
Variable Caregiver Youth Absolute
Difference in Scores
r (Caregiver,
Youth) Anxious/Depressed 62.42***(9.59) 58.18 (9.71) 9.18 (7.79) .32*** Withdrawn/Depressed 66.16***(11.17**) 60.23 (9.48) 10.83 (8.64) .27*** Attention Problems 67.47***(11.47**) 60.33 (9.89) 11.99 (9.73) .18*** Somatic Complaints 60.63*(9.38) 59.17 (9.10) 8.22 (7.04) .33*** Social Problems 63.78***(9.55) 59.38 (9.07) 8.76 (7.37) .36*** Thought Problems 64.63***(9.39) 59.24 (9.26) 12.11 (7.61) .25*** Rule Breaking 66.32***(8.23) 59.66 (8.22) 9.12 (6.30) .42*** Aggressive Behavior 70.68***(11.74*) 61.39 (10.51) 12.70 (9.89) .30*** Internalizing 63.78***(9.99) 57.19(12.46***) 11.78 (9.08) .31*** Externalizing 68.47*** (9.30) 59.49 (11.43***) 12.08 (8.68) .36*** Level of Expressed Emotiona .57*(0.20) .56 (.22) .28 (.31) .16*
Credibility of Informationa .72***(0.32) .62 (.32) .22 (.17) .19** Mood Disorder Questionnairea .36 (0.25) .40*(.24) .25 (.19) .18**
Measures of Profile
Agreement Correlation ASEBA
Q-ASEBA Euclidean Distance ASEBA Absolute Difference
r (Q, D)
.32 (.35) 11.94 (5.28) 10.36 (8.29) -.24*** Note. Where data points were missing, effect sizes were calculated out of total number of
available cases.
aScaled as percent of maximum possible (POMP).
Figure 1. Side by side comparison of the dyad’s boxplots of overall scores.
Figure 2. Correlation plot of dyad ASEBA T-scores with dyad credibility, level of expressed emotion, and mood disorder dyad reports on youth.
Figure 3. Distribution of Q-correlation for caregiver-youth pairs.
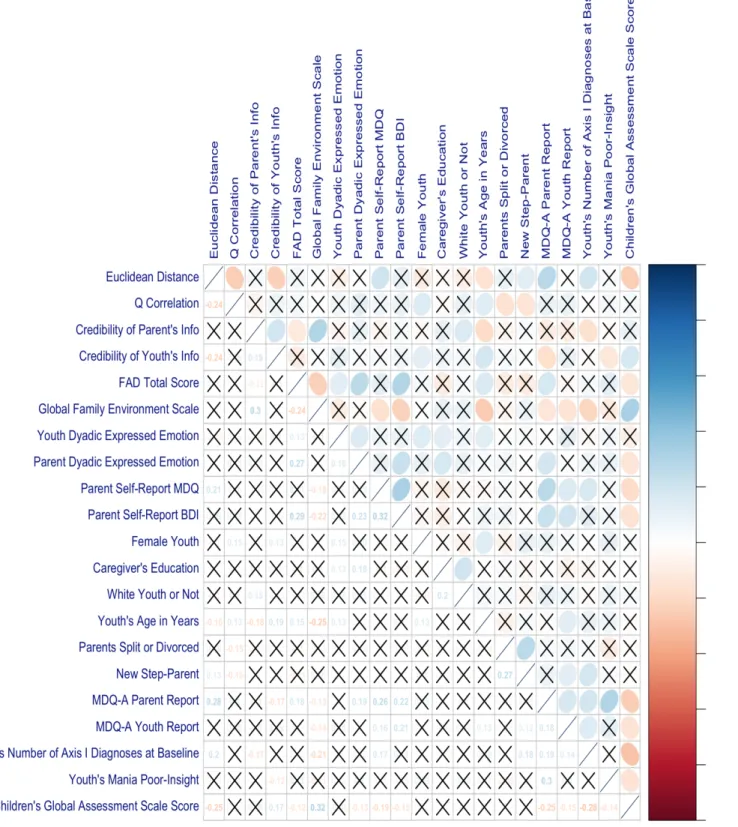
Figure 4. Predictors with measurements of agreement and reliability correlation plot.
Figure 5. Bee swarm boxplot for sex of youth and Q-correlations
Figure 6. Distribution of squared Euclidean distance.
Figure 7. Boxplot of family environment scores across caregiver credibility.
Figure 8. Bee swarm box plot for the distribution of age across caregiver credibility.