Copyright 1992 Theresa Renee Anthony ALL RIGHTS RESERVED
Acknowledgements
This work is dedicated to the memory of my father, whose life inspired all who
knew him. He encouraged my persuit of knowledge and fostered my desire for
excellence. His loving presence is sorely missed, but his spirit is with me always.
I would like to thank my advisor, David Leith, for his guidance and his faith in my
abilities. It was a pleasure working for him. Thanks also to my readers. Dr. Symons
and Dr. Reist, for their assistance.
A special thanks goes to those who made my stay in Chapel Hill more enjoyable,
including Maryanne Boundy, Brian Cawley, John Collins, Janet Simmons, and, of
course, Cosette. To my family and friends across the country, who always knew I
could do it, thanks for your phone calls and loving support.THERESA RENEE ANTHONY. Factors that Affect the Size Distribution of
Nebulized Fluid.
Abstract
A test nebulizer was developed to evaluate the effect of altering nebulizer geometry
and flow conditions upon the size distribution of the droplets produced. An Andersen
impactor was used to collect the dried residual particles of a methylene blue dye and
sodium bicarbonate solution. Residual particle mass was determined by colorimetric
analysis in a spectrophotometer. Droplet size distributions were calculated from the
amount of methylene blue dye collected on each impactor stage, the cut sizes of the
Andersen impactor, the nebulized solution's concentration, and the residual particles'
density. The effects of air velocity, liquid velocity, air nozzle diameter, and nebulizer
baffle position on droplet size distribution were evaluated. Linear regression was used
to develop an empirical relationship between key parameters and the mass median
droplet diameter, d^o, as well as djg and dg4. The model indicates that the median
diameter increases from 9 to 22 /^m with decreased kinetic energy loss, decreased air
nozzle exit area and, surprisingly, decreased distance separating the baffle and air
nozzle.
Table of contents
Page
LIST OF TABLES...vi
LIST OF FIGURES...'...vii
LIST OF NOMENCLATURE...viii
Background...'... 1
Apparatus...3
Experiments...7
Results...11
Discussion...11
Median Diameter...14
Spread of the Distribution...17
Conclusions...-... 18
Bibliography...22
"-'ͣ^Vf'e^siifiH^f^^Kjr.
LIST OF TABLES
Table 1:
Table 2:
Table 3:
Table 4:
Page
Baffle Design...6
Experimental Conditions for Each Baffle Position...9
Experimental Results...12
Range of Values in dso Model...17
List OF Figures
Page
Figure 1: Test Nebulizer Apparatus...4
Figure 2: Experimental Set-Up...8
Figure 3: Replicate Experiment for Cumulative Size Distribution
for the Base Da, Base Va, Base Vi Condition at Baffle Position lODa...13Figure 4: Measured vs Estimated dso...16
Figure 5: Measured vs Estimated d^g...19
Figure 6: Measured vs Estimated dg4...20
List of nomenclature
A flow area of upstream atomizing airstream, m^
e concentration of the nebulized solution, g/cc
di6 16% of droplets are less than this diameter, ^^m
d5o median droplet diameter, as formed, ^m
dg4 84% of droplets are less than this diameter, /xm
da aerodynamic diameter of the dried droplet, ^m
dd droplet diameter, ^m
dp diameter of the dry particle, ;nm
Da air nozzle diameter, cm
Dj liquid nozzle diameter, cm
Dmean mean particle diameter of aerosol, /^m, as used by Nukiyama and Tanasawa
and by Wigg,
h height of air annulus, cm
L distance between air nozzle face and the liquid nozzle centerline, cm
MMD mass median diameter of aerosol, /^m, as used by Kim and Marshall
Qg air flow rate, L/secQl liquid flow rate, L/sec
Pa air density, g/cc
p| density of nebulized liquid, g/cc
pp density of the dry residual particle, g/cc
PI liquid density (g/cc)
LIST OF NOMENCLATURE, CONTINUED
ffg geometric standard deviation
ffj liquid surface tension (dyne/cm)
^1 dynamic liquid viscosity (poise)
V liquid kinematic viscosity, centistoke
Vg air velocity leaving the air nozzle, m/sec
V] liquid velocity leaving the liquid nozzle, m/sec
Vj relative velocity, m/sec
Wg air mass flow rate, g/sec
Wi liquid mass rate, g/sec
X distance between air nozzle face and the baffle, cm
y radius of jet at distance x from nozzle, cm
Factors that affect the Size Distribution of Nebulized
Fluid
background
a nebulizer is a droplet generator that draws liquid from a reservoir through an
orifice due to a low-pressure region created by high-velocity air. Nebulizers are used
in medical and scientific research to generate mists from a bulk solution. The Laskin,
CoUison, DeVilbiss, Wright, Retec, and Lovelace nebulizers are most widely used.
However, little information is available on the size distribution of the droplets
nebulizers generate. Liquid parameters, such as viscosity, density, and surface tension,
influence the droplet size distribution (Lefebvre, 1980). In many applications, these
fluid parameters are fixed because aerosolization of a specific fluid is required.
Furthermore, the air flow rate through nebulizers for inhalation therapy must remain
within a certain range to provide optimum patient benefit. With the fluid
characteristics and the flow fixed, there is no convenient way to adjust nebulizers to
alter the size distribution of the aerosol produced.
Nukyiama and Tanasawa (1939), Gretzinger and Marshall (1961), Wigg (1964),
Kim and Marshall (1971), MuUinger and Chigier (1974), Yang and Chin (1990), and
others have evaluated other types of aerosol generators to determine the relationship
in the combustion industry. The most basic aerosolizer of this type is the plain-jet
atomizer, which has separately controlled liquid and air flows through concentric nozzles. The liquid stream is shattered by its interaction with a high-speed gas stream. Several different nozzle configurations including prefilmers, internal mixing chambers, and concentric double air nozzles have been developed to achieve optimally sized fuel
droplets for the combustion industry. Nukiyama and Tanasawa (1938), Wigg (1964),
and Kim and Marshall (1971) have developed models to estimate the average droplet
size generated by this nebulizer type. Lefebvre (1980) has summarized these and other
models.
Nukiyama and Tanasawa:
Dmean= (585/Vr)*(<ri/pi)0-5 + 597Dii/(a i*p j) 0-5] 0.45*(ioooQ ^Q ^ 1.5 (l)
Wigg:
Dmean= 200*('')°-^Wi0.1(H-Wi/Wa)0-5hO-l(r {^
ͣ
'^l [p ^O-^V ^1 (2)
Kim and Marshall:
MMD=5.36*10-3[ai0.41*^j0.32]/[(^*V ^2) 0.57a0.36 p ,0-16]
-f-3.44*10-3^l2/(ffi*pj)] 0.17 *(w^/Wi)m*(Vj)-0.54 (3)
wherem=-lifWa/Wi<3
m=0.5ifWa/Wi>3
These models indicate that the average droplet diameter decreases by decreasing the
liquid surface tension (eri), decreasing the liquid viscosity (m), or increasing the liquid
density (pi). This diameter also appears to be related to a ratio of liquid to air flows,
either volumetric or mass, raised to a power. The physical characteristics of the
atomizers do not appear to affect greatly the mean diameters, as only the height of the
annulus (h) and the flow area of the upstream atomizing airstream (A) appear in these
models.
Although concentric nozzle configurations are used widely in the combustion
industry, most nebulizers in medical and aerosol research applications have
perpendicular air and liquid streams. This study was undertaken to evaluate the effects
of altering the air velocity, liquid velocity, air nozzle diameter, and baffle position of a
nebulizer with perpendicular air and liquid streams on the size distribution of droplets
the nebulizer produces. Since only one liquid solution was nebulized, the effects of
liquid density and surface tension were not evaluated.
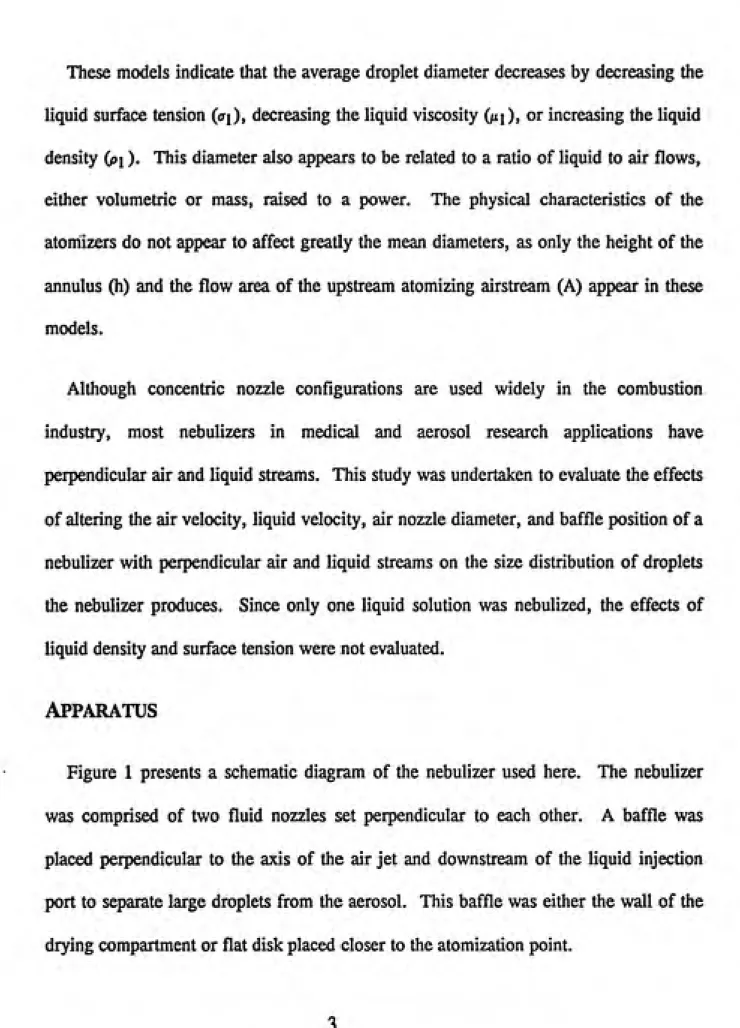
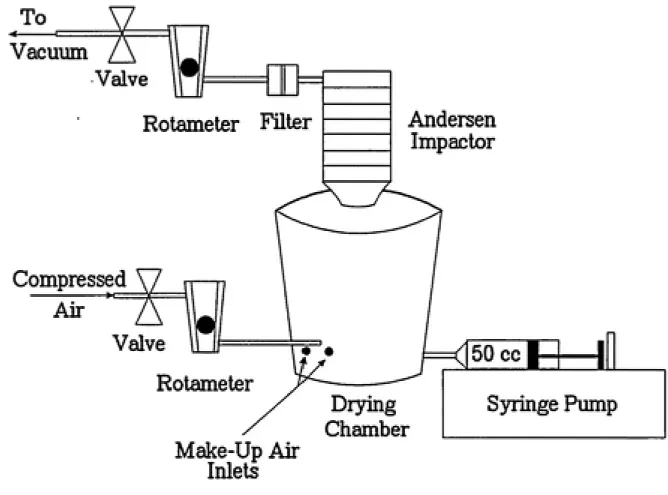
Apparatus
Figure 1 presents a schematic diagram of the nebulizer used here. The nebulizer
was comprised of two fluid nozzles set perpendicular to each other. A baffle was
placed perpendicular to the axis of the air jet and downstream of the liquid injection
Baffle
Air Nozzle
Liquid Nozzle
Nozzle diameters were based on the dimensions of a Laskin nebulizer as reported by
Drew et al. (1978). Three interchangable air nozzles were evaluated, the smallest
diameter being roughly half and the largest being twice the diameter of the Laskin
nozzle, 0.089 cm. The liquid nozzle diameter was fixed at 0.178 cm.
The position of the air nozzle relative to the liquid nozzle was determined by jet
theory and experimentation. Theory states that the centerline velocity of a jet is 98%
of the velocity at the jet face when L=4.44Da (Baturin, 1974). Here, the L/D^ was
held constant so that with changing nozzles similar dynamics were ensured for each
nozzle; thus, the L dimension was changed as different nozzle diameters were
evaluated. The resulting L/D^ values for the small, base, and large nozzles were 3.47,
3.57, and 3.57, respectively. The centerline velocities at these distances were
essentially the same as the jet velocity as it exited the nozzle. Since velocity, and
hence kinetic energy, of a jet is maximum at its centerline, the two nozzles were
aligned so that the air nozzle centerline would lie flush with the tip of the liquid nozzle.
Flat circular disks were used as baffles and were set at distances from the air nozzle
air spreads as it leaves the orifice is given by y/Da=2.2 for x=10Da and y/Da=4.5 for
x=20Da (Baturin, 1974). Here, baffle radius was set to a minimum of twice the jet
radius. Table 1 provides the x/Da and baffle radius values used for this study. In
addition, the effect of no baffle was determined. In this case, the distance between the
nozzle face and the closest perpendicular surface was 12 cm, the distance to the wall of
the drying chamber.
Table 1
Baffle Design
Da (cm) x/Da radius (cm)
0.046 10
20
0.244 0.476
0.089 10
20
0.476 1.746
0.178 10
20
1.746 1.746
The chamber volume was selected based on estimated drying time of the aerosolized
droplets. According to Green and Lane (1964), a 30 nm water droplet will evaporate
in 19.2 seconds at 20*'C and 80% relative humidity, and according to Lefebvre (1980),
a 10 /tm particle will evaporate in 1 second in 90% relative humidity. Since the
experiments in this study were conducted at temperatures between 20 and 22^C and at
relative humidities between 12 and 46%, drying times less than 19.2 seconds were
expected for the maximum droplet size expected. For an air flow of 28.3 Lpm and a
chamber volume of 13.8 L, average residence time was 29 seconds and should have
Experiments
Table 2 summarizes the conditions under which tests were run. Seven conditions
were tested for each of the three baffle positions, with at least one duplicate run for
each condition. Only one of the three variables (D^, V^, Vj) was varied in each run,
while the other two were held at the base values. The values for the velocities were
established by determining the operating ranges of the system. Maximum air velocity was set to the highest value possible through the smallest diameter nozzle, limited by a maximum pressure of 15 psig through the system. Minimum air velocity was
determined by the lowest value through the largest nozzle that would nebulize the liquid
stream.
Figure 2 shows the setup of the nebulizer and chamber. The nebulizer was
connected to compressed air and the liquid fed to the apparatus using a syringe pump.
The nebulizer was contained entirely by the drying chamber with Tygon connections plumbed through the chamber walls.
The base liquid velocity was determined by the amount of liquid that was naturally aspirated by the base nozzle at the base air flow. This natural liquid aspiration rate was
0.18 cc/sec; the corresponding liquid velocity was 0.052 m/sec. Velocity was then
To
-<---1
Vacuum
Valve
Rotameter Filter
Compressed
Air
Valve
Rotameter
Make-Up Air
Inlets
Andersen
Impactor
J
Drying
Chamber
50cc| I I
Syringe Pump
Table 2
Experimental Conditions for Each Baffle Position
Run Da (cm) L (cm) Va (m/sec) V^ (m/sec)
1 0.089 (Base) 0.318 (Base) 125 (Base) 0.052 (Base)
2 0.089 (Base) 0.318 (Base) 75 (Low) 0.052 (Base)
3 0.089 (Base) 0.318 (Base) 200 (High) 0.052 (Base)
4 0.089 (Base) 0.318 (Base) 125 (Base) 0.019 (Low)
5 0.089 (Base) 0.318 (Base) 125 (Base) 0.149 (High)
6 0.046 (Low) 0.159 (Low) 125 (Base) 0.052 (Base)
7 0.178 (High) 0.635 (High) 125 (Base) 0.052 (Base)
However, the range of liquid flows used better represents the flow that would occur if
the nebulizer siphoned liquid from a reservoir. The reservoir method of liquid delivery
was not attempted because a known liquid flow was desired; further, the effect of
concentrating solution in the reservoir was avoided. Significant amounts of the liquid
were not nebulized but rather ran down the side of the nozzle, primarily at the high
metering rates. The nebulized liquid was an aqueous solution of 14 g of sodium
bicarbonate and 1 g of methylene blue dye in 1000 mL of deionized water.
The nebulizer was usually run for six minutes; however, longer aerosolization times were required with small liquid flows, and shorter times were necessary with large
liquid flows. After the aerosolization period, the liquid and air flows to the nebulizer
purge the chamber of all residual particles. This allowed more than 12 air changes in
the chamber and was sufficient to collect all residual particles.
A seven stage Andersen impactor was inverted and attached at the top of the chamber; the impactor fitted tightiy and was sealed to the chamber with clay to ensure that all air entering the impactor would come from the drying chamber. The plates used in the impactor were coated with approximately 0.8 mL of a 1:100 silicone grease in hexane solution to reduce particle bounce. Used plates were removed from the
impactor, placed in petri dishes, and washed with a known volume of deionized water
to dissolve the methylene blue particles. The solution was analyzed with a
Gilford/Beckman spectrophotometer at 660 nm. From a calibration curve, the
concentration was related to the absorbance (concentration=0.079*absorbance,
R2=0.998) and used to determine the mass of particles on each plate.
To determine the droplet size distribution, an analysis of dried particles was
performed similar to the method of Gretzinger and Marshall (1961). The diameters of
residual particles collected on the impactor were defined by the cut diameters of each stage. Then, with knowledge of the concentration of the nebulized solution and the
density of the residual particles, the size of the generated droplets was determined using
(Mercer etal., 1968):
dd=da [c]-i/3[ppl-l/6 (4)
These calculations assume the collected particles were solid spheres. The flow of 28.3
Lpm was drawn through the impactor by vacuum. Since the air flows through the
nebulizer were between 1.2 and 18.6 Lpm, two 1 cm holes were drilled in the chamber
to provide make-up air to the system.
Cumulative size distribution curves for the generated droplets were used to
determine the mass median diameter (650); d^g and d84 were used to analyze the spread
of the distributions.
Results
Table 3 summarizes the di5, dso, and d84 values for each run. Figure 3 provides the cumulative size distribution for the Run 1 condition (Base D^, Base Va, Base Vi) at
a baffle position of lOD^, representative of the tests performed.
Discussion
Terms of interest in evaluating the size distributions included those from Eqs. (1-3).
The loss of kinetic energy, a function of Y^Kl+Wi/W^, appears in several equations
for the mean and median droplet diameter (Wigg, 1964). As kinetic energy increases, more energy is available to break the liquid into droplets; hence, one would predict smaller droplets with more kinetic energy. The Weber number, a dimensionless
parameter (We=Pa Vj2 d^ /ai, with W f= relative velocity and 6^= dropet diameter)
Table 3
Experimental Results
Baffle Run di6 Otm) dso (jim) d84(/*m)
None:
1 7, 5.5, 12.5, 10.5, 20.5, 16.5,
6.2, 6.2 12,12 19, 19
2 28.5, 9.4, 9 17, 16, 17.5 23, 23, 18
3 4.7, 3.7, 4.6 10, 7.5, 9 18.5, 15.5, 18
4 5.9, 5.6, 8 12, 11.5, 14 20, 16.5, 25
5 5.8, 6, 6.2 10.5, 12, 12 14.5, 16.5, 16
6 9.5, 10 15.5, 16.5 23,24
7 5.4,5.4 9.4, 9.4 14.5, 14.5
at 20Da:
1 7.9* 15.5* 24.5*
2 7, 7.5 15, 17 24,25
3 5.8,5.8 14.5, 14.5 22,22
4 5.3,5.2 16, 13.5 36,26
5 7,5.9 17.5, 16 29,31
6 11, 11.2 17.5, 18 24.5, 25.5
7 4.6, 4.4 9, 9 19, 18
at 100^:
1 12, 9.5 20, 17 35, 27
2 12, 13.5 19,19 28,27
3 8, 6.2, 6.2 19, 12, 14 40, 18, 24
4 11, 12, 12 22, 22.5, 20.5 46, 42, 36
5 9.8, 9, 7.5 16, 14.5, 14.5 25, 21.5, 22
6 11.5, 11.5, 11.5 18, 17, 18.5 28, 25, 25
7 6.5,7 14, 14 20, 21.5
The duplicate run for this condition was an outlier and was not used.
100
E 3
ͣ
D
CD
to
(D C (D
I 10
Q. O<D
*-»
e b
H I ...I___I ' I '""I...__' I I I I I I I...I I I I iliiiiliilllillllmrl II I I I...mill i i I i i___"H ' li' i i " i__I___^'' I I I I I
0.01 0.1 1 5 10 20 3040506070 80 90 95 99 99.9 99.99
Cumulative Percent Less Than Indicated Size
Figure 3: Replicate Experiment for Cumulative Size Distribution for the Base D^, Base
Va, Base V^ Condition at Baffle Position at lOD^
relates the droplet diameter to velocity squared. With the nebulizer, the relevant
velocity is that of the air, so dso was evaluated as a function of V^'^. Another
parameter evaluated was obtained from impaction theory, which suggests that
d5o=f(E)^a''Qa)^"^- Additional parameters evaluated include the ratio of nozzle
diameters (D^/Dj), the ratio of baffle distance to air nozzle diameter (x/D^), and the
mass flow ratio (Wj/Wa).
Thus, the following values were hypothesized to affect dso and were investigated:
dso = f[(Va2/(l+Wi/W^, V^-2, (D^3/Q^)0.5^ D^/Di, x/D^, Wj/W^, Q^, Qi ]
Median Diameter
Since the same fluid was used throughout this study, the effects of fluid properties
such as viscosity, density, and surface tension were not considered. Furthermore, the
liquid nozzle diameter was fixed at 0.178 cm throughout the study, so that the D^/Di
term depended only on D^.
Linear regression was used to develop a relationship between the parameters studied
and the median droplet diameter. Both linear and exponential models were investigated. The terms that had the best agreement between measured and estimated
dso included the kinetic energy loss term (Va^/[l+^i/WJ), the air nozzle diameter,
and the baffle position term (x/DJ. Optimization of this model was performed to
determine the exponents for these terms that maximized r2. The best equation was:
d5o=(17.3+0.7)-(47.8+7.6)[Va2/(l+Wi/Wa)] ^-^ -(132+33) Da2+(54+6.4)(Da/x)
R2^j =0.742 (5)
with d5o in /xm, V^ in m/sec, D^ and x in cm.
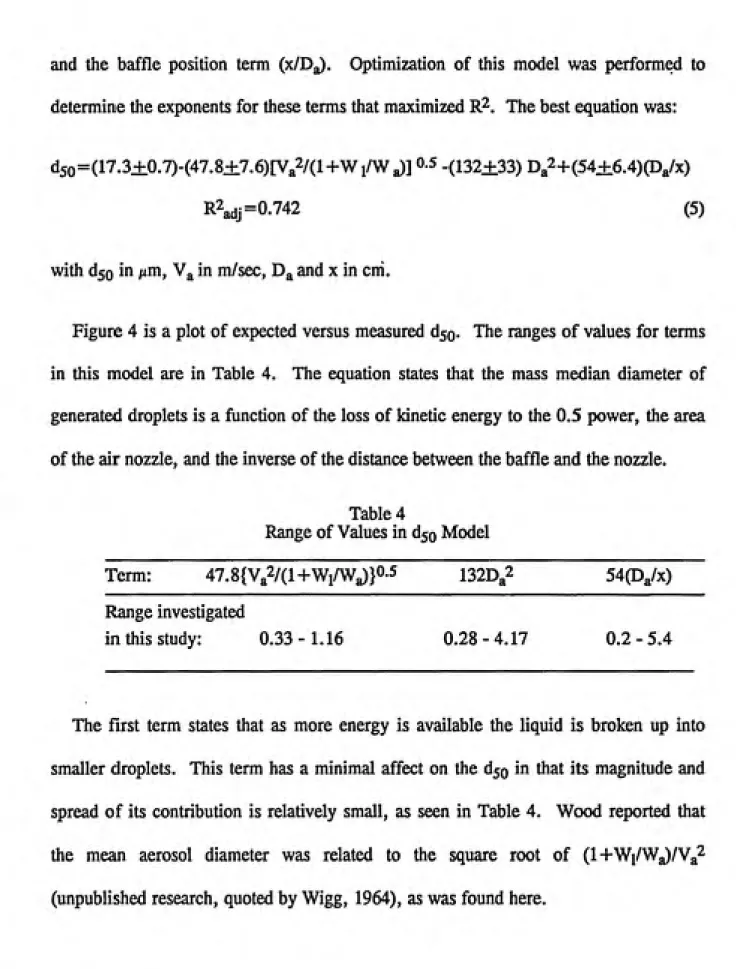
Figure 4 is a plot of expected versus measured dso- The ranges of values for terms
in this model are in Table 4. The equation states that the mass median diameter of
generated droplets is a function of the loss of kinetic energy to the 0.5 power, the area
of the air nozzle, and the inverse of the distance between the baffle and the nozzle.
Table 4
Range of Values in dso Model
Term: 47.8{Va2/(l+Wi/Wa)}0-5 1320^2 54(Da/x)
Range investigated
in this study: 0.33-1.16 0.28-4.17 0.2-5.4
The first term states that as more energy is available the liquid is broken up into
smaller droplets. This term has a minimal affect on the dso in that its magnitude and
spread of its contribution is relatively small, as seen in Table 4. Wood reported that
the mean aerosol diameter was related to the square root of (1+Wi/Wa)/Va2
(unpublished research, quoted by Wigg, 1964), as was found here.
25
20 r
o 15
m
s 10
4$
5 7
0
R2 =
L adj
=0.742
Q /
u
n
o
Mzio o / D
9
[
^oh
^/ A A
[
P^u
[
/ ^lu ,i 1 1 1 1 1 1 1 1 1 1 1 1 1 1 1 1 1 1 1 1 1 1 1
o
n
A
... 1
Baffle at lODa
Baffle at 20Da No Baffle
11111111111111111111
0
5 10 15 20 25
d50, Estimated From Eq.(5) (iim)
Figure 4: Estimated versus Measured dso
Gretzinger and Marshall (1961), Wigg (1964), and Claire (1954) have found that the
nozzle diameter does not greatly affect the size of the droplets generated by air-blast
atomizers. In contrast, MuUinger and Chigier (1974) stated that increasing Da results
in an increase in spray size. However, this study found that the particle diameter
decreased with increasing D^. The variability in the contribution by this term is greater
than that of the kinetic energy term.
The effect of baffle position is counter-intuitive. One would expect the baffle to
remove the larger droplets while the smaller droplets would pass the baffle unaffected;
thus, one would expect d^Q to decrease as x decreased. However, liquid collected by the baffle flowed to its outer edges where the liquid may have been entrained or
re-atomized. The closer the baffle, the more pronounced this effect. Thus, the smallest
d5o values were achieved when re-atomization and re-entrainment were least, namely
when the baffle was the farthest away. Results might have been different if the baffle
had a different shape.
Spread of the Distribution
The cumulative size distributions were not log-normally distributed. When plotted
on log-probability paper, the cumulative distributions appeared to have two linear
portions (Figure 3). A greater slope was found for the smaller particles indicating a
smaller geometric standard deviation, and a smaller slope was found for larger particles
indicating a larger geometric standard deviation.
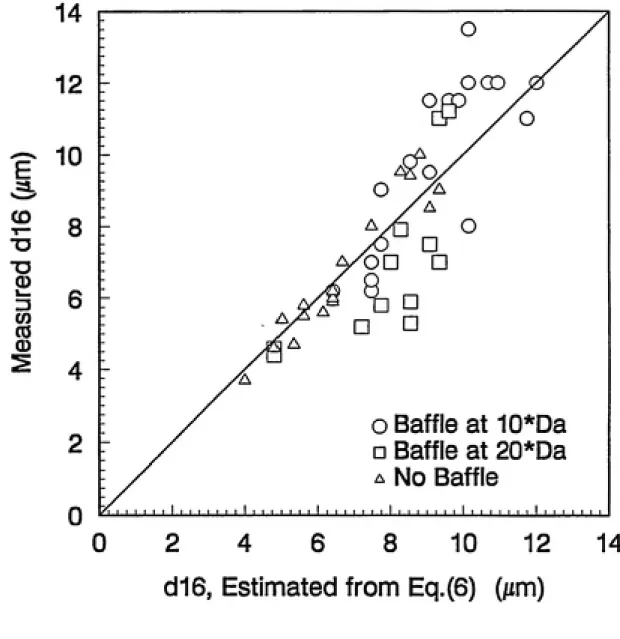
To address the spread of the distribution, d^g and d84 were evaluated as a function
of dso- First-order power functions were fit to the data to develop equations for d^g
and d84:
dl6=0.534*d5o «^g)Lower=1.88 (6)
d84=1.62 *d5o <^g)Upper= 1-62 (7)
Figures 5 and 6 are plots of expected versus measured d^g and d84.
Mercer et al. (1969) state that the geometric standard deviation of a nebulized
aerosol has little variation. The best correlation between the experimental conditions
and di6 or d84 was between these diameters and the median diameter, d5o. Like
Mercer et al., this study found little variability in the dispersion of droplets produced
by atomization.
CONCLUSIONS
The study revealed that decreasing the diameter of a droplet produced by a nebulizer
can be accomplished by increasing the kinetic energy of the system, increasing the air
nozzle diameter, or moving a flat baffle further away from the point of aerosol
generation. The nebulizer was capable of producing droplets with mass median
diameters ranging from 9 to 22 urn without altering the liquid nebulized.
The work reported here is relevant to nozzle sizes and fluid flows appropriate for
small nebulizers and can be useful for medical work, aerosol research, and other
E
CO
ͣ
D CD
(/}
(0 (D
14
12
10
8
6
4
0
OOD
^
A/on
8
o Baffle at 10*Da
n Baffle at 20*Da A No Baffle
...11111 111111111111111111111111111 11111111111
0 2 4 6 8 10 12 14
d16, Estimated from Eq.{6) (/zm)
Figure 5: Estimated versus Measured d^g
50
40 E
^ 30
GO
ͣ
D
T3 <D
S 20
CO o
10
0
8
o Baffle at 10*Da
D Baffle at 20*Da
A No Baffle
-I______I______I______I______I______I______I______I______L
0 10 20 30 40 50
d84, Estimated from Eq.(7) (/zm)
Figure 6: Estimated versus Measured djg
applications where small droplets must be produced. The flow dynamics of an
enclosed nebulizer would be different than the open system evaluated in this study, and
the effect of the parameters evaluated here might be different.
Additional work should be undertaken to evaluate the effect of baffles with different
shapes, for example spheres, cones, or tear-drop shapes. The flat circular baffle tested
in this study created a source for generation of larger droplets at the edges that might
be eliminated by using a baffle of a different shape.
Bibliography
Baturin.V.V. Fundamentals of Industrial Ventilation, 3rd Ed. Oxford, England:
Pergamon Press, 1974, pp. 79-122.
Claire, H and A.Radcliff. "An Air-Blast Atomizer for Use with Viscous Fuels." Journal of the Institute of Fuel 27: 510-516 (1954).
Drew, Robert T., David M. Bernstein, and Sidney Laskin. "The Laskin Aerosol Generator." Journal of Toxicology and Environmental Health 4:661-670
(1978).
Green, H.L. and W.R. Lane. Particulate Clouds: Dusts, Smokes, and Mists, 2nd Ed. Princeton, NJ: O. Van Nostrand Company, Inc., 1964.
Gretzinger, James, and W.R. Marshall. "Characteristics of Pneumatic Atomization." American Journal of Chemical Engineering 7(2): 312-319 (1961).
Kim, K.Y. and W.R. Marshall. "Drop-Size Distributions from Pneumatic Atomizers."
AIChE Journal 17(3) 575-584 (1971).
Lefebvre, Arthur H. "Airblast Atomization." Progress in Energy and Combustion
Science 6:233-261 (1980).
Mercer, T.T. Aerosol Technology in Hazard Evaluation. New York: Academic Press
Inc. 1973, p. 230.
Mercer, T.T., M.I. Tillery, and H.Y, Chow. "Operating Characteristics of Some Compressed-Air Nebulizers." American Industrial Hygiene Association Journal
29:66-78 (1969).
MuUinger, P.J. and N. A. Chigier. "The Design and Performance of Internal Mixing Twin-Fluid Atomizers." Journal of the Institute of Fuel 47:251-261 (1974).
Nukiyama, S. and Y.Tanasawa. "Experiments on the atomization of Liquids in an Airstream." Transcripts of the Society of Mechanical Engineers Japan, 5: 68-75
(1939).
Wigg, L.D. "Drop-size Prediction for Twin-fluid Atomizers." Journal of the Institute
o/Fwe/37(286):500-505 (1964).
Yang, Gui Xiang and Ju Shan Chin. "Experimental Study of the Effect of High Back-Pressure on the Atomization of a Plain Jet Injector Under Coaxial Air Flow."
Aerosol Science and Technology 12:903-910 (1990).
Appendix
Appendix
Cumulative Size DISTRIBUTION
This appendix contains the summary size distribution curves for all of this study's
experiments. The conditions of the experiment are provided in the title by the code which identifies the nozzle diameter, air velocity, liquid velocity, and baffle position, respectively. For example, B,H,B-10 refers to the test condition with base nozzle diameter (0.089 cm), high air velocity (200 m/sec), and base liquid velocity (0.052 m/sec) with the baffle position at lOD^. Replicates of each run condition are included
on the same graph, with the legend indicating the sample identification. The dsg, d^g,
and d84 droplet sizes were taken from these curves.
>
I
100
E
"D
(D
ͣ
*-'
CO
i_
CD C (D
O
I 10
Q. OCD
-i-j
CD
E
CO
b
Cumulative Size Distribution B,B,B-10d
1
1
^1/5-A
o1/18-A
/
/>
/C
)f}
^
^
f^
... /./
j
i
<K
lilL
1 1 1 mil___1 1 1 lllll Mil III! iiuJJXLL Mil IIIIMIII MM .J_._.l---nil 1 III 1.11... 1 1 ill 1111
0.01 0.1 1 5 10 20 3040506070 80 90 95 99 99.9 99.99
f
Cumulative Size Distribution for B,B,B-20cl
>
I
100
E
ͣ
D
CD
+-•
CO
1_
CD c CD
O
Sio
Q. O
Q
CD
CD
E
CO
b
H I I I I Mini___I I I I mil IIIII__I__I I I I I I liiiiiiiiil I 111111 iiliiiiliiii li III li M I liiiiiiii I III I I I I__...I li...__I___1...
0.01 0.1 1 5 10 20 30 40 50 60 70 80 90 95 99 99.9 99.99
> I 100 E 3 ͣ o (D ͣ *-> CO k_ (D C (U O
tio
o CD +-» CD E CO b 1Cumulative Size Distribution for B,B,B-No
; 1 1 i : ; • ͣ i ...i...1
O12/30-A
-^12/31-A
^12/31-B
-1/1-A
y
^
0^
^
"y
F - . . /x
z// ...1...:::::::::...i c . ^mj///
yy
: i J
^ ^
^ ͣ 1 :III iiiii 111... IIIII 1 1 1111 11... 1111 IIII.1.111 MIL .111 X. .XJ-U_iiiiiiiii 111 ii,.-l—J_____IILU-III 1II ii_____1—iiii 111 1 1
0.01 0.1 1 5 10 20 30405060 70 80 90 95 99 99.9 99.99
Cumulative Size Distribution for B,B,H-10d
100 E 3 ͣ D (D ͣ !-• CO l_ (D C a> Otio
o ͣ »-• (D E CO b 1 ... ...1OI/6-A
-^1/21-B
^1/21-C
... ^^
I]/
^
r :::.:, /// /... .../Jf^...
/,
/-d
1 1 1 mil MM ...II.U.I 1 III!lull lull1II11 .LLLL. null 1 Mill iij_U-J..,i„.
Cumulative Size Distribution for B,B,H-20cl
100 > I On E ͣ o (D ͣ +-ͣ (0 0) c 0) O o Q (D +-" O E (0 bo1/9-R
-A-1'130
0 \l ^Pr
^
/ /ͣ
J J -
ͣ
OP / /
//
//
/^
/
___1 1 1 Mill Mill 1 1 11 f 1 III 1 111 llMM nilLlLliLunJ II 1 1 -l—J___liUjJIII 1II 1—1—III 1 1 1 1 1
1
0.01 0.1 1 5 10 20 3040506070 80 90 95 99 99.9 99.99
Cumulative Size Distribution for B,B,H-No
100 ^ •^ E 3 T3 (D (0 (D C (D Otio
o Q o (D ͣ +-• (D E (0 b 1 i0I/4-A
^1/12-C
^1/17-B
/n J D ^
y/^
!^
y
^
^
^
V
/ /^ ...
X /^ ...
F,
...jy\
^ 1
/^
^
«/
1 1 1 1 1 IIIMIIIJOJJ. JJJJ. MM LllllU_LL Mil
0.01 0.1 1 5 10 20 3040506070 80 90 95 99 99.9 99.99
Cumulative Size Distribution for B,B,L-10d
j"^? > I 00 100 E ͣ D (D +-• CO w. (D C (D O O (D +-• (D E (0 b_ 1 . . ... ...1
- - • ... ...
^ 1 /R B
l-A
l-C
OI/O-H>-1/2
4>1/2
rr^l^>^
3 /^-^^
7^
^
^
^
^
M /y/. yVY^U
/ y^/^ vV ^//
<^
^
1111 liXLnilMil 1 1 1 1 II1 1 1 1 Mil 1 1III 1 II 1---1____
1
0.01 0.1 1 5 10 20 3040506070 80 90 95 99 99.9 99.99
>
I
Cumulative Size Distribution for B,B,L-20d
100
E 3
ͣ
D
(D
CO
(D C (U
O
tio
o
ͣ
-ͣ
(D
E
b
1
... ' 1
C
-B
o1/fi.
o 1^0
^1/1c
/D
>
y
35^/
</
1 1 1 Mill---1 1 1 Mill 11,1.11 ,11 1 1 1 1 1 1 1 1 Mil Mil III! 1111 Mil. Illllllll J___\____LLLLL III 11 1 1
>
1—'
o
Cumulative Size Distribution for B,B,L-No
100
E
(D
+-•
nJ
(D C (D
CD
o
(D
*->
(D
E b
1
... 1
OI/4-B
^1/2-B
^1/17-C
...
^
^X)
^
M
-y^ ^
r£
fy...:...:...^..._...
^
y'
(
MM
1111 ...IllLj-u.i jjjj.XLLL iXLL 1 1 1 1 Illllllll 1 I.U- II mil UJ.i-I.J-J___1____1111 1 1 1
0.01 0.1 1 5 10 20 3040506070 80 90 95 99 99.9 99.99
Cumulative Size Distribution for B,H,B-10cl
100 > I E 3 ͣ D O *-» (0 o c o CD o (D O E b 1 ...i...1...101/5-C
^1/12-A
^1/18-B
/ P^
^ O/
(P
^^
=^
^
/ // . . .../.../z..._... 0 o . // /y
yyy /V (^
1 ...1 1 1 1 1 1 ...1.. 1 1111 1111 III! III 1 nil 1 II 1 MM 1...II MM ] 1 nil 1 u...
0.01 0.1 1 5 10 20 3040506070 80 90 95 99 99.9 99.99
Cumulative Size Distribution for B,H,B-20d
>
I
100
E
3
"O 0)
+-•
(0
i_
Q) C CD
CD
tio
o
CD
*ͣ•
(D
E
b
1
... 1 A
H l(\
H /HO f'
H^1/18-U
»
^
^
C/
/^/
oV
/
1 1 Mini, ...II JJJ,J.i__1...L... 1 1 1 1 1 1 1 1 "It I'll III! I'll 1111 MiniMi MM 1 1 mil 1...1 1 ill 1 1 1 1
0.01 0.1 1 5 10 20 3040506070 80 90 95 99 99.9 99.99
>
I
Cumulative Size Distribution for B,H,B-No
100 E 3 TJ (D +-• (0 i_ (D C (D O O I— Q (D +-• E eg b 1
...1... 1
0I/I-C
^1/2
ͣ
A
^1/2-D
^^
P»
^
^
-// /ͣ
. ^/
^X'
Jy ...
Y/.
r-^
y
cT
</
1 1 1 Mill 1 .1 1 lllll-LLLU___1_1_ 1 1 1 1 iiiiiiiii nil XLLLJJJJ.HillXLIiJ IIIIIIIII II 1 1 ...11 1 III 1 t 1
1-0.01 0.1 1 5 10 20 3040506070 80 90 95 99 99.9 99.99
Cumulative Size Distribution for B,L,B-10
100
r
E
ͣ
D
4-'
CO
<D C 0
O
tio
o
<D
+-»
(D
E
eg b
1
01/5-B
^1/21-E
^^
r
^
^
^^
/ 'ͣ J^
y
/
/c/
0.01 0.1 1 5 10 20 3040506070 80 90 95 99 99.9 99.99
>
I
Cumulative Size Distribution for B,L,B-20d
100
E
ͣ
o
+j
CO
(D c o
O
tio
o
Q
•4—
o
0)
E
(0
b
1
^1/8-B
^1/13-A
^
/}
^
//
-//
^ /r
/ /
.
/ J
/
/^/
<y
^c/
jjji ] 111 II11 J—1___liiiij III II 1 1
0.01 0.1 1 5 10 20 3040506070 80 90 95 99 99.9 99.99
>
I
Cumulative Size Distribution for B,L,B-No
100
J"—J
E 3
(D
4-1
(0
c (D
O
o
(D
E (0
b
1
1
...ͣ...r
a1/1-B
^1/12-D
^1/17-A
^ .^
)
... /
^
r
^
...(
1 1 1 mil Mil IIIIIMII MMjjjj. MM nil 1 III 111 1 iiiiiiiii 1111 1... III 1 II 1 1 1...
0.01 0.1 1 5 10 20 3040506070 80 90 95 99 99.9 99.99
I
Cumulative Size Distribution for H,B,B-10d
100
E
"D
(D
+-•
CO
t_
(D C (D
O
I 10
(0
Q.
(D
+-•
(D
E
eg
Q
1
01/16-A
^1/16-B
^
A
^
^^
^
f=^
:::: . . // ... ...
... jy ... ...
1 # , ...
V /
J
Y
/
1111 -LLLL MM MM Lllll JJJJ-IIIIIINI -1—1___IILLL.Ill 1 II 1—1---III 1 1 1 1
0.01 0.1 1 5 10 20 3040506070 80 90 95 99 99.9 99.99
Cumulative Size Distribution for H,B,B-20d
I—' 00 J*^3 100 E 3 T3 (U +-' CO (D C (D O o Q H— o (D ͣ »-• O E eg b 10I/I6-C
^1/16-D
>^
;
j/
/ y/ js ^^^
:x>0^
1 1 1 mil 1 1 1 1 IMIIIIII 1 1 M IIU. III! III! 1 1 1 1 MM IMIIIIII III! Ll-J---ULLL.nil II 1__1— nil 1 1 1
0.01 0.1 1 5 10 20 3040506070 80 90 95 99 99.9 99.99
>
I
100
Cumulative Size Distribution for H,B,B-I
E
TJ
03
+-•
(0
(D C (D
O
tio
o
o
(D
E (0
b
1
...[...1
01/15-E
^1/15-F
J»
y^
^
^y'
y IST
y"^
y^
i/
/
ij)
LlllllMII JIM JIM 1111 IIIIIMIt Mil j_J---lUJO. III 1II 1__1—Iff!' ' I
0.01 0.1 1 5 10 20 3040506070 80 90 95 99 99.9 99.99
>
I O
Cumulative Size Distribution for L,B,Br10d
100 E 3 T3 <D ͣ *-> (0 V-<D C (D O o (D +-« O E CO b 1 i ... ... ...
01/15-A
^1/15-B
^1/18-E
„„^^^
J^^
X J-^ ^Af^- 1
//
'//
//
/c/
1 1 1 mil Mtll 1 1 ,,1 1 1 1 11 111JJJJ. J J ] 1 -1—1___lilU-III! II 1—1---mill 1
0.01 0.1 1 5 10 20 30405060 70 80 90 95 99 99.9 99.99
>
I
K3
Cumulative Size Distribution for L,B,B,-20d
100 E T3 0) +-ͣ (0 (D C (D O o Q •-• (D E (0 Q
01/15-C
^1/15-D
ͣ ^^ ͣ S^/
-^ X ^^ / y p / //y
/
</
1 1 1 Mill JJJJJ__1—L_ lllllllll 111111 1 1
1
0.01 0.1 1 5 10 20 3040506070 80 90 95 99 99.9 99.99
>
I
M
Cumulative Size Distribution for L,B,B,-I
100 £ 3 ͣ o (D +-« <a i-(D C (D O
tio
o Q (D E b 1...:... . 1
o1/14-A
^1/14-B
...
1 -... ... ^
^
//^
^ ^?^
//... ... , yV ... . ...f...i...
1 i
1^^^//
/
^
</c/
Mil nil iiiiiiiii j__|---tUJ-LIll... II 1 1 1 1 1