ACKNOWLEDGMEirrS
ABSTRACT ... 1
INTRODUCTION ... 2
BACKGROtJND... 4
Lung Structure and Function ... 4
Longitudinal Mixing ... 10
Dispersion Studies ... 16
STATEMENT OF PURPOSE ... ... 18
METHODS AND MATERIALS ... 20
Aerosol... 20
Subjects... 21
Experimental Design ... 23
Data Acquisition... 24
Data Analysis... 25
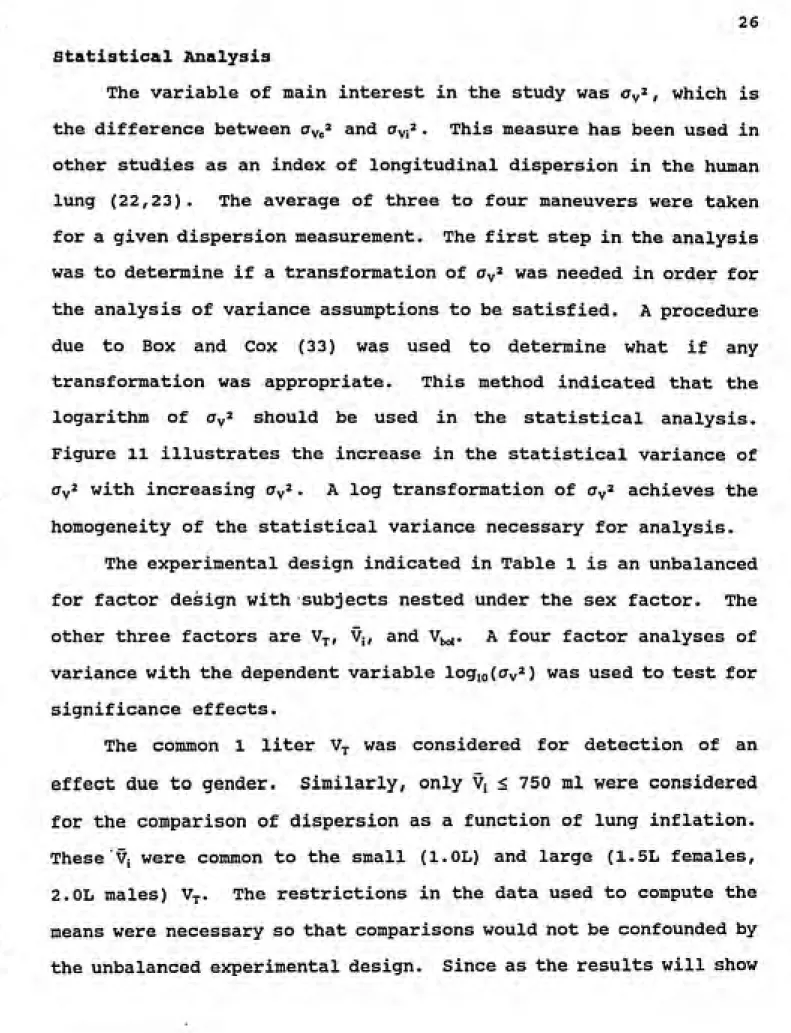
Statistical Analysis ... 26
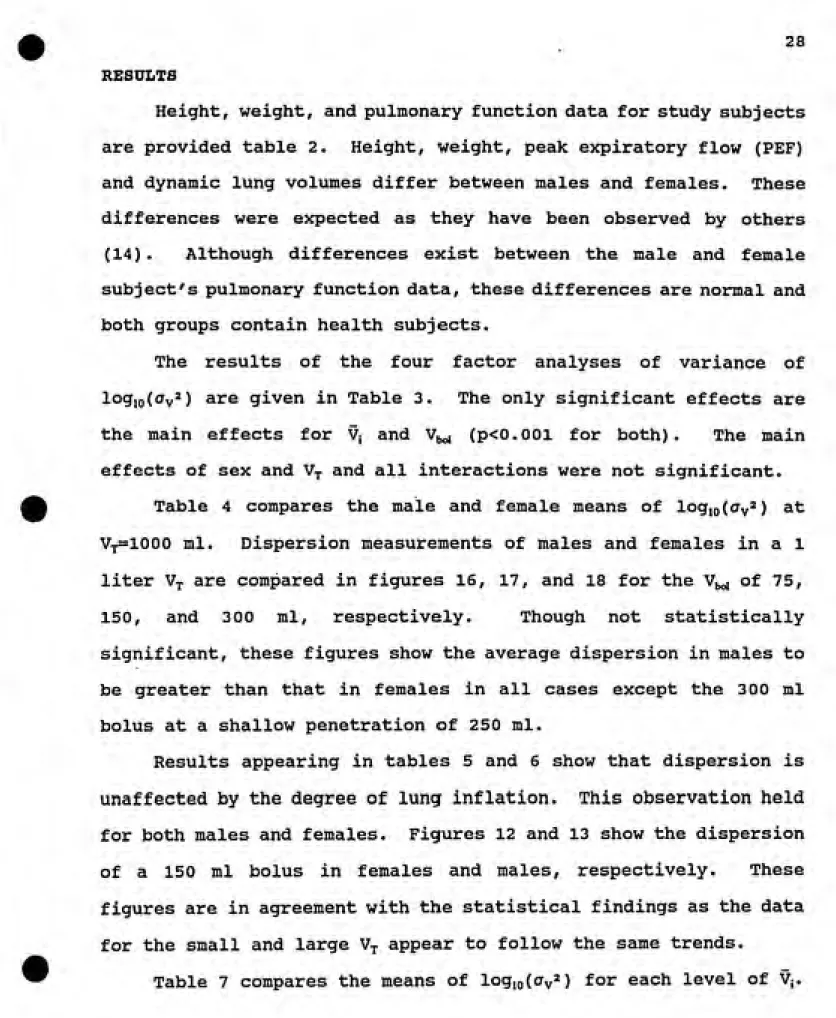
RESULTS... 28
DISCUSSION ... ... ... 30
CONCLUSION... 33
TABLE OF CONTENTS (continued)
APPENDIX... 38
Figure Captions ... 38
Figures... 44
Idealization of Human Airways ... 44
Static Lung Volumes... 45
Velocity Profiles and Tracer Distributions ... 46
Impulse-Response Experiment ... 47
Mixing Mechanisms ... 48
Velocity Profiles at Airway Bifurcations .... 49
Aerosol Bolus Delivery and Acquisition System . . 50
Subject Maneuvers ... 51
Signals used in Data Analysis... 52
Schematic of a Bolus... 53
Statistical Variance in Dispersion measurements . 54 Effect of Tidal Volume in Females ... 55
Effect of Tidal Volume in Males ... 56
Bolus Volume Effect in Females... 57
Bolus Volume Effect in Males... 58
Gender Effects using 75 ml Bolus ... 59
Gender Effects using 150 ml Bolus ... 60
Gender Effects using 3 00 ml Bolus ... 61
Volume Shift in Males and Females ... 62
Tables... 63
Experimental Design of Bolus Experiment ... 63
Pulmonary Function Data ... 64
Analysis of Variance of logioCcTy^)... 65
Effect of Gender on Dispersion ... 66
Effect of Lung Inflation in Females... 66
Effect of Lung Inflation in Males... 66
V; Main Effect Means for logjoCay^)... 67
Vbo, Main Effect Means for logio(CTv^) ... 67
Volume Shift by Levels of Penetration ... 68
C(t) concentration at time t
c radially averaged concentration
D^pp apparent diffusion coefficient
Dl longitudinal diffusion coefficient Dm molecular diffusion coefficient
HWj volume width of bolus at half maximum response
j subscript to denote inspiration (i) or expiration (e)
1 airway length
Nj number concentration
rj dynamic viscosity of air
P pressure
Pe Peclet number = ul/D
r airway radius
R, airway resistance to flow
Rf total lung resistance to flow
Rz resistance to flow for generation, Z
Oy-2 volume variance of bolus
u radially averaged axial velocity
Vboi bolus volume measured by volumetric width at half maximum Vj volumetric mean of bolus
V(t) flow rate at time t V(t) volume at time t
Vt tidal volume
Z lung generation from Weibel's model
ERV Expiratory Reserve Volume FVC Forced Vital Capacity
FEVj Forced Expiratory Volume in first second of forced expiration
FRC Functional residual capacity
PEF Peak expiratory flow
Raw Airway resistance to flow, (Paiveour-Pmouth)/V RV Residual Volume
TLC Total Lung Capacity TLV Threshold Limit Value
TGV Thoracic Gas Volume
1
ABSTRACT
An impulse-response method was utilized for studying the
dispersion of an 0.5 jum aerosol bolus in the respiratory tract of
11 male and 12 female healthy non-smoking subjects. The increasein bolus volume variance (Oy^) between inspiration and expiration
was used as an index of dispersion. The effects of boluspenetration (Vj) , bolus volume (V^,^) , lung inflation, and gender on
CTv^ were investigated. The V; was varied in 250 ml increments over
a subject's tidal volume (Vt) . Procedures were repeated for the V^^
of 75, 150, and 300 ml in two V^ (1.0 and 1.5 L in females, 1.0 and
2.0 L in males). For the experimental conditions, diffusion of the
bolus was negligible due to the low intrinsic motion of 0.5 /xm
particles, a^^ was found to increase in an exponential manner with
V; over the range of experimental data (250 < Vj < 1750 ml) . The
only significant factors were V; and Vi^ (p<0.001 for both). The
effects of gender, V,., and all interactions were not significant.
A volume shift in the mean of the expired bolus toward theperiphery was observed for all subjects. This shift decreased with
increasing V; and was significant for all levels of Vj (p<0.001).
The effect of V^ and the volumetric shift in the center of gravity
of expired aerosol toward the lung's periphery show that expiration
is not the reversal of inspiration and that asynchronous filling
and emptying of the lung is present in healthy individuals. The
continued increase in dispersion beyond a depth of 250 ml shows
conclusively that convective mixing continues well beyond the
INTRODUCTION
The ability to measure changes in pulmonary function in hiomans
is important for the detection of lung disease and acute responses
to air pollutants. Early airways disease, as in the case of
smokers, is thought to occur in the small airways, <2 mm in
diameter (15,17,27,28). Short term exposures to the air pollutant
ozone may also effect the small airways (11). Conventional
pulmonary function measurements primarily reflect the condition of
the large airways, >2 mm in diameter (15,27,28). By the time
functional changes reveal chronic airway obstruction, the resultsof treatment are usually disappointing (28). Detection of airway
disease, while in early stages may aid in slowing the progression of the disease. For example, a smoker may be informed of changes in lung function and encouraged to cease smoking.Deposition in the lung is minimal for 0.5 /iin particles (1,24) . Half micron particles follow gas flow patterns very closely due to their low intrinsic motion, settling velocity of l.OE-3 cm/s and a molecular diffusion coefficient of 6.3E-7 cm^/s (6), which is over 6 orders of magnitude less than diffusion coefficients for most
gases. Longitudinal mixing of 0.5 /nm particles is likely to occur
throughout the lung (24). Longitudinal mixing is analogous to
axial mixing and refers to mixing along the length or axis of an
airway as opposed to mixing in the radial direction.
In a tube, longitudinal mixing is proportional to the radial
velocity gradient and the molecular diffusion coefficient. The
3
molecular diffusion, reduces to a convective mixing situation
resulting from the radial velocity gradient existing between thecenter and wall of an airway.
An impulse-response method with an aerosol of 0.5 /xm particles
may be used to characterize convective mixing in the lung. For a
variety of mixing systems the increase in the variance of a tracer concentration profile with respect to time has been shown to berelated to longitudinal dispersion or mixing (4). The
impulse-response method consists of inserting a volumetrically small bolus
of a tracer into a person's inspiratory volume. The term bolus
refers to a non-ideal impulse which is a small volume of aerosol or gas confined between two larger volumes of clean air. An inhaledbolus is repeatedly divided as the flow of air passes through
bifurcations and penetrates into the lung. On exhalation the airfrom the numerous branches recombines and moves aerosol toward the
mouth. Aerosol concentration and subject flow rates are measured
for inspiration and expiration as a function of time. Comparison
of inhaled and exhaled bolus concentration shows the expired bolus to be distributed over a larger volume than the inspired bolus.The impulse-response method has been utilized as a means of
studying mixing in the lung (10,13,22). This method has detected
early airway damage caused by smoking (13), acute ozone effects on
the small airways (11), and has shown convective mixing to persist
beyond the anatomical dead space and into the lung periphery (10).
With the ability to detect convective mixing beyond the anatomical
4
changes in ventilation patterns (13) or regional time constants
(11).
The purpose of this research was to investigate the role of
physiological parameters in determining the dispersion of an
aerosol bolus. Aerosol bolus dispersion reflects the
irreversibility of convective mixing in the lung. If the temporal
and spacial pattern of filling and emptying of the lung were
perfectly reversible and particles followed the same flow
streamlines on expiration as on inspiration, then an exhaled bolus
would be identical to the inspired bolus.
BACKGROUND
Lung Structure and Function
The main purpose of the lung is for gas exchange between the
air and blood. This exchange occurs across a blood gas barrier by
molecular diffusion. From Pick's law, diffusion is directly
proportional to the surface area of the barrier and inversely
proportional to the barrier thickness. The blood gas barrier is
only approximately 0.5 to 1 ^m thick and has a surface area
approaching 50-100 square meters (28). The lungs' large surface
area is provided by hundreds of millions of alveoli. Understanding
alveolar ventilation requires some knowledge of lung morphology and
physiology.
5
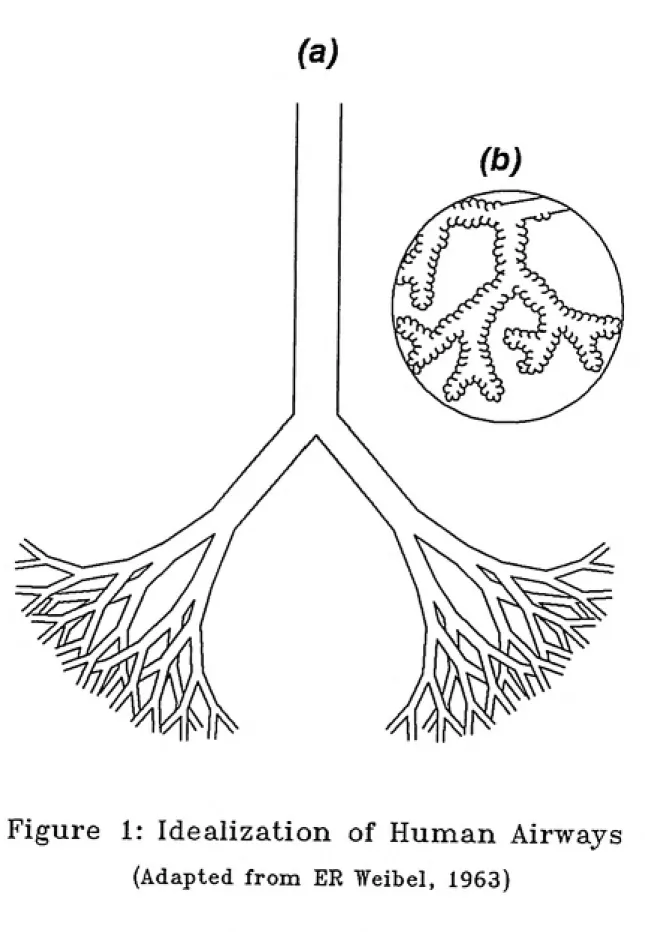
airway structures. Weibel's model 'A' assumes that the lung consists of 23 symmetric and dichotomously branching generations (Z) of airways. In Weibel's model the nasopharyngeal region of the respiratory system is ignored. The trachea is designated as generation 0. Referring to figure 1, generation 1 starts at the end of the trachea where the airway divides and the left and right main bronchi begin. Generation 2 begins when the main bronchi bifurcates and two new airways begin. This branching process continues for 23 generations. For any given generation, Z, there
are 2^ airways. In actuality the lung is not symmetric and
Weibel's model overestimates the number of airways (31). It has, however, served as a useful model for understanding convection and
diffusion in the lung.
Using Weibel's model, the lung is divided into two broad functional regions; tracheobronchial and pulmonary. Generations 0 through 16 compose the tracheobronchial region, which is sometimes referred to as the conducting zone, through which air is transported to and from the distal airways. Rings of cartilage maintain the shape and size of the bronchi in the conducting zone to about the twelfth generation. Cartilage tapers off toward the end of the tracheobronchial region and is completely gone by
respiratory bronchioles (Z=17) , which is where the pulmonary region
begins. At the beginning of the pulmonary zone the airways are
partially alveolated. The airways are fully alveolated with the
onset of the 20th generation.
6 of convection and diffusion. In the proximal airways of the conducting zone, convective motion of the air predominates. After generation 9 the total cross sectional area of the airways rapidly increases and linear velocity decreases making diffusion increasingly more important. The movement of air in the pulmonary zone in the lung is predominately by diffusion.
Inflation of the lung is caused mainly by the contraction of the diaphragm and the external intercostal muscles. As these muscles contract the chest cavity expands. The expansion reduces the pressure in the lung and air flows down the resulting pressure gradient into the lung. Deflation of the lung requires no muscle energy during normal breathing. The elastic properties of the tissue in the alveoli provide the pressure to deflate the lung. When the diaphragm and the intercostals are relaxed the lung naturally recoils and air is exhaled. At the end of a normal expiration the outward retraction of the chest wall balances the
elastic recoil of the lung. When all muscles are relaxed, the lung
volvime at end of a expiration is defined as the functional residual
capacity (FRC).
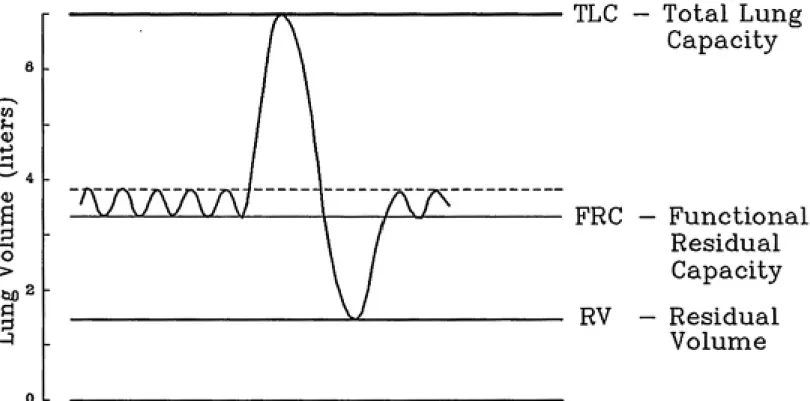
Figure 2 shows FRC in relation to other static lung volumes. Whites and males typically have larger lung volumes than blacks and
females (14). Referring to figure 2, normal resting breathing
consists of inhaling and exhaling 500-750 ml above FRC at a
frequency of 12-15 breaths per minute. The volume inhaled and
exhaled above FRC is referred to as a tidal volume (Vt) . Total
7
inspiration. A complete expiration lowers the lung volume to
residual volume (RV).
An understanding of convective flow in the lung may be
approached by considering flow through individual airways.
Assuming Poiseuille flow in an airway , the flow (V) of gas is
proportional to the driving pressure (P) and inversely proportional
to the resistance (R).
v-i (1)
The resistance (R^) to flow in an airway is
•>. = ^ (2)
where tj is dynamic viscosity of air, 1 is the airway length, and r
is the radius of the aiirway. The dimensions of unsupported airways
in the lung vary with lung inflation. Changes in airway dimensions
are invariant to direction and these changes in 1 and r areproportional to the cube root of changes in TLC (24) . R^ decreases
with increasing lung volume as it is inversely proportional to r*.
Using Weibel's symmetric and dichotomous branching lung model,
the combined airway resistance (Rz) for a generation (Z) is given
by ^
expected in the region of Z=6. Total airway resistance (Rp) to
flow in the lung is
Z=23
Rr= J^ Rz (4)
z=o
Airway resistance and total lung volxome are usually measured
in humans by constant volume body plethysmography. This method
requires a person to be placed in a box of constant volume. While a subject inhales and exhales air from outside the box the air
pressure in the box and at the subject's mouth are measured along
with flow at the mouth. To determine FRC a shutter at the person's
mouth is closed at the end of a normal expiration. When the
persons tries to inhale against the closed shutter the rib cage
expands, decreasing the pressure at the mouth and increasing the
pressure in the box. Boyle's law (P,Vi=P2V2) may then be applied to
determine FRC. The total resistance to flow between the mouth and
the alveoli may be obtained similarly by having the person breathe,
with the shutter open. Recall that flow of gas is proportional to
pressure and inversely proportional to resistance. Total airway
resistance (Raw) may be obtained by measuring the change in volume
and pressure required to produce a given flow. Obstructive lung
diseases caused by airway narrowing increase Raw.
Dynamic lung volumes are used as another measure of airway
function. Two commonly measured volumes for expiratory maneuvers
are forced vital capacity (FVC) and forced expiratory volume in the
9 and the lung naturally recoils. Forced maneuvers require muscular
compression to increase intra-alveolar pressure, which drives air
out of the lung. During forced expiratory maneuvers there is
dynamic compression the airways. This compression causes flow limitation and flow rates become effort independent, i.e. an increase in effort also increases the compression on the airway and no increase in flow is obtained. The driving pressure on
expiration is equal to the sum of pleural and alveolar elastic
pressures. As air flows through an airway the resistance to flow
causes a pressure drop. Once the airway pressure drops below the pleural pressure the airway becomes compressed and flow limited. Early in expiration, airway and pleural pressures reach equilibrium in the region of generation 2, the lobar bronchi (27). As expiration progresses, airways narrow causing increased resistance to flow and the equal pressure point moves distally, deeper into the lung. The increased pressure on the lung may lead to premature closing of airways and thus a reduction in the volume exhaled. In
healthy individuals FVC is nearly the same as the person's vital
capacity (VC) . Normally FEVj is about 80% of the FVC (28) .
Bronchi less than 2 mm in diameter only account for about 20%
of the lungs airway resistance (27) . Due to the low resistance to flow offered by small airways, measurements of FEVl, FEVl/FVC, and Raw primarily reflect the condition of the large airways, >2 mm
(15,28). It is important to note that much early airway damage,
as in the case of smoking, occurs in the small peripheral airways
measurements may not measure the function of the small airways, they have been referred to as a "silent" or "quiet" zone.
McDonnell and Seal (14) have developed prediction equations based on subject's gender, race, and height for normal static and dynamic lung volumes and airway resistance. These equations were determined from analysis of data on 314 volunteers recruited from
the area in and around Chapel Hill, NC.
Longitudinal Mixing
A viscous fluid moving through a tube under laminar flow conditions develops a radial velocity gradient due to the frictional forces at the walls of the tube, resulting in a parabolic flow profile. If there were no velocity gradient, plug
flow would exist and relative motion between molecules would be due
entirely to diffusion. Since a velocity profile does exist, molecules near the center of the tube are displaced down the length of the tube relative to molecules near the wall (see figure 3) .
This relative motion of molecules near the center of the tube is a
form of longitudinal mixing. Since longitudinal mixing is
proportional to the radial velocity gradient, mixing along the axis
of a tube is generally expected to be less for turbulent than for
laminar flow.
Longitudinal mixing in a straight tube is traditionally
described for the one-dimensional case (22).11
Where Dl is an effective mixing coefficient which is equal to the
s\im of a molecular diffusion coefficient (D^) and an apparent diffusion coefficient (D^pp) due to the flow profile, and u and c are the radially averaged velocity and concentration, respectively,
at an axial tube position (X).
Levenspiel and Smith (12) showed that longitudinal mixing may
be characterized in a manner similar to molecular diffusion. That
is, a longitudinal dispersion coefficient, Dl, may be determined
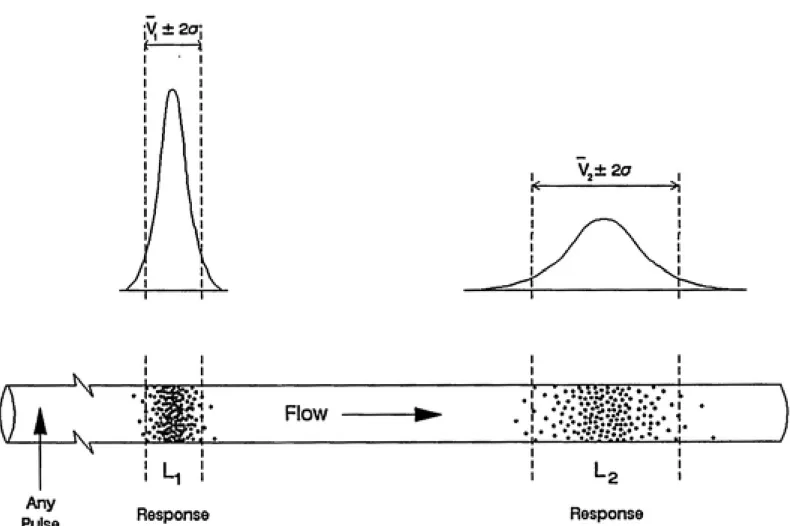
which is analogous to the molecular diffusion coefficient. Using an impulse-response type experiment, see figure 4, Levenspiel and
Smith introduced the concept of using the variance of a
concentration profile with respect to time as a method for
evaluating the longitudinal dispersion coefficient. Levenspiel and
Smith's method was limited to the case of a tracer injected as
delta function into an infinite length pipe. Producing a delta
function of the tracer would require that some finite amount of the
tracer be inserted in zero time. Van Der Laan (25) extended this
concept to the case of a finite pipe. Aris (3) showed that a
non-ideal tracer injection could be used as long as the tracer
concentration was measured at two positions downstream of the
injection. Bischoff (4) later showed that the change in the variance between the two positions was identical to the variance in
the case of the ideal tracer injection.
Taylor laminar diffusion is the balance developed in a
sufficiently long tube between radial diffusion and axial
axial stream and Taylor diffusion. Taylor laminar diffusion may increase longitudinal mixing in generations 8 to 12 (24,29,30).
When passing through a bifurcation a velocity profile is altered.
It has been shown that the inspiratory profile is sharper than the
more flattened expiratory profile (8,20). Without a well developed
velocity profile Taylor diffusion is reduced or eliminated.
Ultman and Blatman (21) recommended a developing dispersion
theory for inspiration and a redeveloping dispersion theory for
expiration. Developing dispersion theory refers to the case where
the effect of Taylor diffusion on longitudinal mixing is
continually increasing as depth into the lung increases. On
exhalation, four vortices flatten the velocity profile at
bifurcations and so redeveloping dispersion theory was adopted.
For redeveloping theory, velocity profiles are destroyed at each
bifurcation and so must be redeveloped. As the velocity profile
reforms the effect due to Taylor diffusion increases. Figure 6,
adapted from Schroter and Sudlow (20), illustrates the velocity profiles expected for inspiration and expiration. Empirical
relations for inspiratory-like and expiratory-like flow mixing
coefficients were developed by Scherer et al. (19). These
experimental mixing coefficients are similar to theoretical
coefficients developed by Ultman and Blatman (21).
Half micron particles follow gas flow patterns very closely
due to their low intrinsic motion, settling velocity of l.OE-3 cm/s
and a molecular diffusion coefficient of 6.3E-7 cm^/s (6). The
13 diffusion, is expected to be in excess of 2000 throughout the lung for 0.5 jum particles during normal breathing (24). Longitudinal
mixing of these particles therefore reduces to the case of
convective mixing. Longitudinal mixing of particles in this size
range is likely to occur throughout the lung (24).
The use of a bolus composed of a suspension of 0.5 jim particles should provide more information on the convective mixing in the periphery of the lung than a gaseous bolus. Dispersion of gases distal to the terminal bronchi is dominated by molecular diffusion in both the radial and axial directions. Due to the high rate of diffusion, gaseous molecules are exchanged with residual air or lost to the walls and insufficient concentrations of the gas bolus are recovered for dispersion analysis. Helium and sulfur
hexafluoride have molecular diffusivities of 0.698 and 0.0923
cm^/s, respectively. For comparison, recall the molecular diffusivity of a 0.5 /xm particle is only 6.3 x 10⁻⁷ cm^/s (6). Compared to other particles the use of particles in the 0.5 /xm size maximizes recovery by reducing deposition by diffusion,
sedimentation, and impaction (24,31).
When using the impulse-response method it has been customary
to determine the moments of the tracer concentration with respect
to time. The application of this method to the studies of the human respiratory tract requires that the moments of the tracer
concentration be determined with respect to volume to account for
varying flow rates.
tracer passing the mouth during inspiration or expiration.
Determination of the zeroth moment of an aerosol bolus gives the
number of particles (Nj) passing through the mouth:
Nj = f C{t) V^(t) dt (6)
Where C is number concentration, V is flow, and the subscript j
refers to inhalation (i) or exhalation (e) . The integration
limits, a and b, refer to the ends of the concentration profile
where the concentration signal has reached 0. By calculating the
number of inhaled (Nj) and exhaled (N^) particles it is possible to
determine the fraction of aerosol recovery (Nj/N;) .
The mean volume (Vj) of the bolus concentration profile with
respect to the end of inspiration is the first normalized moment or
center of mass:
f C(t) V(t) V{t) dt
^^=-^,--- <^>
J C(t) V{t) dt
where V is cumulative volume.
The depth of penetration of a bolus is defined as the mean
volume, Vj, of an inhaled bolus. This terminology is used because
the first moment is the volume of air following the center of mass
for inspired bolus. Assuming no deposition, if the pattern or sequence of filling and emptying of the lung is reversible and the
15
mass of the exhaled bolus, V^, will be equal to V;. Deposition of
aerosol in the lung from a bolus would probably be greater for the beginning of the bolus as it would penetrate most deeply into the lung. This non-uniform deposition from the bolus would tend tocause Vj to be sightly less than Vj.
The second moment of the bolus is the volume variance (ay*):
J C{t) y(t)2 v{t) dt
f at) vit) dt
/ - ^--- - ^/ <8)
The volume variance of an inhaled aerosol bolus (ffvi*)
describes the distribution of aerosol as it is inhaled. As the
aerosol moves through the lungs it becomes more disperse. On
exhalation Oy^^ reflects the sum of the initial aerosol dispersion
and any subsequent dispersion occurring in the lungs. If flow streamlines were exactly the same for inspiration and expiration, then particles would be expected to retrace their paths and an exhaled bolus would appear the same as the inspired bolus and Oy^would equal a^^^ . This is only valid if we assume nondiffusing
particles, which is not a bad assumption for particles in the 0.5
/im size range. In the lung, velocity profiles differ between
inspiration and expiration which could lead to not completely
reversing the axial streaming process.
where CTy* describes the net pulmonary mixing (24) . Bischoff (4) showed that the increase in Oy^ between two measurement points was mathematically equal to the increase in Oy^ between a perfect
impulse and a downstream measurement point.
Dispersion Studies
Recent studies (2,11,13) have shown correlations between the
dispersion of an aerosol bolus and lung function. Anderson et al. (2) showed an increase in bolus half width (the volumetric width of a bolus measured at one half the maximum concentration) and a shift in the mode of expired aerosol concentration with the degree of lung damage caused by cystic fibrosis in patients compared to healthy subjects. The mode shift of the expired bolus was found to move proximally toward the mouth in patients and distally toward the periphery in healthy subjects. Investigators concluded that the shift in the bolus mode was an indicator of asychronous filling and emptying of large units of the lungs, such as lobes. FEVi/FVC was correlated to dispersion in cystic fibrosis patients. This
correlation, however, was not seen in normal subjects.
A study involving healthy subjects exposed to ozone, conducted
by Keefe et al. (11), found an increase in bolus half width after
ozone exposure. Spirometric data showed FVC and FEVl to be
significantly reduced by ozone exposure. Although both spirometry
and the aerosol bolus were changed significantly by ozone exposure,
there was not a significant correlation between bolus dispersion
17
dispersion may have reflected different changes in lung function
than those detected by standard pulmonary function tests.
McCawley and Lippmann (13) found increased bolus dispersion in
smokers compared to a matched pair of non-smokers. Spirometric
tests did not detect any differences between the two groups. This
study also addressed the effect of changing the V^ and
preinspiratory volume on dispersion as measured by a peak
dispersion index, which is the percentage of the maximum bolus
concentration exhaled to the maximum bolus concentration inhaled.
A linear regression of the data showed dispersion to depend only on
the penetration volume of the bolus and showed no effect from changing either the V^ or the preinspiratory volume. Regardless of the method of measuring dispersion other studies have also found linear relationships between bolus dispersion and penetration
volume (2,10).
Heyder and Davies (9) using a 300 cubic centimeters (cc)
bolus, released at the beginning of a subject's inhalation, found
dispersion to increase with Vj at constant expiratory reserve
volume (ERV) . ERV is the lung volume between FRC and RV (see
figure 2). Since the bolus was released at the beginning of the
subject's inhalation, an increase in Vj was also an increase in the
depth of penetration. Changes in the ERV were not found to
influence dispersion at a constant V^. However, there was an
increase in the recovery of particles with increasing ERV's.
Ultman (21-24) has extensively studied the theory of
humans with gaseous boluses composed of helium and sulfur
hexafluoride. Based on these studies, mixing in the conducting airways (0<Z<17 in Weibel model) is principally caused by convective mixing. Distal to the terminal bronchi (Z>17),
diffusion predominates due to decreased axial velocity as a result
of increased cross sectional area of the lung.
Heyder et al. (10) studied convective mixing in the lung using
a bolus composed of 1 /xm particles of di(2-ethyl-hexyl) sebacate.
As previously stated, longitudinal mixing reduces to the convective
mixing case for an aerosol with low intrinsic motion. By using an aerosol as a tracer of air flow patterns, Heyder et al. (10) were
able to show that convective mixing continues to be an important
transport process in the lung periphery.
STATEMENT OF PURPOSE
The purpose of this study was to investigate the role of physiological parameters on longitudinal dispersion of an aerosol
bolus. Of primary interest were:
1. Depth of bolus penetration, Vj, into the lung,
2. Degree of lung inflation,
3. Bolus volume, Vy^, and
'-'ͣͣ'Wt'J^^^y
19 From previous studies, convective mixing was expected to increase bolus dispersion as a function of V; to at least one liter (2,10,13). This trend was explored and extended to greater depths
in the lung.
The effect of lung inflation was explored by comparing the aerosol dispersion as a function of the depth of bolus penetration for different V^.. All V,. were started from functional residual capacity (FRC). Airway caliper is directly related to lung inflation. As the lung inflates airways beyond the anatomic dead space increase in diameter. Thus the volume of individual lung generations increases with increasing lung volume. Consider a bolus penetrating 500 ml into the lung and recall that V; is defined
as the volume of air from the bolus center of mass and the end of
inspiration. This bolus would be expected to pass more bifurcations in a one liter V^ than in a two liter V^. Dispersion measurements were be made in two Vf for each subject.
The effect of 'V^^^ on dispersion is, of yet, unexplored. If mixing in the lung is purely longitudinal, then regardless of the input the overall mixing should be the same. Differences in the sequence of filling and emptying of lung units constitutes
differences in the regional time constants of the units and would
not be a non-longitudinal processes. If differences in time constants do exist, then dispersion measurements may vary with V^.
Male and female subjects were also compared in a common V^ of one liter. Females typically have smaller lungs than males. If
a bolus passes, then females may have greater bolus dispersion for
a given depth of penetration into the lung than males. Information
on aerosol dispersion in females is sparse or nonexistent. This study provides dispersion data on normal, healthy females.
METHODS AND MATERIALS Aerosol
The experimental setup is shown in figure 7. Nonhygroscopic, 0.5 jum, triphenyl phosphate (TPP) particles were produced by
nebulizing a solution comprised of 2.0 gram TTP in 100 ml of 94.5%
ethanol (U.S.P. alcohol). Droplets of solution arising from a three jet Collison nebulizer passed through a heating coil (l inch inner diameter, 2 ft length) for ethanol evaporation. Clean air then diluted the flow before passing through a charcoal filter for ethanol removal. The flow was then diverted through a
T-connection. One branch of the connection allowed flow to be
continuously exhausted. The other branch lead to a solenoid valve. Opening the solenoid valve allowed aerosol to mix with a subject's inhaled air.
The aerosol generation system is the same as used by Keefe et al. (11) and similar to that used by McCawley and Lippman (13) . The particles had a geometric standard deviation between 1.2 to 1.5, as reported by McCawley and Lippman (13) and Keefe et al.
21
Triphenyl phosphate has been used in recent studies (11,13,18)
with no reports of adverse health effects. The American Conference
of Governmental Industrial Hygienist (ACGIH) has recommended a
Threshold Limit Value (TLV) of 3 mg/m^, which was recommended on the
basis of a study on 32 men employed in the manufacture of TPP (32) .
Fourteen of these workers were exposed to an estimated daily time
weighted average airborne concentration of 3.5 mg/m3 for as long as
ten years. No ill effects were observed in these workers although
there was a slight, but statistically significant, decrease in red
blood cell cholinesterase activity.
The risks to subjects from the inhalation of TPP in this study
were considered minimal. This conclusion of minimal risks was
based on the use of TTP in previous studies and the low level of
subject exposure. Possible exposure of subjects to TTP was limited
to approximately a four hour time period and to less than 100
breaths containing aerosol. Total possible subject exposure to the
TTP was less than 1/75 of the TLV.
Subjects
A group of 11 male and 12 female, nonsmoking, healthy
volunteers were recruited from the area in and around Chapel Hill,
NC. Prior to the recruitment of subjects, this study was approved
by the Committee on the Protection of the Rights of Human Subjects, School of Medicine, University of North Carolina at Chapel Hill.
Subjects recruited for the study were informed of the purpose and
participation. After an opportunity to have questions related to
this study answered, subjects were asked to sign a statement of
Informed Consent.
To be eligible for recruitment, all potential subjects were
required to be between the ages of 18 and 40 years, non smokers for
at least the past one year and no history of more than 0.2 pack years (a pack year is 20 cigarettes per day for a year) , no recreational drug use within six months and no history of regular drug use exceeding once per week, no history of cardiorespiratory
disease, no history of hay fever or asthma, and no viral illness
within the past month. Testing for pregnancy in female subjects
and sickle cell disease in black subjects was also conducted.
Pregnancy or sickle cell excludes potential subjects from the
study. Recruited subjects were trained in the performance of
spirometry and plethysmography. Measures of peak expiratory flow
(PEF), FVC, FEVl, Raw, and Thoracic Gas Volume (TGV), which is
approximately equal to FRC, were completed in triplicate the day of
the study. Spirometry was conducted in a standing position on a
dry seal spirometer (CPI model 220). A subject's PEF, FEVl, and
FVC were taken from the maneuver with the greatest sum of FEVl and
FVC. Plethysmography was performed in the sitting position in a
constant volume body Plethysmograph (CPI model 2000TB). Three
plethysmography measurements were averaged to determine a subject's
Raw and TGV.
23 continuation in the study were FVC > 80% predicted, FEVl/FVC > 75%, and Raw < 2.0 (cm HjO)/liter/sec. Possible obstructive and restrictive diseases would have been indicated by FEVl/FVC < 75% and by FVC < 80% predicted, respectively. Predicted lung volumes were determined using regression equations developed by McDonnell
and Seal (14) for the study population. An elevation in Raw would
also have been an indicator of obstructive disease.
Experimental Design
The strategy developed for this study was designed to
investigate the effect of four parameters on dispersion of an aerosol bolus with a minimum number of maneuvers. The parameters under investigation were depth of bolus in the lung, degree of lung
inflation, V^^, and gender. Table 1 shows all the possible
combinations of parameters.
To determine effect of penetration of a bolus into the lung,
dispersion measurements were made at 250 ml increments in each V^. Subject maneuvers are illustrated in figure 8. Identical
procedures were followed for three Vb^, of 75, 150, and 3 00 ml.
After a bolus release during inhalation, subjects continued to
inhale to their target V^ and then were instructed to exhale to
residual volume. Subjects were given approximately a one minute
rest between maneuvers. The average of three to four maneuvers
were taken for a given dispersion measurement.
for all subjects. The 1.5 and 2 liter V^ were reserved for female
and male subjects, respectively. All Vj were started from
functional residual capacity. A flow rate of 40 1pm was used for all maneuvers. This flow was chosen because of its use in previous
studies (11,13).
Data Acquisition
A Dell 386 computer equipped with analog to digital board
(Data Translation, model 2801A) was used to control bolus release
and to acquire data. Flow, volume, and concentration signals were acquired at the rate of 200 Hz and saved for subsequent dispersion
analysis. Figure 9 illustrates the three signals acquired for each
bolus. The flow signal was determined using a Fleisch
pneumotachograph and pressure transducer. The concentration signal
was obtained by means of an in-line Sinclar-Phoenix aerosol
photometer with a linearizing circuit. Analog integration of the flow signal was used to trigger the opening of a solenoid valve
releasing aerosol into a subject's inhaled airstream at a
predetermined volume. The solenoid valve was closed when the
volume signal reached the sum of the trigger volume and the V^^.
As an aid for the bolus dispersion measurements, a VGA monitor
was used for a real time display of a subject's inspired and
25 Data Analysis
Bolus data analysis was based on the first three moments of
the concentration profile with respect to volume. Figure 10
illustrates a bolus plotted as a function of volume. This form of
analysis was chosen due to the physical meanings of the moments and
relation of the second moment to the coefficient of longitudinal
dispersion. All integrations used in moment calculations were
performed with respect to the end of inspiration.
Prior to signal analysis the concentration signal was smoothed
at 50 Hz with a digital low pass filter. The cumulative volume
used in calculations was obtained by time integration of the flow
signal.
The second moment, Oy^ , was approximated by assuming normality
of the concentration profile and relating the full width at half
maximum response, termed half width (HW) to variance.
a ^ ~~ ^/ (10)
^J 8 In (2)
Assuming that the bolus is normally distributed in volume, 95% of the particles inhaled are located within 2a of the mean volume of the inhaled bolus. This relation provides a more reproducible method of obtaining ay* since it is less sensitive to the low
signal to noise ratio at the edges of the profile than the more
Statistical Analysis
The variable of main interest in the study was Oy,^, which is
the difference between Oy^^ and Oy^ . This measure has been used in
other studies as an index of longitudinal dispersion in the hximan
lung (22,23). The average of three to four maneuvers were taken
for a given dispersion measurement. The first step in the analysis
was to determine if a transformation of ay^ was needed in order for
the analysis of variance assumptions to be satisfied. A procedure due to Box and Cox (33) was used to determine what if any
transformation was appropriate. This method indicated that the
logarithm of ay' should be used in the statistical analysis.
Figure 11 illustrates the increase in the statistical variance of
ay^ with increasing Oy^ . A log transformation of ay^ achieves the homogeneity of the statistical variance necessary for analysis.
The experimental design indicated in Table 1 is an unbalanced
for factor design with subjects nested under the sex factor. The
other three factors are Vt, Vj, and V^,,,. A four factor analyses of
variance with the dependent variable logjo(CTy2) was used to test for
significance effects.
The common 1 liter V,. was considered for detection of an effect due to gender. Similarly, only V; < 750 ml were considered
for the comparison of dispersion as a function of lung inflation. These V; were common to the small (l.OL) and large (1.5L females, 2.0L males) Vj. The restrictions in the data used to compute the
means were necessary so that comparisons would not be confounded by
ͣ
•WS^^iS^WW^^S^-'
27
gender and V^ are not significant they were ignored and an further
analysis was for this reduced model.
The Ryan-Einot-Gabriel-Welsch (REGW) multiple comparison
procedure (34-37) was used on the logio(av*) means to determine if
levels of V; were different from each other. The same procedure was
also used on the logio(av^) means to determine if levels of V,^ were
different from each other.
A volume shift between V^ and V; was investigated to determine
what if any factors were affecting this difference. An analysis of
variance for an unbalanced four factor design was done on the
difference between V^ and V; with subjects nested under the sex
factor. The other factors were V^, V;, and Vboi- No interactions
were included in this analysis. The Box and Cox (33) procedure was
used to determine if a transformation of the difference was
necessary. The results will show significant V; and Vbo, effects.
At each level of these two effects, the hypothesis that the mean is
zero was tested by a one-sample t-test using the error mean square
28
RESULTS
Height, weight, and pulmonary function data for study subjects
are provided table 2. Height, weight, peak expiratory flow (PEF)
and dynamic lung volumes differ between males and females. These
differences were expected as they have been observed by others
(14) . Although differences exist between the male and female
subject's pulmonary function data, these differences are normal and
both groups contain health subjects.
The results of the four factor analyses of variance of
logio<av2) are given in Table 3. The only significant effects are
the main effects for V; and Vbo, (p<0.001 for both). The main
effects of sex and Vf and all interactions were not significant.
Table 4 compares the male and female means of logio(av*) at
Vt=1000 ml. Dispersion measurements of males and females in a 1
liter Vt are compared in figures 16, 17, and 18 for the Vi^ of 75,
150, and 300 ml, respectively. Though not statistically
significant, these figures show the average dispersion in males to
be greater than that in females in all cases except the 300 ml
bolus at a shallow penetration of 250 ml.
Results appearing in tables 5 and 6 show that dispersion is
unaffected by the degree of lung inflation. This observation held
for both males and females. Figures 12 and 13 show the dispersion
of a 150 ml bolus in females and males, respectively. These
figures are in agreement with the statistical findings as the data
for the small and large V^ appear to follow the same trends.
29
Each level of V; was found to be significantly different from all
others (p<0.05). The trend is for dispersion to increase with
increasing V;.
The dispersion for the 300 ml bolus was found to be
significantly less than that of the 75 and 150 ml bolus, which were
not different from each other (p<0.05). This comparison appears in
table 8. Although there is an V^^ effect, the magnitude of the
difference in dispersion between the V^o, is small. Figures 14 and
15 compare the dispersion of the Vbo, in a large V-j. for females and
males, respectively. In these figures it is difficult to discern
the difference in dispersion as a function of V^^, but in general
the dispersion for the 300 ml V^^ is lower that of the smaller V^^.
A shift in the mean volumes, V^ > Vj, was found in the data for
all subjects. In all cases the exhaled bolus had a greater
volumetric mean than the inhales bolus. The illustration of a
bolus in figure 9 shows a shift of approximately 100 ml. This
shift gradually decreases with increasing penetration. The
difference in volume means for levels of V; and Vboi are given in
tables 9 and 10, respectively. At each level of these two factors,
the hypothesis that the mean difference, V^ - Vj, was equal to zero
was rejected. The volume shift was significantly different from
zero for all levels of bolus V; and Vy^ (p<0.001). This shift in
the means was also consistently larger in males than in females as
DISCUSSION
We studied the effects of bolus penetration (V;) , lung
inflation, Vb^i, and gender on mixing in the lung. The significance
effect of V; on dispersion is consistent with the findings of others
(2,10,13).
The observation that changing Vb^i had a significant effect on
dispersion is inconsistent with longitudinal mixing theory (4) . In
a longitudinal mixed system, the error associated with an imperfect
impulse is eliminated by defining dispersion as a^^ (21,22). It
should be noted, however, that although the difference in
dispersion measurements between the V^^ was highly significant it
was small in magnitude, as is illustrated in figures 14 and 15.
There was no significant difference existing in the dispersion
between males and females. Figures 16-18, however, show that males tended to have increased dispersion over females. Referring to table 2, females have smaller dynamic lung volumes than males.
From figure 8, predicted TLC is also smaller for females (5.2
liters) than males (6.9 liters). Using Weibel's (26) dimensions
and modifying them to the predicted TLC for study subjects, females
would be expected to have airways of only approximately 91% the
diameter of the airways in males at the same flows. Due to the
difference in airway diameters, more turbulence is expected in the
airways of females than males. Laminar longitudinal dispersion,
i.e. axial streaming, is generally greater than turbulent
longitudinal dispersion (24).
31 then a difference would also be expected to exist between large and small Vj. Airway diameter increases with lung inflation. For the differences in lung inflation occurring in this experiment, the airways during a maneuver at a small Vt would be approximately 95% the diameter of the airways when using a larger Vj. Reducing airway diameter would again be expected to increase turbulence and
decrease longitudinal dispersion.
Consistent with the lack of an effect of airway diameter of
dispersion, Siekmeier et al. (38), made measurements before and
after bronchoconstriction and showed dispersion as measured by HW to be largely unaffected by increasing airway resistance. Airway resistance increases as airway diameter decreases (see equation 2) .
An argument for increasing dispersion with decreasing airway diameter may also be made. Smaller airways would cause a bolus to
travel further into the periphery passing through more bifurcations
(16) . Using flow visualization of neutrally buoyant and nondiffusing beads, Haselton and Scherer (8) found for cyclic flow, that axial streaming was not fully reversed on expiration. These authors concluded that the more pointed inspiratory velocity profiles lead to net transfer of the beads to deeper volumes. Scherer et al. (19) using a five generation glass model of the bronchial tree, found axial dispersion to be approximately three
result in an exhaled bolus being distributed over a larger volume
than the inhaled bolus. This incomplete reversal is measured by
the dispersion index Oy^ . Since there is an increasing number of
bifurcations with increasing V;, flow irreversibility would be
expected to increase a^^ as a function of Vj.
In all measurements there was a volumetric shift in V^ > Vj.
The bolus mean for expiration was larger than for inspiration.
This shift toward the periphery was also observed by Keefe et al.
(11) and Anderson et al. (2) in healthy individuals. In patients
with cystic fibrosis, Anderson et al. (2) found a shift toward the
mouth V; > Vg. A shift toward the mouth was also observed to
increase with bronchoconstriction (38). Anderson et al. (2) felt
the shift in patients may reflect asynchronous filling and emptying
of large lung units such as lobes. Siekmeier et al. (38)
recognized the volume shift to be a measure of the symmetry of lung
ventilation. As already discussed the leading front of an inhaled
bolus penetrates deeper into the lung and this volume shift toward
33 CONCLUSION
For the range of volumetric penetrations explored in this
study we have found the log of axial dispersion to increase as a
linear function of Vj. By using an aerosol bolus, dispersion was
reduced to mixing by convection. Our data confirms that convective
mixing continues beyond the anatomical dead space and into the
lungs periphery, which is in agreement with the findings of Heyder
and coworkers (10).
The significant effect of Vb^, on dispersion shows the lung not
to be a purely longitudinally mixed system. The larger Vb^, (300 ml)
was expected to have a more balanced distribution in each
generation of airways through which it passed (11) than small V^.
Changes in regional time constants between inspiration and
expiration may have caused the dissimilar dispersion between the
Vbo,. Despite the significant effect of Vboi on dispersion the
magnitude of the effect is small and may be physiologically
unimportant.
The volume shift, V^ > Vj, reflects variations in filling and
emptying (2) . This shift indicates that the pattern of filling and
emptying is not reversible. This indicates mixing mechanisms other
than longitudinal mixing are occurring. A likely mechanism would
be the nonsequential filling and emptying in the lung. In the
nonsmoking healthy subjects used in this study, V^ was always larger than V;. The decrease in the volume shift with increasing Vj may
indicate that there are several mechanisms effecting the volume
Perhaps the dispersion of boluses penetrating deeply into the lung, i.e. a large Vj, are influenced most by variations in parallel ventilation. A bolus introduced to the tidal air early in inspiration may go to a different region of the lung than those released late in inspiration. Variations in lung compliance may lead to the parallel ventilation of a deeply penetrating bolus. Parallel ventilation may be important at or near the end of
inspiration when unobstructed regions could begin to ventilate obstructed areas. Interestingly a volume shift where V; is larger than Vg has been observed for cystic fibrosis patients (2) and
normals after bronchoconstriction (38).
The lack of significance effect of either V-^ or gender on dispersion indicates that small changes in airway diameters do not affect aerosol dispersion. For the same flow rate, greater the linear velocities would have been expected in the airways of females and the 1 L Vj. The lack of V^ and gender effects may also imply the same changes in flow rates will not effect dispersion.
Further experimental work is necessary to better understand
the occurrence of longitudinal dispersion in lung. The use a lung
model composed of a network of tubes, which would eliminate the variability between subjects, may be usefully in studies to better
evaluate the effects of airway caliper and lung volume. It would
also be beneficial to examine unidirectional and bidirectional
axial streaming in a straight tube to avoid the complexities of
35 REFERENCES
1. Altshuler, B., "Behavior of Airborne Particles in the
Respiratory Tract", In Circulatory and Respiratory Mass Transport, Ed. G. Wolstenholme and J. Knight, London, J. & A. Churchill, pp. 215-235, 1969.
2. Anderson P.J., J.D. Blanchard, J.D. Brain, H.A. Feldman, J.J. Mcnamara, and J. Heyder, "Effect of Cystic Fibrosis on Inhaled Aerosol Boluses," Am Rev Respir Disease 1989, 140:1317-1324. 3. Aris, R., "Notes on the Diffusion-type Model for Longitudinal
Mixing in Flow," Chem Eng Sci 9: 266-267, 1959.
4. Bishoff, K.B., "Notes on the Diffusion-type Model for
Longitudinal Mixing in Flow," Chem Eng Sci 12: 69-70, 1960.
5. Davies, C.N., J. Heyder, and M.C. Subba Ramu, "Breathing of half-micron aerosols: I. Experimental," Journal of Applied
Physiology, Vol 32, No 5, May 1972.
6. Davies, C.N., "Breathing of half-micron aerosols: II.
Interpretation of Experimental Results," Journal of Applied
Physiology, Vol 32, No 5, May 1972.
7. Feldman, H.A., " Families of Lines: Random Effects in Linear
Regression Analysis," American Physiological Society, 64:
1721-32, 1988.
8. Haselton, F.R. and P.W. Scherer, "Bronchial Bifurcations and
Respiratory Mass Transport," Science 208: 69-71, 1980.
9. Heyder, J., and C.N. Davies, "Breathing of half-micron
aerosols: III. Dispersion of Particles in the Respiratory Tract," Aerosol Science, Vol 2, pp 437-452, 1971.
10. Heyder, J., J.D. Blanchard, H.A. Feldman, and J.D. Brain,
"Convective Mixing in Human Respiratory Tract: Estimates with Aerosol Boli," American Physiological Society, 1988.
11. Keefe, M.J., W.D. Bennett, P. DeWitt, T.R. Gerrity, "The Effect of Ozone Exposure on the Dispersion of Inhaled Aerosol Boluses in Healthy Human Subjects," Amer Rev Respir Dis
144:23-30, 1991.
12. Levenspiel, O., and W.K. Smith, "Notes on the Diffusion-type Model for Longitudinal Mixing in Flow," Chem Eng Sci 6:
227-233, 1957.
13. McCawley, M., M. Lippmann, "Development of an Aerosol
Dispersion Test to Detect Early Changes in Lung Function," Am.
14. McDonnell, W.F., and E. Seal Jr., "Relationships Between Lung Function and Physical Characteristics in Young adult Black and White Males and Females," Eur Respir J., 4: 279-289, 1991. 15. Miller, A., "Patterns of Impairment," In Pulmonary Function
Tests: A Guide for the Student and House Officer, Ed. by A.
Miller, Grune and Stratton, Orlando, FL, pg 151-181, 1987.
16. Muir, D.C.F., K. Sweetland, and R.G. Love, "Inhaled Aerosol
Boluses in Man," In Inhaled Particles III, Ed. by W.H. Walton, Old Woking, England: Unwin Brothers, 1971: 81-89.
17. Niewoehner, D.E, J. Kleinerman, D.B. Rice, "Pathologic Changes in the Peripheral Airways of Young Cigarette Smokers," N Engl J Med, 291: 755-758, 1974.
18. Palmes, Edward D., "Measurement of Pulmonary Air Spaces Using
Aerosols," Arch Intern Med, Vol 131, Jan 1973.
19. Scherer, P.W., L.H. Shendalman, N.M. Greene, A. Bouhuys,
"Measurement of Axial Diffusivities in a Model of the
Bronchial Airways," J. Appl. Physiol. 38: 719-723, 1975. 20. Schroter, R.C. and M.F. Sudlow, "Flow Patterns in Models of
the Human Bronchial Airways," Resp. Physiol. 7: 341-355, 1969.
21. Ultman, J.S. and H.S. Blatman, " Longitudinal Mixing in Pulmonary Airways. Analysis of Inert Gas Dispersion in Symmetric Tube Network Models," Resp. Physiology, 30: 349-367, 1977.
22. Ultman, J.S., B.E. Doll, R. Spiegel, and M.W. Thomas,
"Longitudinal Mixing in Pulmonary Airways: Normal subjects
Respiring at a Constant Flow," J. Appl. Physiol., 44: 297-303, 1978
23. Ultman, J.S. and M.W. Thomas, "Longitudinal Mixing in Pulmonary Airways: Comparison of Inspiration and Expiration,"
Amer. Physiological Society, 799-805, 1979
24. Ultman, J.S., "Gas Transport in the Conduction Airways," In
Gas Mixing and Distribution in the Lung, Volume 25, Edited by
L.A. Engel and M. Paiva. New York, Marcel Dekker, pp. 63-136,
1985
25. Van Der Lann, E.T. , "Notes on the Diffusion-type Model for
Longitudinal Mixing in Flow," Chem Eng Sci 6: 187-191, 1957.
26. Weibel, E.R., Morphology of the Lung, New York, Academic
37 27. West, J.B., Pulmonary Pathophysiology: The Essentials, 3rd ed,
Ed. by J.N. Gardner, Williams and Wilkens, Baltimore, Md,
1987.
28. West, J.B., Respiratory Physiology: The Essentials, 4th ed, Ed. by T.S. Satterfield, Williams and Wilkens, Baltimore, Md,
1990.
29. Wilson, T.A., K. Lin, "Convection and Diffusion in the Airways
and the Design of the Bronchial Tree," In Airway Dynamics.
Edited by A. Bohuys, Springfield, IL, Charles C. Thomas, pp. 5-19.
30. Yu, C.P., "On Equation of Gas Transport in the Lung," Resp.
Physiology, 23: 257-266, 1975.
31. Yu, C.P. and C.K. Diu, "A Comparative study of Aerosol Deposition in Different Lung Models," Am. Ind. Hgy. Assoc. J., 43: 54-65, 1982.
32. American Conference of Governmental Industrial Hygienist: Documentation of Threshold Limit Values and Biological Exposure Indices, 5* ed., Cincinnati, OH, 1986.
33. Box, G.E.P. and Cox, D.R., "An Analysis of Transformations,"
Y. Royal Stat. Soc. B26, 211-252, 1964.
34. Einot, I., and Gabriel, K.R. , "A Study of the Powers of Several Methods of Multiple Comparisons," J. of the Amer. Stat. Assoc, 70, 574-583, 1975.
35. Ryan, T.A., "Multiple Comparisons in Psychological Research,"
Psych. Bull., 56, 26-47, 1959.
36. Ryan, T.A., "Significance Tests for Multiple Comparisons of
Proportions, Variances and Other Statistics," Psych . Bull., 57, 318-328, 1960.
37. Welsch, R.E. "Stepwise Multiple Comparison Procedures," J. of
the Amer. Stat. Assoc, 72, 566-575, 1977.
38. Siekmeier, R., CH.F. Schiller-Scotland, J. Gebhart, H. Kronenberger, "Phrmacon - Induced Airway Obstruction in Healthy Subjects: Dose Dependent Changes of Inspired Aerosol
APPENDIX
Figure Captions
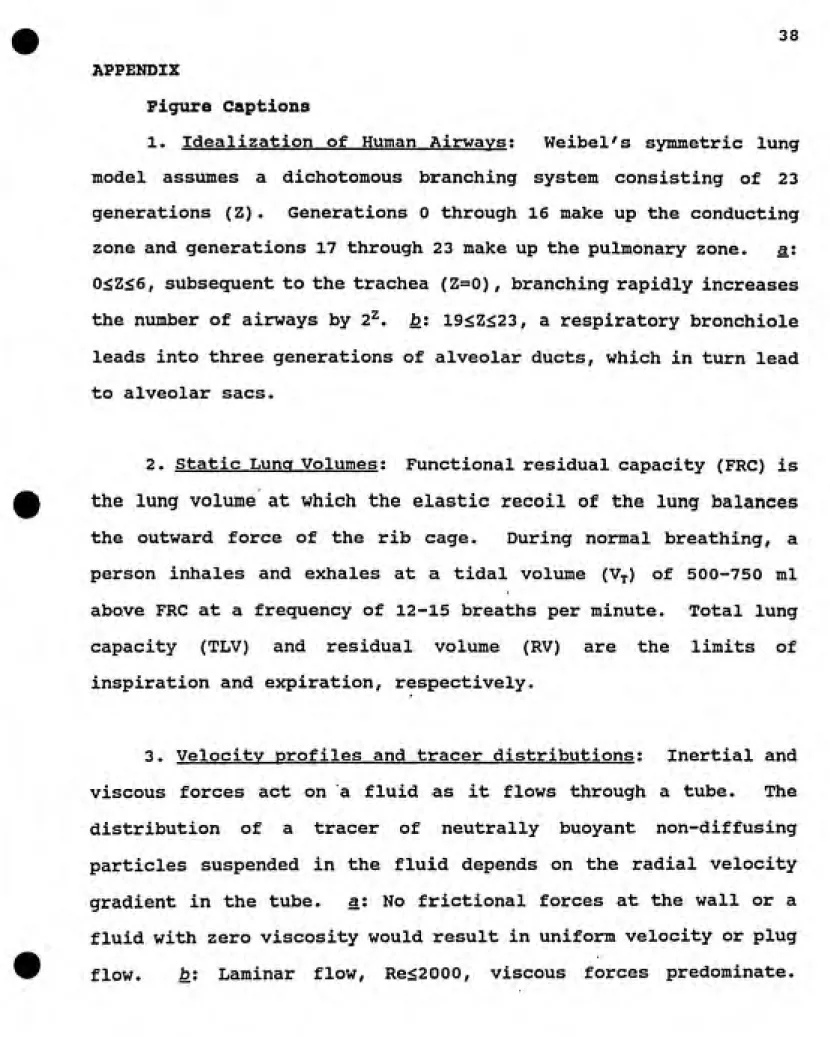
1. Idealization of Human Airways; Weibel's symmetric lung model assumes a dichotomous branching system consisting of 23 generations (Z). Generations 0 through 16 make up the conducting zone and generations 17 through 23 make up the pulmonary zone. a: 0<Z<6, subsequent to the trachea (Z=0) , branching rapidly increases
the number of airways by 2^. b: 19<Z<23, a respiratory bronchiole
leads into three generations of alveolar ducts, which in turn lead
to alveolar sacs.
2. Static Lung Volumes; Functional residual capacity (FRC) is the lung volume at which the elastic recoil of the lung balances the outward force of the rib cage. During normal breathing, a person inhales and exhales at a tidal volume (Vj) of 500-750 ml above FRC at a frequency of 12-15 breaths per minute. Total lung capacity (TLV) and residual volume (RV) are the limits of
inspiration and expiration, respectively.
3. Velocitv profiles and tracer distributions; Inertial and viscous forces act on a fluid as it flows through a tube. The distribution of a tracer of neutrally buoyant non-diffusing
39
Assuming a no slip condition, the velocity will be 0 at the tube
wall and reach a maximum at the center of the tube. The tracer
distribution is altered by the velocity gradient through the
process of axial streaming. Particles near the center of the tube have greater axial transport than those near the wall. c: Turbulent flow, Re>3 000, inertial forces predominate. Vortices or eddy currents diminish the radial velocity gradient, so that axialdistortion of the tracer distribution is reduced.
4. Impulse-Response Experiment; As a tracer moves down a
length (L) of a tube it mixes with the surrounding fluid. The
extent of axial displacement and mixing may be determined by
measuring the tracer's concentration at two positions downstream of an injection point. The normalized first moment of the concentration profile with respect to volume is the center of gravity or volumetric mean (V) of the distribution. The increasein the mean volume (Vj - V^) from the first to the second sampling
point is equal to the system volume between the sampling points. The centralized second moment of the profile is the volume variance(a^). The increase in volume variance (aj* - a^^) between the
sampling points represents the degree of mixing (ay*).
5. Mixing Mechanisms; Longitudinal mixing occurs by the
combined actions of convection and molecular diffusion- The
contribution of convection to longitudinal mixing is proportional
necessary for diffusion is much greater than the time necessary for convection, then velocity gradients axially distort the tracer
distribution establishing an axial and radial concentration
gradient. During this process, radial mixing does not occur and
the particles follow the flow stream lines increasing axial
dispersion by the mechanism of axial streaming. bi If the time
required for convection is roughly equal to or less than the time
required for diffusion, then diffusion contributes to the degree of
longitudinal mixing. Taylor diffusion occurs when diffusion and
convection are at equilibrium. Diffusion reduces the concentration
gradient.
6. Velocity Profiles at Airway Bifurcations: Velocity profiles
are deformed as flow passes through a bifurcation. Inspiratory
velocity profiles tend to be more parabolic than expiratory
profiles, a: During inspiration, the region of maximum velocity at the center of a parent airway reaches a stagnation point at a
bifurcation. At the beginnings of daughter airways, the velocity
profile is skewed and the maximum velocity occurs near the inside
edge of the airway. Secondary flows curve around the wall from the
inside to the outside edges, b: On expiration two daughter airways
empty into the parent airway. Four vortices are formed as the two
flows combine. The occurrence of these vortices reduces the radial
41 7. Aerosol Bolus Delivery and Acquisition Svstem: Aerosol is produced by nebulizing a solution of 1 gram TTP dissolved in 50 ml ethanol. The evaporation of ethanol produces particles of TTP in the 0.5 |im size range. Aerosol passes through a charcoal filter for ethanol vapor removal and flow is continuously exhausted. A bolus is produced by the activation of a solenoid valve, which allows aerosol to dilute with a volumetric small portion of a subject's inspiratory volume. Subject flow rates and aerosol concentration are monitored by a pneumotachograph and photometer, respectively. Data acquisition is started near the end of an expiratory cycle, a bolus is delivered into the subsequent inspiration and data is recorded at a rate of 200 Hz for 10
seconds.
8. Subj ect Maneuvers: All maneuvers were started at
functional residual capacity. A 1 liter tidal volume (V^) was
common.to both males and females. Due to male-females differences
in total lung capacity, a larger Vt of 2 liters was used for males and 1.5 liters was used for females. Bolus were positioned at 250 ml increments in each V^. Following an inspiration containing a
bolus, subjects were instructed to exhale completely. For each V^
there were a total of 24 different maneuvers performed by females and 30 performed by males. Flow rates were maintained at 40 1pm9. Signals used in Data Analysis; Signals were acquired at a
200 Hz sampling rate. Prior to signal analysis the concentration
signal was smoothed at 50 Hz with a digital low pass filter. The
cumulative volume used in calculations was obtained by time
integration of the flow signal.
10. Schematic of a Bolus; The above bolus was targeted for a
volumetric penetration (V;) of 750 ml in a 2 liter V,.. In this
example, the actual Vf was 50 ml greater than the target V^. The
extra inspiratory vol\ime slightly increased the actual Vj. Insufficient inhalation would have caused an decrease in V;. The
points aj and bj, are the integration limits for a bolus, where the
subscript (j) denotes either inspiration (i) or expiration (e) . On
the volume axis, 0 is the point of maximum inspiration.
11. Statistical Variance in Dispersion measurements; Volume
variance, Oy^ , is used as an experimental measure of dispersion. The statistical variance in measurements escalated with increasing dispersion. A log transformation of the dispersion measurements
improves the homogeneity of statistical variance across the
experimental data range.
12&13. Effect of Tidal Volume; Comparison of the dispersion of
a 150 ml bolus shows no effect of the inspiratory volume in females
43 14&15. Effect of Bolus Volume: Dispersion of the 300 ml bolus was found to be significantly lower than the dispersion of the 75
and 150 ml bolus in females and males.
16-18. Gender Effects; Although no statistical effect of gender was found, dispersion appears to be greater in males than
females.
19. Volume Shift in Males and Females; V^ was greater than V; for all subjects. The mean shift was slightly larger for males
(a)
mm
Figure 1: Idealization of Human Airways
m
<D
O
>
:=!
AA'AA
TLC - Total Lung
Capacity
FRC
-RV
Functional
Residual
Capacity
Residual
Volume
(a)
PLUG
(b)
«'...«
==g:
LAMINAR
(C)
^
^
TURBULENT
Figure 3: Illustration of Velocity Profiles
;V±2a
V + 2a
ͣ
V
A
V
Flow
.ͣͣ 1.
• I « 1
'.
I-
:---H-Any
Pulse
Input
I
Response
L.2
Response
Figure 5: Mixing Mechanisms
V
ooooooooooooooo
ooooooooooooooo
,000000000000000
ooooooooooooooo
ooooooooooooooo ooooooooooooooo
ooooooooooooooo
ooooooooooooooo 00000000000000
do dx
ooooooooooooooo dc
ooooooooooooooo Hx ooooooooooooooo 4"
ooooooooooooooo___________
AXIAL STREAMING
Convection without Diffusion
(a)
V
5 o o o o S 5 o 5 o 5 o o o
000 00000000 00 00
o o 0000000000000 o
000 0000000000 000 o oo 00000000000 o
o o o 000000000 o o o 000000000000 o o
o o o 000000000 o o
o oo 0000000000 o
000 0000000000 oooo
o o ooooooooooooo o
000 00000000 00 00 ___o '^ "___r> o o__a__n n r,__q____q________q_____q_____
TAYLOR DIFFUSION
Diffusion and Convection Equilibrum
Figure 6: Velocity Profiles at Airway Bifurcations
(Adapted Schroter and Sudlow, 1969)
Back
Front
Back
(a)
^ Inspiration
m
Front
(b)
AIR 1
DILUTION AIR
/r\
CHARCOAL FILTER
HEATING COIL
n
COLLISON NEBULIZER
w
PHOTOMETER
SUBJECT
2
SOLENOID
VALVE
b.
FILTER
EXHAUST
PNEUMOTACHOGRAPH
INTEGRATOR PHOTOMETER ELECTRONICS
MICROPROCESSER (with A/D .BOARD)
Figure 8: Subjects Maneuvers
m
(D
"3
u
<ii 4
a °
O> PI
o1-_5Q% TLC
JO^TLC
/\
/
/ \
\
:
15—3 sec—^\ -HjV
\
\TLC
1.5 1.0
FRC
RV
CO
U
(D <D *
cd §
S o
>
Hfl 2
0 L
TLC
.76^ TLC___________________g
62% TLC
Time (s)
Figure 9: Signals Used in Data Analysis
V,
3.5
3
-CD
I 2.5
o a
(/} 0)
DC 2
I—
CD
+-ͣ
0)
o 1.5 +-'
o
sz
1
-0.5
0
HW,
V
0
1^
2
Volume (L)
220
200
180 H
1 160
^ 140
o,
120-•g
100g 80
-| 60 H
40
20 H
0 0.2
Dispersion in Males at TV =2, VBOL = 150
8
*
*
H
0.4
""i----1---1---1----1----1---1---r
0.6 0.8 1 1.2
Volumetric Penetration fi)
1.4 1.6 1.8