Investigation of indoor radon concentration in
dwellings of Aleshtar (western part of Iran) and
estimation of the annual effective dose from exposure
to radon
INTRODUCTION
Natural radiation sources are the main cause of radiation exposure for human beings. It is estimated that the contribution of natural sources of radiation exposure to humans is more
than 98% of which 52% is related to the inhalation of radon and its decay products in
indoor environments such as homes and
workplaces (1-3). Radon is an odorless, colorless radioactive gas (4) which comes from the natural decay of uranium in soil and rocks (5). Soil and construction materials are the main sources of radon in homes. Other sources of radon are radon-rich water, natural gas fuel, and air (6). Radon is highly soluble in water; thus, radon gas present in the underlying rocky bed can easily pass through the soil and rocks, inevitably
H. Hassanvand
1, M. Birjandi
2, A. Amiri
3, M.S. Hassanvand
4,
B. Kamarehie
5*¹Master of Environmental Health Engineering, Lorestan University of medical sciences, Khorramabad, Iran 2Department of public Health, School of Health and nutrition, Lorestan University of Medical Sciences,
Khorramabad, Iran
3Department of Geography, Faculty of Literature and Humanities sciences, Lorestan University, Khorramabad, Iran
4Center for Air Pollution Research (CAPR), Institute for Environmental Research (IER), Tehran University of Medical Sciences, Tehran, Iran
5Nutrition Health Research Center and Department of Environmental Health Engineering, School of Health and Nutrition, Lorestan University of Medical Sciences, Khorramabad, Iran
ABSTRACT
Background: One of the most important natural sources of human exposure is inhalation of radon radioactive gas and its decay products in homes and at workplaces. According to the World Health Organization, radon is the second leading cause of lung cancer. This study is the first survey of indoor radon concentration in dwellings of the Aleshtar city (west of Iran).Materials and methods: In this work, radon concentrations were measured in 24 dwellings by using a passive method known as Alpha Track Detectors (ATDs) with CR-39 polycarbonate film for three months during the year 2016. In addition, the annual effective dose due to radon exposure was estimated for residents. Results:The indoor radon concentration ranged from 1.01 to 206.53 Bq/m3
with an average value of 55.19 Bq/m3 (CI (Confidence Interval) 95%: 31.46 -
78.92), and the average annual effective dose to the population in Aleshtar
was estimated to be 1.39 mSv/y.According to the result of this study, there
was a significant difference between apartment buildings and villas as wellas
between different floors in terms of the average radon concentration.
Conclusion: It was found that radon concentration in 20.8% of dwellings was higher than the reference levels recommended by the World Health
Organization (100 Bq/m3).
Keywords:Radon, Indoor Air, CR-39, Iran-Lorestan.
*Corresponding authors:
Dr. Bahram Kamarehie,
Fax: + 98 663 340 8176
E-mail:
b.kamarehie@gmail.com, Revised: December 2018
Accepted: February 2019
Int. J. Radiat. Res., October 2019; 17(4): 659-666
►
Original article
DOI: 10.18869/acadpub.ijrr.17.3.659
entering underground water sources (7). Air released by well water during showering and other household activities may also contribute to indoor radon levels, although this generally makes a relatively small contribution to the total radon level (8). Radon enters buildings through cracks and other pathways in foundation as well
as through heating, ventilating and air conditioning (HVAC) ducts (5).
As radon gas is inhaled, densely ionizing alpha particles emitted by the short-lived decay products of radon (212Po and 214Po) can interact with biological tissues in the lungs, resulting in DNA damage and lung cancer (9). According to the World Health Organization (WHO), in many countries, radon is the second-leading cause of lung cancer after smoking and in non-smokers, is the primary cause of lung cancer (8). The proportion of lung cancers attributable to radon is estimated to range from 3 to 14%, depending on the average radon concentration in the concerned country and the calculation methods
(10, 11). According to the United States Environmental Protection Agency (US.EPA) and
the National Cancer Institute (NCI), radon causes 21,000 lung cancer deaths (equivalent to 10-15% of lung cancer deaths) in America each year (5, 12). Moreover, the percentage of lung cancer deaths attributed to radon is 7.8% in Canada, 5% in Germany, 8.3% in Switzerland, between 3.3 and 6% in United Kingdom, and between 5 and 12% in France (11). According to the World Bank in 2016, about 0.2% of the global disease burden has been attributed to exposure to radon (13).
Since most people spend more than 80% of their time during the day at homes and public exposure to radon occurs mainly in enclosed spaces (14), therefore, there are concerns with this environmental risk factor over the world. In this regard, the United States Environmental
Protection Agency recommends that all buildings should be tested regardless of the area
of the country (5).
Because of the health hazards associated with radon, its concentrations are measured and studied as a comprehensive monitoring program in many areas of the world. The national map of radon gas has been obtained in many developed
660
countries and based on this map, the disease burden attributable to radon is calculated (7). The results of the national radon map show that the average radon concentration in dwellings of Germany, the United States, Canada and England is 49, 46, 28 and 20 Bq/m3, respectively. The worldwide average indoor radon concentration has been estimated at 39 Bq/m3 (11). There are two major approaches to prepare the radon map: 1) area-based; 2 km, 5 km and 10 km grid square resolution (15) and 2) population-based; nearly one sample per 5,800 population (16).
So far, the concentration of radon has been measured in many Iranian cities such as Yazd, Shiraz, Mashhad, Kermanshah, Hamadan, Sari,
Ramsar, Gorgan, Lahijan, Ardabil, Namin, Sar-Ein, Tabriz, Kashan, Khorramabad, Kerman
and Qom (6, 17-27).
Given the importance of this environmental risk factor and the lack of any information on radon concentration in Aleshtar, this study was the first survey of indoor radon concentration in the city. The aim of this study was to measure
radon in dwellings of the Aleshtar city to calculate the effective dose caused by the inhalation of radon. The measurement of radon
gas was carried out in winter 2016 using an alpha track detector (ATD). The parameters that affect radon concentration including type of building (house or apartment), age of building, type of materials used, type of floor, cracking and splitting on the wall and roof, and heating and ventilation systems were also surveyed. The results of the present study could be used to supply data for healthcare providers and help to prepare the Iran radon map.
MATERIALS AND METHODS
This cross-sectional study was carried out in Aleshtar for three months during the winter season of 2016. We perfumed the measurement in this area only in winter because in the above mentioned area, the average temperature is 12.7°C. The estimation of measurement points method based on area was applied to determine
the sampling places. We prepared a map of Aleshtar; the whole city was divided into 24
sections with an area of 1×1 km2. Finally, one dwelling was randomly selected from each area of 1×1 km2 to determine radon concentrations. It should be noted that various studies used the scales of 2×2, 5×5 and 10×10 km2 to measure radon (15). In order to achieve high-precision results in this study, the scale of 1×1 km2 was chosen. Moreover, questionnaires were provided to collect information about the monitoring place and characteristics of houses that may influence radon levels (type of building, age of building, type of materials, type of floor, cracking and splitting on the wall and roof, and
heating and ventilation systems). The questionnaires were completed by the authors.
Furthermore, the geographical coordinates (latitude and longitude) of points were recorded using GPS (Garmin, Germany). The distribution
map of radon in dwellings of Aleshtar was prepared using the ArcGIS software version 10,
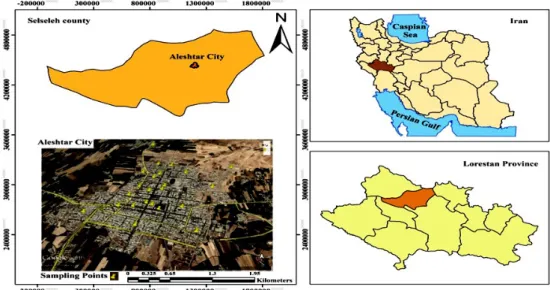
ESRI, USA. Study area
The Lorestan province (figure 1) is located in the west part of Iran. Aleshtar is one of the nine cities in Lorestan that is located in 48 km from Khorramabad, the capital of the province, between 33°32ˊN, 48°27ˊ E with an elevation of about 1580 m above sea level. In Aleshtar, the average monthly temperature is 12.7° C and the average annual rainfall is 500 mm/yr. According
to the latest census data, Aleshtar has a population of 30,251 people in 6033 families.
From a geological viewpoint, the soil structure in the city is loamy.
Indoor radon measurement
This present work was performed by using the ATD with CR-39 polycarbonate film as a passive sampling instrument. The sampler
(Track Analysis System, United Kingdom) consists of a 2.5 × 2.5 cm CR-39 polycarbonate
film placed inside a plastic holder. The alpha particles emitted from radon gas are left as trails on the detectors when placed in the ambient air, which can be detected and determined by using
the electrochemical method and with a microscope.
In order to achieve accuracy and precision of
results as well as data quality assurance, three detectors as the duplicate sample (at least 10% of all the testing locations) and three detectors
as the blank sample (5% of all the testing locations) were considered (3). Thus, in this
study, 30 detectors were distributed and installed in 24 dwellings across the city.
The detectors were placed in the selected
dwellings in accordance with the U.S. Environmental Protection Agency protocol,
which were placed at least 1.5m above the floor, at a distance of 1m from doors, windows and air
conditioning systems, and at a minimum distance of 20cm from walls and other objects;
moreover, the detectors were not placed in damp environments such as bathrooms and kitchens (28).
After exposure time, the detectors were completely covered with aluminum foils and Zip
Kip then sent to the Reference Radon Lab, Central Research Laboratory, Vice Chancellor of
Research and Technology, (Mazandaran University of Medical Sciences). In the laboratory, immediately after removal of aluminum, the sample code number engraved on
the detectors was recorded and then the detectors were etched in 6.25 N NaOH at 85 °C
for 3 hours in a hot water bath. The detectors were then washed with distilled water and dried. Finally, the tracks of the alpha particles were counted by an automated counting system. The counting system, equipped with mechanical
and electronic system, took 30 microscope images from each CR-39 film. The average number of the alpha particles per square centimeter was counted and by using calibration
and conversion factors recorded as Bq/m3. Statistical analysis
SPSS software version 22 and Excel versions 2010 were used for data analysis. In addition to descriptive statistics, the different statistical
tests such as Kolmogorov-Smirnov test, Mann-Whitney U test and T-test were used. P-value less than 0.05 was considered statistically significant.
Dose calculation
The average annual effective dose (mSv/y) to
661
Int. J. Radiat. Res., Vol. 17 No. 4, October 2019the population was estimated using the equation 1, suggested by UNSCEAR-2000 (29).
D= C× F× H× T×F (1) where C is the indoor radon concentration (in Bq/m3), F is the indoor radon decay product equilibrium factor (the equilibrium factor: the ratio of concentration of decay products of
radon to the equilibrium and radon concentration; F=0.4 only if the fraction attached is lower than 0.26 nm), H is the occupancy factor (0.8 for indoor measurement),
T is the residence duration per year (365.25×24=8766 h/y), and Fˊ is the dose conversion factor for whole body dose calculation (9 nSv/h per Bq/m3).
662
Figure 1. Location of Aleshtar in Iran and radon sampling locations in Aleshtar dwellings.
RESULTS
In total, 30 detectors (in 24 points) were exposed in the survey and all of them were sent
back to the lab. The difference between the results of the duplicate samples was less than 5%.
The concentration of radon in Aleshtar
The results of the indoor radon measurements in 24 dwellings of Aleshtar
ranged between 1.01 and 206.53 Bq/m3 with the mean of 55.19±59.32 Bq/m3 (CI 95%: 31.46 - 78.92). Figure 2 shows the results of radon concentration in 24 dwellings of Aleshtar.
The received annual effective dose by exposure to radon
The risk caused by radon levels in the dwellings was estimated using equtatio (1) and
is shown in Table 1. The annual effective dose of
exposure to radon for residents living in Aleshtar dwellings was in the range of 0.025 - 5.21 mSv/y. Factors affecting radon concentrations
Type of building, number of floors and type of kitchen ventilation system were the main factors affecting the concentration of radon in the dwellings as building conditions were compared. Other factors such as building age, location of detectors, materials used in floors and walls, presence or absence of cracks, type of windows and type of heating system did not show significant differences.
The effect of building type on radon concentrations
According to the obtained data, the results of measuring the concentration of radon in two main types of dwelling, i.e. villas (one-story
buildings) and apartments (multi-story buildings) are shown in table 2. The
663
Int. J. Radiat. Res., Vol. 17 No. 4, October 2019concentration of radon in apartment buildings was in the range of 1.01 - 76.69 with an average of 23.94 Bq/m3 (CI 95%: 13.75 – 34.13) while in
villa buildings, was in the range of 1.39 - 206.53 with an average of 92.12 Bq/m3 (CI 95%: 50.75 - 133.49).
Table 1. Annual effective dose assessment in dwellings of Aleshtar.
Figure 2. Results of radon concentration in 24 dwellings of Aleshtar.
Sampling No.
Indoor radon concentration (Bq/m3)
Annual effective dose (mSv/y)
1 37.33 0.942
2 22.65 0.571
3 15.31 0.386
4 1.01 0.025
5 117.94 2.977
6 16.2 0.408
7 191.34 4.83
8 5.06 0.127
9 41.63 1.05
10 21.7 0.547
11 28.09 0.709
12 86.94 2.194
13 60.11 1.517
14 113.51 2.865
15 1.39 0.035
16 10.88 0.274
17 26.07 0.658
18 76.69 1.936
19 12.4 0.313
20 206.53 5.214
21 30.62 0.773
22 34.42 0.868
23 148.7 3.754
24 18.1 0.456
Average ±
SD* 55.19 ± 59.32 1.39 ±1.49
Radon concentration (Bq/m3)
Building Type N A.M* G.M* SD* Min Max Apartment 13 23.94 16.87 18.75 1.01 76.69
Villa 11 92.12 52.80 70.01 1.39 206.53
Table 2. The concentration of radon in apartment buildings and villas.
*A.M= Arithmetic mean, G.M= Geometrical mean, SD= Standard deviation.
Table 4. The concentration of radon in dwellings by the type of the ventilation system in the kitchen.
* The floors are completely isolated from each other, but since the number of basement floors and second floors measured by radon concentration was 1 and 3 (less than 5), respectively, and there was no possibility to compare them individually, the basement with the ground floor and the second floor with the first floor merged together.
* SD= Standard deviation
Radon concentration (Bq/m3)
Ventilation Type N A.M G.M SD Min Max
Hood or fan* 16 70.92 40.82 65.89 1.39 206.53
No ventilation 8 23.72 13.83 23.67 1.01 76.69
*Since the number of buildings with fans were 2 (less than 5), making separate comparison impossible, fans merged with hoods.
Table 3. The concentration of radon in floors of dwellings.
Radon concentration (Bq/m3)
Floor Type N A.M G.M SD Min Max
Basement or
ground floor* 15 76.04 35.95 67.15 1.01 206.53
1st or 2nd floor* 9 20.43 19.28 7.07 10.88 30.62
250 200 150 100 50 0
1 2 3 4 5 6 7 8 9 10 11 12 13 14 15 16 17 18 19 20 21 22 23 24
664
The effect of floor types on radon concentrations
The results of measurement of radon concentration in different floors are shown in table 3. The mean concentration of radon in basement and ground floors was 76.04 Bq/m3 (CI 95%: 42.06 – 110.02) while in first and second floors, was 20.43 Bq/m3 (CI 95%: 15.81 – 25.05).
The effect of kitchen ventilation systems on radon concentrations
The results of measuring radon concentration in buildings of Aleshtar according to the type of the kitchen ventilation system are presented in
table 4. Based on this table, the mean concentration of radon was 70.92 Bq/m3 (CI
95%: 38.63 – 103.21) in dwellings with the ventilation system in the kitchen and was 23.72 Bq/m3 (CI 95%: 7.32 – 40.12) in dwellings without the ventilation system in the kitchen. The high radon detected in dwellings with the ventilation system is due to the distance of monitored rooms from the ground and not due to the HVAC system (table 5).
Radon distribution in Aleshtar
Figure 3 illustrates the distribution map of indoor radon concentrations.
Table 5. The concentration of radon in dwellings by the type of the floor and ventilation system in the kitchen. P-value A.M
N Ventilation Type
Floor Type Radon
Concentration
(Bq/m3)
0.170 88.16
12 With ventilation
Basement or
ground floor Without ventilation 3 27.59
0.675 19.22
4 With ventilation
1st or 2nd floor
21.41 5
Without ventilation
Figure 3. The distribution map of indoor radon in Aleshtar.
DISCUSSION
The average radon concentration in Aleshtar was 55.19 Bq/m3, which was higher than the global average (39 Bq/m3) (11) and the average amount of radon in the city of Mashhad (31.9
Bq/m3) but lower than the average in the cities of Hamadan (108 Bq/m3) and Yazd (137.36Bq/ m3) (6, 18, 21). In this research, the concentration of radon in 20.8% of the dwellings (five cases) was more than the reference levels recommended by the WHO (100 Bq/m3) and in 12.5% of the
665
Int. J. Radiat. Res., Vol. 17 No. 4, October 2019dwellings (three cases), was more than the US.EPA standard (148 Bq /m3).
The results showed that the annual effective dose for those living in Aleshtar dwellings, with a mean radon concentration of 55.19 Bq/m3, was equal to 1.39 mSv/y (CI 95%: 0.79 – 1.99), which is below the action level recommended by ICRP-69 (3mSv/y) (30).
The t-test method showed that there was a
significant difference between radon concentrations in apartment buildings and villa
buildings (p-value= 0.009). In other words, the average concentration of radon in villa buildings was found to be higher than that in apartment
buildings. The results of this study are consistent with those of several other investigations (25, 31). High radon concentration in villa buildings may be due to that villa buildings are in contact with the soil and thus radon in the soil can easily enter into indoor space. In contrast, most apartments use the basement or ground floor as parking spaces, which can act as a reservoir for radon.
Based on the t-test, there was a significant difference in radon concentrations between different floors of Aleshtar dwellings (p-value=0.006). Actually, the average radon
concentration in the lower floors was considerably high and the radon values decreased as the distance from the bedrock increased. With regard to high radon concentrations in basements, it can be concluded that radon in buildings is mainly
emitted from the soil and rocks in the ground. Higher density of radon than the air causes it to
accumulate at lower floors. Higher concentration of indoor radon in lower floors
has been reported by many researchers (23, 24, 32, 33).
As shown in Table 4, based on the Mann-Whitney test, there was a significant difference between radon concentrations in
buildings with and without the ventilation system (p-value= 0.043). In fact, the average
concentration of radon in dwellings with the ventilation system was higher than those without the ventilation system. The main reason is that most of the samples with the ventilation
system were in the basement or ground floors
while most of the samples without the ventilation system were in higher floors (the
first or second floors); consequently, radon concentration was lower in these samples (Table 5). Many studies have investigated the effect of ventilation on the concentration of radon and confirmed the association between ventilation and decreased radon level (27, 34).
As shown in figure 3, the concentration of this risk factor was more in the central and western parts of the city than the other areas. There are some predisposing elements that increase the probability to have higher radon concentration:
The geological structure is an essential element which causes an increase in radon risk, but is not sufficient because radon concentration depends on:
How the house is built
How the floor nearest to the ground is ventilated
Building materials
CONCLUSION
The present study was designed to survey the radon concentrations in 24 dwellings of Aleshtar, Iran. The results of this study indicated that healthcare authorities should consider indoor radon gas as an important environmental risk factor in Aleshtar because about 20% of the
residents in the city are exposed to radon concentrations, which is far higher than the
WHO guideline value and may be considered a serious threat to people’s health in this city.
Therefore, it is needed to reduce human exposure to this risk factor in sensitive areas
through various methods.
ACKNOWLEDGMENTS
We gratefully acknowledge the Lorestan University of Medical Sciences for financially supporting our research [Grant Number: 2157].
666
Conflicts of interest: Declared none.
REFERENCES
1. Ghorbanipour M, Hosseini Alhashemi A, Gharloghi S, Adeli M, Gholami M (2017) Health Risk Assessment of Natural Background Radiation in Residents of Khorramabad, Iran.
Iranian Journal of Medical Physics, 14(1): 23-8.
2. Shahbazi-Gahrouei D, Setayandeh S, Gholami M (2013) A review on comparison of natural radiation in Iran with other countries. International Journal of Low Radiation, 9 (1): 1-11.
3. Mehdipour LA, DoostMohammadi F, Saion E, Qasemi N, Hadavi M (2014) Influence of ventilation conditions on the radon annual effective dose of the lungsimulatedfor radon prone areas of Ramsar. IOSR Journal of Applied Physics, 6 (3): 65-70.
4. Peckham EC, Scheurer ME, Danysh HE, Lubega J, Langlois PH, Lupo PJ (2015) Residential Radon Exposure and Inci-dence of Childhood Lymphoma in Texas, 1995–2011. Int J
of environmental research and public health, 12(10):
12110-26.
5. Yeboah SM (2014) Indoor radon in selected homes in Aburi municipality: Measurement uncertainty, decision analysis and remediation strategy: University of Ghana. 6. Mowlavi AA, Fornasier MR, Binesh A, De Denaro M (2012)
Indoor radon measurement and effective dose assessment of 150 apartments in Mashhad, Iran. Environmental
moni-toring and assessment, 184(2): 1085-8.
7. Pirsaheb M, Najafi F, Khosravi T, Hemati L (2013) A sys-tematic review of radon investigations related to public exposure in Iran. Iranian Red Crescent Medical Journal, 15
(11): e10204.
8. Appleton JD (2013) Radon in air and water. Essentials of medical geology: Springer, pp: 239-77.
9. Singh P, Singh P, Singh S, Sahoo B, Sapra B, Bajwa B (2015) A study of indoor radon, thoron and their progeny meas-urement in Tosham region Haryana, India. Journal of
Radi-ation Research and Applied Sciences, 8(2): 226-33.
10. Madureira J, Paciência I, Rufo J, Moreira A, de Oliveira Fernandes E, Pereira A (2016) Radon in indoor air of pri-mary schools: determinant factors, their variability and effective dose. Environmental Geochemistry and Health,
38(2): 523-33.
11. WHO (2009) WHO handbook on indoor radon: a public health perspective: World Health Organization.
12. Mehdipour LA, Saion EB, Sidek A, Halimah M, GoodarzNaseri M, AbdolHalimShaari MN (2013) Influence of chimney effect on the radon effective dose of the lung simulated for radon prone areas of Ramsar in winter sea-son. IOSR-JAP, 4(4): 33-7.
13. World Bank (2016) The Cost of Air Pollution: Strengthen-ing the Economic Case for Action. WashStrengthen-ington, DC 204332016.
14. Charles M (2010) Effects of Ionizing Radiation: United Nations Scientific Committee on the Effects of Atomic Radiation: UNSCEAR 2006 Report, Volume 1—Report to the general assembly, with scientific annexes A and B.
Radiation Protection Dosimetry, 138(2): 187-9.
15. Miles J and Appleton J (2005) Mapping variation in radon potential both between and within geological units.
Jour-nal of Radiological Protection, 25(3): 257-63.
16. Dubois G (2005) An overview of radon surveys in Europe 2005. EC, Office for Official Publications of the European
Communities. 2005:168 Report.
17. Rahimi SA and Nikpour B (2013) Measurement of radon concentration of air samples and estimating radiation dose from radon in Sari province. Universal Journal of
Public Health, 1(2): 26-31.
18. Bouzarjomehri F and Ehrampoush M (2008) Radon level in dwellings basement of Yazd-Iran. Iran J Radiat Res, 6(3): 141-4.
19. Hadad K, Doulatdar R, Mehdizadeh S (2007) Indoor radon monitoring in Northern Iran using passive and active measurements. Journal of Environmental Radioactivity, 95 (1): 39-52.
20. Amirzadi M, Hosseini PMS, Taheri M, Babakhani A (2012) Complementary measurements of radon concentration in water sources and natural exposure in dwellings in the vicinity of the Ramsar HLNRA, Iran. Nuclear Technology
and Radiation Protection, 27(4): 399-403.
21. Gillmore G and Jabarivasal N (2010) A reconnaissance study of radon concentrations in Hamadan city, Iran.
Natu-ral Hazards and Earth System Sciences, 10(4): 857-63.
22. Pirsaheb M, Najafi F, Haghparast A, Azizi E, Hemati L (2014) Effective dose and concentration of radon and thoron gases at hospitals of Kermanshah University of Medical Sciences. Journal of Kermanshah University of
Medical Sciences, 18(6): 362-70.
23. Hadad K, Hakimdavoud M, Hashemi-Tilehnoee M (2011) Indoor radon survey in Shiraz-Iran using developed passive measurement method. Int J Radiat Res, 9(3): 175-82. 24. Hadad K and Mokhtari J (2015) Indoor radon variations in
central Iran and its geostatistical map. Atmospheric
Envi-ronment, 102: 220-7.
25. Hassanvand H, Hassanvand MS, Birjandi M (2018) Indoor Radon Measurement in Dwellings of Khorramabad City, Iran. Iranian Journal of Medical Physics, 15(1): 19-27. 26. Montazerabadi A, Ahmadian M, Vahed M, Yousefi N,
Fatehizadeh A, Borhani P, et al. (2012) Evaluation Of 222 Rn Rate In Medical Dormitory Of Kerman City. Int J Radiat Res, 10(3-4): 171-5.
27. Fahiminia M, Fouladi Fard R, Ardani R, Naddafi K, Hassan-vand M, Mohammadbeigi A (2016) Indoor radon measure-ments in residential dwellings in Qom, Iran. Int J of Radiat Res, 14(4): 331.
28. Radon I (1992) Radon Decay Product Measurement Device Protocols. Document EPA, 402.
29. Radiation UNSCotEoA (2000) Sources and effects of ioniz-ing radiation. UNSCEAR 2000 report to the General Assem-bly, with scientific annexes. Volume I: Sources. 2000. 30. ICRP (1995) ICRP Publication 69: Age-dependent Doses to
Members of the Public from Intake of Radionuclides: Part 3 Ingestion Dose Coefficients: Elsevier Health Sciences; 1995.
31. Kim Y, Chang BU, Park HM, Kim CK, Tokonami S (2011) National radon survey in Korea. Radiation protection do-simetry, 146(1-3): 6-10.
32. Kurnaz A, Küçükömeroğlu B, Çevik U, Çelebi N (2011) Ra-don level and indoor gamma doses in dwellings of Trab-zon, Turkey. Applied Radiation and Isotopes, 69(10): 1554-9.
33. Brogna A, La Delfa S, La Monaca V, Nigro SL, Morelli D, Tringali G (2007) Measurements of indoor radon concen-tration on the south-eastern flank of Mount Etna volcano (Southern Italy). Journal of Volcanology and Geothermal
Research, 165(1): 71-5.
34. Mehra R, Badhan K, Kansal S, Sonkawade R (2011) Assess-ment of seasonal indoor radon concentration in dwellings of Western Haryana. Radiation Measurements, 46(12):
1803-6.