Examining practice-level factors influencing rate of clinical quality improvement
with practice facilitation
By
Rachel Hines
A Master’s Paper submitted to the faculty of
the University of North Carolina at Chapel Hill
in partial fulfillment of the requirements for
the degree of Master of Public Health in
the Public Health Leadership Program
Chapel Hill
2012
Advisor
Table of Contents
Abstract……….3
Systematic Review………4
References………..11
Figures & Tables………12
Manuscript………...15
References………...27
Figures & Tables……….29
Appendices………..42
Abstract
Studies of medical care in the United States consistently show inconsistent quality and access
among Americans. In an effort to improve healthcare while decreasing disparities, there has been a push
to implement evidence-based practices more consistently in primary care settings. The use of practice
facilitators, individuals whose role is to help get guidelines into practice, has become more common in
quality improvement interventions. Here, we reviewed the literature on the effectiveness of practice
facilitation in controlled trials and also analyzed some of the results of a program – the North Carolina
Improving Performance in Practice (IPIP) program – that relies on practice facilitation. Studies, including
a recent meta-analysis, support the use of facilitation in diverse clinical settings and for a variety of
evidence-based practice. In North Carolina, more patients received guideline-based care and had better
outcomes while practices were enrolled in IPIP; this did not appear to generally depend on practice
demographics. Rather, the rate of improvement across measures depended on the length of a practice’s
enrollment in the program. This rate of change method provides important information about the natural
history of improvement in practices but also has many limitations. Future studies should develop better,
standardized ways to measure the impact of quality improvement programs like IPIP using data that was
The impact of practice facilitation on evidence-based guideline implementation: a systematic review
Abstract
Background
Practice facilitation is a broadly applicable strategy for encouraging clinical guideline implementation.
We have limited understanding of its impact as it is most often implemented in non-controlled quality
improvement projects.
Methods
One author conducted a systematic review of the literature on practice facilitation using MEDLINE and
Thomson Scientific Web of Science database, using search methods and definitions similar to a recent
review and meta-analysis. The author rated the articles according to an adapted quality rating scale.
Results
Five (5) articles met inclusion criteria, including a large review and meta-analysis published in early 2012
that reviewed articles published through 2010. The other 4 studies extend the results of the meta-analysis
through June 2012. Quality ratings ranged from 13 to 16 out of a possible 18, with one incomplete rating.
Conclusions
Current literature supports the use of practice facilitation in a variety of clinical and geographic settings.
Facilitation has a moderate impact on improving the use of evidence-based guidelines based on a
Introduction
Practice facilitation is a broadly applicable component of quality improvement interventions in
medicine and public health. The facilitators might help with any number of interventions; the common
link is that their aim is to improve evidence-based practice. Facilitation is therefore flexible and widely
relevant but studies employing are thus equally varied. To quantify the effect of facilitation, it is
therefore necessary to standardize outcomes so studies can be compared, regardless of what practices
were being addressed by facilitators. The following systematic review attempts to expand on the results
of a recent meta-analysis to understand the potential impact of facilitation.
Methods
Search strategy
A preliminary search on PubMed using the term “practice facilitation” returned 12 articles, one of
which was a systematic review and meta-analysis published in the Annals of Family Medicine in early
2012.1 That review, by Baskerville et al, included all prospective studies and reviews published through
the end of 2010.1 Our review uses the same search strategy and inclusion criteria in an effort to update the
most recent conclusions. Baskerville’s review is included with the other relevant papers but is evaluated
in more detail because its results carry greater weight.
One author (RH) searched MEDLINE and Thomson Scientific Web of Science database, which
contains the Science Citation Index, the Social Sciences Citation Index, and the Arts and Humanities
Citation Index.1
The search was limited to publications since January 1, 2011 and in English. The following key
A second search was conducted following the exclusions and analysis from the first to possibly
include studies without a control group, to reflect the reality of most “in vivo” QI initiatives. The search
expanded the number of returned titles but did not add any relevant titles.
Article selection
The literature review inclusion criteria mirrors those established by Publication Date after
12/31/10 to reflect end of last meta-analysis/systematic review period. It included only “controlled trials
or evaluations of facilitation within health care, where an explicit facilitator role was adopted to promote
changes in clinical practice”1 The authors defined a practice facilitator as “an individual carrying out a
specific role, either internal or external to the practice, aimed at helping to get evidence-based guidelines
into practice” 1
Data extraction
One author (RH) extracted standardized information including study design, nature of facilitation
intervention, setting, number of practices, and outcomes in a spreadsheet to allow for comparison.
Quality assessment
A quality assessment was performed by one author (RH), who defined a scoring system based on
study design and potential for bias. Quality was scored based on ratings of 1-3 on several standard
critical appraisal criteria (Table 2). One author (RH) rated the randomization and blinding, selection bias,
measurement bias, confounding, and external validity as poor, fair, or good, corresponding to scores of 1,
2, or 3, respectively. The study design was also scored as 1, 2, or 3 if it was pre- and post-intervention
data, a controlled cohort, or a randomized controlled trial, respectively. The highest possible score is
Results
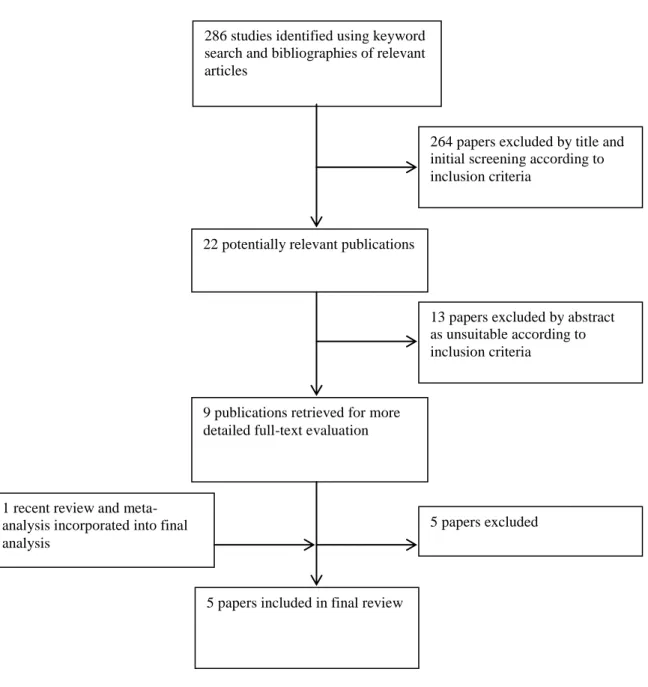
Search results
The search returned 286 titles from the two databases. The PubMed titles were reviewed first,
and 20 abstracts were pulled for review. The Web of Science Search yielded two additional abstracts for
review. Of these, 9 full text articles were reviewed in depth and their bibliographies were hand-searched
for other interventions. Five total articles meeting the inclusion criteria were included (Figure 1).
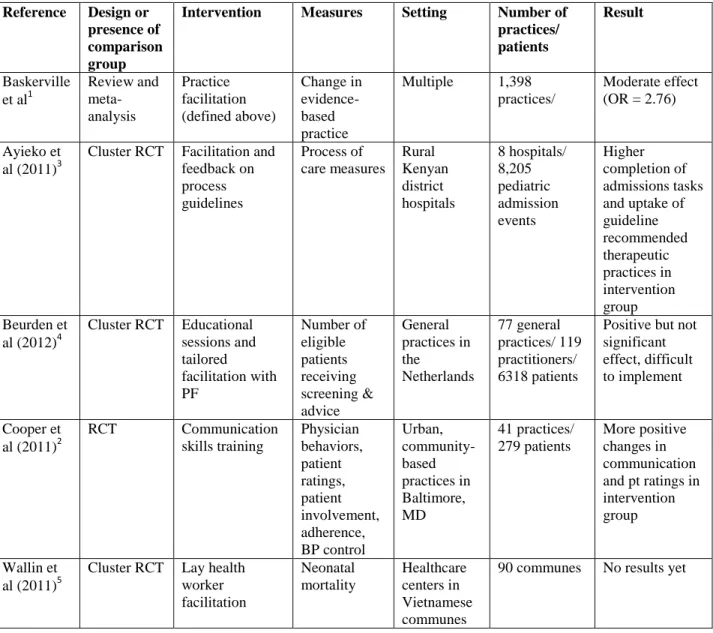
Study design
The five studies included 1 meta-analysis,1 1 RCT,2 and 3 cluster RCTs.3-5 The meta-analysis included 23 studies, of which 3 were controlled clinical trials, 3 were cluster RCTs, and 17 were RCTs.
All examined the impact of facilitation on implementation of guidelines, though these ranged in their
nature. The interventions took place in the US and internationally, including a mix of developed and
developing countries. The meta-analysis pooled results from interventions involving 1,398 practices.1 The more recent individual studies had between 8 and 90 units of practice, the smaller being hospitals
with higher patient volumes.
Study quality
The quality of studies returned varied, with scores ranging from 13 to 16 out of a possible 18, not
including the study without completed results. The Baskerville review was quite robust because of its
comprehensiveness and pooled sample size. The studies were successfully randomized based on
comparison of baseline characteristics. Masking was uniformly difficult but probably did not influence
clinical outcomes. Measurement bias was low in general as most studies used validated evaluation tools
The meta-analysis used standard mean difference (SMD) to compare the studies. The authors
report an overall SMD of 0.56 (95% CI, 0.43-0.68), which is converted to an odds ratio of 2.76 (95% CI,
2.18-3.43).1
The more recent studies’ results generally agree with the meta-analysis. However, Wallin et al
did not have results to date. The study by Beurden in the Netherlands showed positive but non-significant
results.4 The study by Ayieko in Kenyan hospitals showed improvement with facilitation.3 The authors report an adjusted difference of 0.54 after 18 months (95% CI, 0.05-0.29) for completion of admission
assessment tasks. They also found higher uptake of guideline-based therapeutic practices, which varied
from 17.1% [8.04%-26.1%] to 29.9% [10.9-48.9%] improvement depending on the recommended
practice. Additionally, they observed decreases in the proportion of children receiving inappropriate
care.3
Cooper et al report on a different type of measured outcome, physician proficiency with
evidence-based communication skills.2 The authors used a 2x2 design that combined interventions for both physicians and patients. The physician-only intervention, which reflects our working definition of
practice facilitation, did not show significantly better results than controls.
Discussion
Current evidence demonstrates that practice facilitation does help the implementation of
evidence-based guidelines. The magnitude of the intervention is less clear, but current evidence suggests
at a least moderate impact for a wide variety of guidelines. The variety of outcomes within the systematic
review and since is likely due to the heterogeneity of studies. Included studies came from a myriad of
settings in which facilitation was used to implement a wide assortment of guidelines. Likely, facilitation
works better for certain types of guidelines (e.g. prescriptions versus counseling) and in certain settings
(e.g. hospital versus clinic or developed versus developing countries).
Facilitation is a unique intervention in that it underpins diverse other evidence-based
interventions for a multitude of clinical problems. The flexibility of facilitation is also a challenge for
evaluating it. Ultimately, it is an intervention that depends on the skill of the persons delivering it and to
an extent, those subject to it. In reality, facilitation is usually not administered in a controlled setting;
rather, it is part of a quality improvement initiative that is targeted to all providers or practices in a given
population, like a single hospital, region, or state. The current evidence is likely an incomplete picture of
the results from facilitation interventions but is important in justifying further trials and in new areas.
The results of this review suggest that guideline implementation is not a simple process, nor are
simple reminders enough. Systems-based approaches are critical and likely require someone or some
entity besides the physician to maintain an eye for system-level changes. Physicians can and should
develop an eye for patterns that can inform change and work to routinize their use of evidence-based
practices. QI specialists should recognize their potential for facilitating change and as a field, try to create
ways to extend facilitation services and decrease their cost while keeping them flexible. At the policy
level, it will be important to give financial support to practices that are undergoing improvement
interventions and for facilitation in particular since it requires meetings and time in addition to clinical
duties.
Directions for future research
Future research can address the variability and shortcomings of current evidence on practice
facilitation through several means. First, the published literature should expand to include controlled and
non-controlled studies of facilitation to represent its actual uses in practice as well as create more
this issue is ongoing improvement in clinical technology and its ever-expanding reach. Human
facilitators could be replaced by technological innovations or facilitators could work remotely to expand
their own reach. In either case, the effectiveness of technological substitutes should be tested and
REFERENCES
1. Baskerville NB, Liddy C, Hogg W. Systematic review and meta-analysis of practice facilitation within
primary care settings. Ann Fam Med. 2012;10(1):63-74. doi: 10.1370/afm.1312.
2. Cooper LA, Roter DL, Carson KA, et al. A randomized trial to improve patient-centered care and
hypertension control in underserved primary care patients. J Gen Intern Med. 2011;26(11):1297-1304.
doi: 10.1007/s11606-011-1794-6.
3. Ayieko P, Ntoburi S, Wagai J, et al. A multifaceted intervention to implement guidelines and improve
admission paediatric care in kenyan district hospitals: A cluster randomised trial. PLoS Med.
2011;8(4):e1001018. doi: 10.1371/journal.pmed.1001018; 10.1371/journal.pmed.1001018.
4. Beurden IV, Anderson P, Akkermans RP, Grol RP, Wensing M, Laurant MG. Involvement of general
practitioners in managing alcohol problems: A randomised controlled trial of a tailored improvement
programme. Addiction. 2012. doi: 0443.2012.03868.x;
10.1111/j.1360-0443.2012.03868.x.
5. Wallin L, Malqvist M, Nga NT, et al. Implementing knowledge into practice for improved neonatal
survival; a cluster-randomised, community-based trial in quang ninh province, vietnam. BMC Health Serv
FIGURE 1: Flowchart of identification of relevant studies
286 studies identified using keyword search and bibliographies of relevant articles
9 publications retrieved for more detailed full-text evaluation
264 papers excluded by title and initial screening according to inclusion criteria
22 potentially relevant publications
13 papers excluded by abstract as unsuitable according to inclusion criteria
5 papers excluded
5 papers included in final review 1 recent review and
TABLE 1: Characteristics of included studies Reference Design or
presence of comparison group
Intervention Measures Setting Number of practices/ patients
Result
Baskerville et al1
Review and meta-analysis Practice facilitation (defined above) Change in evidence-based practice
Multiple 1,398 practices/
Moderate effect (OR = 2.76)
Ayieko et al (2011)3
Cluster RCT Facilitation and feedback on process guidelines Process of care measures Rural Kenyan district hospitals 8 hospitals/ 8,205 pediatric admission events Higher completion of admissions tasks and uptake of guideline recommended therapeutic practices in intervention group Beurden et
al (2012)4
Cluster RCT Educational sessions and tailored facilitation with PF Number of eligible patients receiving screening & advice General practices in the Netherlands 77 general practices/ 119 practitioners/ 6318 patients
Positive but not significant effect, difficult to implement
Cooper et al (2011)2
RCT Communication skills training Physician behaviors, patient ratings, patient involvement, adherence, BP control Urban, community-based practices in Baltimore, MD 41 practices/ 279 patients More positive changes in communication and pt ratings in intervention group
Wallin et al (2011)5
Cluster RCT Lay health worker facilitation Neonatal mortality Healthcare centers in Vietnamese communes
TABLE 2: Quality assessment of included studies Reference Study
design Randomization and masking Selection bias Measurement bias
Confounding External validity Overall quality based on score average Baskerville1
Meta-analysis 3 Mixed among included studies 2 Mixed ITT analysis 2 Standardized 3 Little publication bias 3 High hetero-geneity
3 16
Ayieko3 Cluster RCT
3
Restricted to balanced groups
blind draw Not masked 2 Hospitals are similar based on table 1 3 Unblinded but independently rated sub-samples Discrepancies in records 2 Largely undescribed measures of engagement 2 Clusters not selected randomly
1 13
Beurden4 Cluster RCT
3
No info about method of randomizing 2 Non-respondent survey 5 withdrew before measure from control Intent to treat 3
Med record data available in about half the practices Intervention not equal, depended on individual participation 2 More urban practices in control, more male intervention No data about extent of participation in components of intervention 2 More group practices & health centers didn’t respond
2 14
Cooper2 RCT
3 “equal probability” randomization, no masking 2 Table 1: more at-risk participants in minimal intervention group 2 Standardized measures of communication, validated patient survey methods, still subject to evaluator bias 2 Confounded by pt interventions in one group, non-significant results with only physician intervention 2 Commu-nication is depen-dent on particular commu-nity culture
2 13
Wallin5 Cluster RCT 3 Probability proportional to size sampling 3
n/a n/a Careful
monitoring
2
Abstract
Background
The United States healthcare system has been slow to improve in quality, access, and reduction of
disparities. The North Carolina Improving Performance in Practice (IPIP) program is an extensive
state-wide quality improvement (QI) initiative that delivers change packages to providers through the use of
regional facilitators. Series of systems changes are necessary to improve the rate at which evidence-based
services are provided to patients but little is known about practice-level factors that mitigate the
successful implementation of guidelines.
Methods
Using provider-reported percentages from the IPIP database, we calculated monthly rates of change for
diabetes and asthma quality measures. We then used descriptive statistics and bivariate analyses to
examine associations between practice characteristics and rates of improvement in process and outcomes
measures.
Results
Practices enrolled in IPIP generally improved across measures at comparable magnitudes. Some practices
did not improve or did worse over time. Statistically significant associations were noted in some cases
between number of months enrolled in the program, provider credentials, and Area Health Education
Center (AHEC) area with rates of change. Most examined characteristics were not associated with rates
of change in quality measures.
Introduction
Patients in the United States (US) inconsistently receive basic recommended healthcare services.1
In 2003, McGlynn et al identified major deficits throughout the country in percent of recommended
preventive, acute, and chronic disease care provided.1 In 2009 and 2010, the Institute of Medicine (IOM)
published reports on healthcare quality that pointed to “suboptimal” healthcare quality and access.2,3 The
2010 report highlighted improving quality without corresponding improvements in access and
disparities.2
Large-scale improvement in the quality of healthcare is difficult, especially given the complexity
and diversity of the current system.1 A series of system changes with performance evaluation is the key
to stirring now-stagnant progress. Patient registries, standing orders, and a curriculum based on the
Chronic Care Model4 should be implemented step-wise to increase the availability of clinical data and
data-driven decision making. Implementation of change packages by providers with help from skilled
quality improvement (QI) professionals may increase the delivery of evidence-based processes in
practices on a large scale.
The variation among primary care practices, in terms of factors such as size, location, and
availability of an electronic medical record, calls for a flexible method of guideline implementation and
evaluation.5 One possible strategy to enhance implementation is practice facilitation. A practice
facilitator is defined as “an individual carrying out a specific role, either internal or external to the
practice, aimed at helping to get evidence-based guidelines into practice.” 6 Facilitation should be
tailored to the needs of the practice, which may vary depending on size, specialty, location, payer mix,
and other demographics.
There is a relative paucity of published findings from QI initiatives because their primary goals
are local changes in performance rather than generation of new knowledge.7 QI work nevertheless would
benefit from results sharing and the peer-review process as other clinical research does. This paper
various practice characteristics and rate of change in quality measures for asthma and diabetes. These
findings represent the outcomes and challenges of a real-world QI program on an unmatched scale.
Methods:
North Carolina IPIP
The American Board of Medical Specialties launched the Improving Performance in Practice (IPIP)
program in 2005 to address several challenges in healthcare reform: accomplishing large-scale change,
improve quality across the continuum of care; developing a primary care foundation for health care; and
using regional and community-based infrastructure for care.8 North Carolina was chosen as a pilot state
focusing on improving the quality of diabetes and asthma care across the entire state.8
IPIP combines strategies from the Chronic Care Model (CCM) framework, including the use of
registries, self-management, and other patient-centered office systems.8 Facilitators known as Quality
Improvement Coordinators (QICs) meet regularly with physicians and office staff to help implement the
various components of the model. IPIP practice facilitators are assigned to practices according to the
pre-existing network of Area Health Education Centers (AHEC) in which they are based. Like many other
QI programs,9, 10-14 IPIP combines facilitation with other interventions. Quality Improvement
Coordinators’ efforts happened alongside and in support of rapid cycle data collection, learning networks,
and alignment with state and national incentive programs.8
North Carolina was one of two pilot states8 that began with and has maintained a focus on
Intervention(s)
There are five major components to IPIP. First is a common set of quality measures for diabetes and
asthma care. The measures include intermediate outcomes, like lab values, as well as documentation of
preventive care and counseling. Second is regular database mining and reporting on these measures.
Generally, internal medicine and family medicine practices report on diabetes while pediatrics practices
report on asthma. The North Carolina program maintains a database that encourages practices to report
measures monthly while allowing them to view the progress of other participating practices as well.
Third, local networks hold periodic collaborative meetings for participating practices.
Fourth, measures are aligned with other national and state-wide incentive programs offered by
National Committee for Quality Assurance, Centers for Medicare and Medicaid Services, and Blue Cross
Blue Shield, among others. Participating providers additionally receive continuing medical education
(CME) credit. The thrust of the program, however, is in the use of QICs, who have experience in QI and
act as consultants to practices. QICs help practices with the necessary data gathering and reporting but
can also provide targeted help for other QI efforts, like Patient Centered Medical Home (PCMH)
recognition.
Data Sources
Outcomes
We used two different databases maintained by the IPIP program to conduct this analysis. The
first is the product of practices reporting to the online data system. Each month, practices run reports
using an electronic health record or random chart review to determine the percent of patients with a given
condition who have met evidence-based quality measures. Providers or other staff serving as QI leaders
reports the results to a practice-specific portal; these entries constitute the quality measures database.
The quality measures actually reported were used to classify practices as either working to
the patient population is predominantly adult or pediatric, respectively. Exceptions include practices that
see all ages, which could select either condition, practices that elect to report on both, and a minority that
focus exclusively on hypertension. In the latter case, these practices are grouped with the diabetes
practices since blood pressure measures are included as one of the quality outcomes for diabetes. These
practices were included in the analysis through the use of “percent of patients with systolic blood pressure
less than 130 mm Hg” as an outcome measure (see below).
Characteristics
The practice demographics are tracked in a separate database that is maintained by the Regional
Extension Centers (REC). The databases are not combined but a list of identifiers is maintained by one of
the data managers at UNC. For example, if a practice were listed as “Rocky Point Family Medicine” in
the quality measures database but “Rock Point Medical Center” in the REC database, the difference
would be reconciled in this list. The list is not comprehensive, however, and some practices were
excluded from the final analysis because demographic information could not be found that matched the
identifier in the outcomes database (figure 1). The demographics database includes many characteristics,
some of which were hypothesized to affect facilitation.
Specialty
Any interested primary care practice (family/general medicine, internal medicine, and pediatrics)
in North Carolina was invited to participate in IPIP. For the purposes of the program, exclusive obstetrics
and gynecology practices were not considered primary care but community health centers and other
public health departments were included and sometimes employ obstetricians or midlevel obstetrical
program’s definitions, rural health clinics are those in a rural, underserved area and that meet some
additional requirements. Community health centers provide primary and preventive care, regardless of
patients’ ability to pay. We used this variable to represent patients’ access and ability to pay and
predicted that non-private practices would have slower improvement since patients were less likely to
seek regular care.
Practice Size
Practice size was based on the recorded provider count in the demographics database. All
physicians and midlevel medical providers were counted but dentists were excluded from the count. The
practices were then grouped according to how their size compared to the median size. We hypothesized
that smaller practices would improve faster due to more centralized leadership and facilitation.
Credentials
Providers at the practices included the following credentials: Doctor of Medicine (MD), Doctor of
Osteopathy (DO), Nurse Practitioner (NP), and Physician Assistant (PA). The practices were categorized
according to the composition of these credentials – either all physician-level, all mid-level, or mixed. We
hypothesized that all-physician or mixed practices would improve faster because with longer training,
they would have had more opportunity to be exposed to quality improvement projects.
Electronic Health Record (EHR) Status
Practices were classified according to whether or not they were “live” on an EHR at the time of
enrollment in the program. Practices could fall into intermediate states, such as “implementation” or
“vendor selection,” but for our purposes, it was more relevant whether a practice could use the EHR to
generate reports on quality measures. We hypothesized that the practices that were live on EHR would
improve more quickly because of the relative ease of reporting and data mining compared to
hand-sampling charts.
AHEC Area
practices in AHEC regions that were included in the first wave of NC IPIP (Mountain AHEC and Eastern
AHEC) would improve faster because of greater experience.
Baseline QIC Assessments
Upon enrollment in IPIP, QICs assigned baseline scores to practices for several domains: efforts
to promote patient self-management, use of registries, planned care, leadership, and team interactions.
The rating form that QICs used to assess practices defines these characteristics (Appendix A). We
predicted that practices that scored higher on these measures at baseline would have greater rates of
improvement.
Analytical methods
Rate of Change Calculation
We used rate of improvement as the primary outcome for each selected disease management
measure. We determined the number of months the practice had reported data to the IPIP website, with
the first entry representing their baseline or time 0. The most recent entry was considered the end of the
time interval and the net number of months was calculated using the elapsed time. This number of
months underestimates the total number of months enrolled in IPIP, as most practices began reporting two
to three months after enrollment.8 To find the change in the measure of interest, we subtracted the first
entry from the final entry. To calculate the rate, we divided the change by the number of months
(Appendix B).
Statistical Analysis
The NCQA performance criterion for physician-controlled process measures, including foot
examination, is 80%. We used 80% as the cutoff above which practices were considered high performing
and excluded from the analysis of rate of change for process measures. The criteria for clinical outcomes
were more varied, ranging from 25% of patients for blood pressure control < 130/80 mm Hg to 60% for
HbA1c under 8.0%. We elected to use the higher threshold so as not to exclude too many practices from
our analysis. Therefore, the rate of change for most of the clinical outcomes quality measures were
re-analyzed excluding practices that, at baseline, had 60% or more of patients at the goal. The ED visits
measure was not re-analyzed because the goal was the opposite – to have as few ED visits as possible.
Given the relatively small percentage of practices reporting on this outcome and the high proportion of
those that already had few asthmatic ED visits, we did not exclude any practices from that analysis.
Results:
Practices reported on diabetes measures approximately twice as much as asthma measures and a
large number of participating practices had not submitted data indicating which disease they were
working on (Table 1). Seventy-two percent of practices are private, 14% are community health centers,
10% are other underserved, and 4% are rural health clinics. Two-thirds of practices have four or fewer
providers, with a range from 1 to over 20. Family medicine is the most common specialty (40%),
followed by mixed-specialty practices (25%), pediatrics (24%), and internal medicine (11%). Sixty-two
percent of practices were composed of physician (MD or DO) and midlevel providers, while 34% and 4%
were physician- or midlevel-only, respectively. Sixty-nine percent of practices were live on an EHR at
the time of enrollment in IPIP. The number of months practices reported outcomes data ranges from one
to 60, with a median of 17 months. Practices were distributed throughout the state’s AHECs, ranging
from four to 17 practices in the centers.
exams improved most quickly, with a median rate of 0.0045 percent per month and a mean of 0.7389
percent per month. The asthma measures were similar, showing improvement across measures by
median rates of change (Table 3). ED visits improved, showing a median decrease per month.
Few of the practice characteristics were significantly associated with rates of change of quality
measures. The provider credentials showed somewhat mixed associations; for aspirin use, practices with
both physician and midlevel providers showed faster improvement. However, for intermediate clinical
measures, the midlevel-only practices (n=4) improved significantly faster. Number of months of
reporting was associated with differences in rates of improvement; for the measures on which that
difference was significant, the highest rate of improvement was observed in practices that had been
reporting for 6 to 24 months. The association with QIC ratings was limited to the overall team
assessment and asthma prescribing but the relationship was inverse – higher ratings led to lower rates of
improvement.
There were also few associations between practice characteristics and asthma quality measures.
The number of months of reporting followed a similar pattern to the diabetes measures in that a peak rate
of improvement was achieved by practices in the middle ranges of months. Emergency department visits
showed fairly consistently negative rates of change (which constitutes improvement). There was little
change in the results when excluding high-performing practices from the analysis (Table 4, Table 5).
Discussion:
diabetes and asthma quality measures. Number of months of reporting and practitioner credentials were
associated changes in only some measures in some cases. The general lack of association between QIC
ratings and rate of change and in fact one inverse relationship may be a product of our measurement,
discussed below, or may truly reflect that higher-rated practices at baseline had less room for
improvement and therefore improved more slowly.
These rates suggest slow average improvement over time. Without a control group, it is difficult
to say whether these rates are better than the natural progress or regression practices would undergo over
time. We were surprised by the number of practices that actually declined from baseline and thus had a
negative rate of change, particularly for process measures that providers control. ED visits for asthma,
which is the most downstream and patient-centered measure, changed in a negative direction for a
majority of subgroups. This could reflect better rates in asthma practices for process and intermediate
outcome measures, or it could reflect a bigger system change.
Practice characteristics were, on the whole, not statistically associated with rates of improvement
for process and intermediate outcome measures. There are several possibly interpretations of this finding.
One is that practice facilitation is a flexible and broadly applicable intervention, the implementation of
which does not depend on the factors examined here. Another is that, while our sample size was large,
the subgroups may not have been large enough to detect associations with rates of change in the various
measures.
Our use of a rate calculation has little precedent in quality improvement studies. Controlled
studies do not have the need to control for time since practices typically receive an intervention during the
study period. In our case, with no control group, time was an important potential confounder and looking
at improvement over a fixed unit of time enabled easier comparisons. This method has several
limitations, however.
First, the pattern of monthly percentages is seldom linear. Practices exhibit various alternate
using only the last reported value is logical but the final number may misrepresent the actual trend or lack
thereof. High performing at baseline practices might drop a little, which would yield an overall negative
rate. A practice might have an overall upward slope but the last value might be a trough in a pattern of
ups and downs around an increasing line. The opposite is also possible, that the last value reported might
be a snapshot that exaggerates the overall improvement of a practice. We felt that this approach, while
flawed, was unlikely to confer differential confounding. The last reported value is equally likely to over-
or under-estimate a more representative value and therefore allows us to compare, in light of the
aforementioned limitations, the magnitude of change.
However, the magnitude of change may not tell the whole story. The data from practices
stratified by number of months of reporting suggests that the rate of improvement is not constant over
time and perhaps predictably declines after a longer period of participation. This pattern is an important
finding in understanding the natural history of practices’ improvement. At the individual practice level,
our analysis strategy doesn’t allow us to comment on patterns of performance without looking at each
practice separately.
Evaluating the impact of practice facilitation presents several challenges. First, facilitation is
itself an intervention is also a means to accomplish other elements of QI. It is therefore difficult to isolate
in the context of multi-pronged QI programs; attempts to do so have shown positive but mixed results
according to the recent meta-analysis.6 Second, primary care practices vary significantly and it is difficult
to know which characteristics predict a practice’s success with facilitation. Third, there are no
standardized methods for quantifying the outcomes of real-world QI initiatives.
direction results suggest the need for better ways to evaluate programs like IPIP and examine possible
confounders.
Quality improvement work has inherently different goals than clinical trials.7, 16 The former is
iterative while the latter is controlled. For the quality improvement literature to expand to appropriately
include community-based trials, unique but standardized methods of evaluation are necessary. In the
absence of a control group, we need to be able to: 1) define the magnitude of a program’s impact; 2)
describe the patterns of improvement and explain them; 3) collect specific demographic data about the
settings of projects and relate them to improvement.
Run charts can accomplish some of this at the practice level. An idea statistical approach would
create and pool run charts from organizations using data like the type that IPIP collects. It will be
important to account for the real-life obstacles to reporting and gathering data, including differing time
intervals and missed reporting as well as to control for demographic variables. By capitalizing on the
amount of data that could be collected if practitioners, rather than only academic partners, are responsible
REFERENCES
1. McGlynn EA, Asch SM, Adams J, et al. The quality of health care delivered to adults in the united
states. N Engl J Med. 2003;348(26):2635-2645. doi: 10.1056/NEJMsa022615.
2. Agency for Healthcare Research and Quality. National healthcare quality report 2010.
2011;11-0004(March).
3. Agency for Healthcare Research and Quality. National healthcare quality report 2009.
2010;10-0003(March):http://www.ahrq.gov/qual/nhqr10/nhqr10.pdf.
4. Laferriere D, Liddy C, Nash K, Hogg W. Navigating change: How outreach facilitators can help
clinicians improve patient outcomes. J Am Board Fam Med. 2012;25(2):232-237. doi:
10.3122/jabfm.2012.02.110192.
5. Baskerville NB, Liddy C, Hogg W. Systematic review and meta-analysis of practice facilitation within
primary care settings. Ann Fam Med. 2012;10(1):63-74. doi: 10.1370/afm.1312.
6. Davidoff F, Batalden P. Toward stronger evidence on quality improvement. draft publication
guidelines: The beginning of a consensus project. Qual Saf Health Care. 2005;14(5):319-325. doi:
10.1136/qshc.2005.014787.
quality-9. Cooper LA, Roter DL, Carson KA, et al. A randomized trial to improve patient-centered care and
hypertension control in underserved primary care patients. J Gen Intern Med. 2011;26(11):1297-1304.
doi: 10.1007/s11606-011-1794-6.
10. Frijling B, Hulscher ME, van Leest LA, et al. Multifaceted support to improve preventive
cardiovascular care: A nationwide, controlled trial in general practice. Br J Gen Pract.
2003;53(497):934-941.
11. Lobo CM, Frijling BD, Hulscher ME, et al. Improving quality of organizing cardiovascular preventive
care in general practice by outreach visitors: A randomized controlled trial. Prev Med.
2002;35(5):422-429.
12. Margolis P, DeWalt D, Simon J. Designing a large-scale multilevel improvement initiative: The
improving performance in practice program. Journal of Continuing Education for Health Professions.
2010;30(3):187.
13. Opondo C, Ayieko P, Ntoburi S, et al. Effect of a multi-faceted quality improvement intervention on
inappropriate antibiotic use in children with non-bloody diarrhoea admitted to district hospitals in kenya.
BMC Pediatr. 2011;11:109. doi: 10.1186/1471-2431-11-109.
14. National Committee for Quality Assurance. Diabetes care recognition program.
http://www.ncqa.org/Portals/0/Programs/Recognition/DRP_web.pdf. Accessed 06/10, 2012.
15. Newton WP. Improving performance in prevention. JABFM. 2008;21(4):258-259, 260.
FIGURE 1: Flowchart of included practices
210 participating practices
198 participating practices 12 practices reported only
baseline data
55 practices reporting but missing demographic information
FIGURE 3: Sample graphs of reported clinical measures
Practice with net negative change:
TABLE 1: Description of included North Carolina IPIP Practices
n N (%) Quality Focus
Diabetes Asthma Both
Undetermined from reporting patterns
210 41 29 2 28 Practice type Private practice
Community health center Rural health clinic Other underserved Academic practice 144 72 14 4 10 0 Size
> 4 providers (>50th %ile) ≤ 4 providers
210 34 66 Practice specialty Family medicine Pediatric medicine Internal medicine Multiple 143 40 24 11 25 Credentials MD/DO Only
Midlevel provider only Mixed
143 34 4 62 Live on EHR
Yes No
143 69 31 Number of months reporting
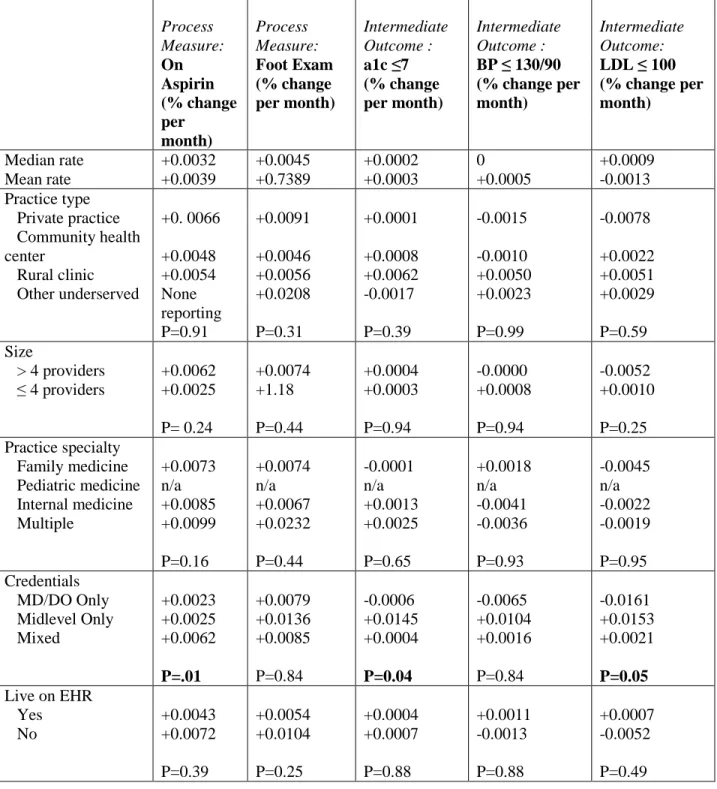
TABLE 2: Rate of Improvement in Diabetes Process and Intermediate Outcome Quality Measures According to Practice Characteristics
Diabetes Practices: (n=87)
Process Measure: On Aspirin (% change per month) Process Measure: Foot Exam (% change per month) Intermediate Outcome : a1c ≤7 (% change per month) Intermediate Outcome :
BP ≤ 130/90 (% change per month)
Intermediate Outcome:
LDL ≤ 100 (% change per month) Median rate Mean rate +0.0032 +0.0039 +0.0045 +0.7389 +0.0002 +0.0003 0 +0.0005 +0.0009 -0.0013 Practice type Private practice Community health center Rural clinic Other underserved +0. 0066 +0.0048 +0.0054 None reporting P=0.91 +0.0091 +0.0046 +0.0056 +0.0208 P=0.31 +0.0001 +0.0008 +0.0062 -0.0017 P=0.39 -0.0015 -0.0010 +0.0050 +0.0023 P=0.99 -0.0078 +0.0022 +0.0051 +0.0029 P=0.59 Size
> 4 providers ≤ 4 providers
Number of months reporting 1-6 6-12 12-24 24+ -0.0202 +0.0067 +0.0058 +0.0040 P=0.01 -0.0005 +0.0174 +0.0082 +1.6251 P=0.76 -0.0158 +0.0031 +0.0014 -0.0004 P=0.02 -0.0045 -0.0036 +0.0036 -0.0002 P=0.95 -0.0283 -0.0006 -0.0033 -0.0006 P=0.01 AHEC Area Area L Charlotte Eastern Greensboro Mountain Northwest Southeast Southern Regional Wake +0.0019 +0.0052 +0.0011 -0.0006 +0.0097 +0.0083 +0.0058 +0.0031 +0.0001 P=0.88 +0.0114 +0.0027 +4.2585 +0.0056 +0.0047 +0.0044 +0.0029 +0.0079 +0.0324 P=0.79 +0.0028 -0.0100 +0.0004 +0.0010 -0.0003 -0.0026 0.0027 0.0014 0.0016 P=0.13 +0.0060 -0.0085 -0.0023 +0.0001 +0.0011 -0.0025 +0.0049 +0.0083 -0.0104 P=0.004 +0.0035 -0.0104 +0.0013 +0.0023 +0.0050 +0.0010 +0.0037 -0.0140 -0.0076 P=0.59 Baseline QIC Team
Assessment 0.5 Intent
1.0 Forming team 1.5 Planning 2.0 Activity 2.5 Changes 3.0 Improvement in 2 areas
+0.0016 +0.0097 +0.0029 +0.0068 -0.0180 -0.0006 P=0.05 +0.0080 +0.0192 +0.0064 +0.0063 -0.0176 +0.0032 P=0.91 +0.0009 +0.0011 -0.0008 +0.0030 -0.0080 -0.0040 P=0.35 -0.0040 +0.0031 +0.0021 +0.0007 +0.0149 -0.0013 P=0.99 -0.0135 +0.0088 <-0.0001 +0.0032 -0.0072 -0.0016 P=0.40 Team Engagement 0 – No activity 1 – Occasional mtg 2 – Regular mtg 3 – Active
+0.0052 +0.0057 -0.0003 +0.0140 P=0.53 +0.0107 +0.0082 +0.0060 +0.0212 P=0.71 -0.0019 -0.0005 +0.0013 0 P=0.87 -0.0037 -0.0015 +0.0068 +0.0026 P=0.99 -0.0014 -0.0072 +0.0054 +0.0041 P=0.53 Leadership 0 – No support 1 – Single person 2 – Special projects
3 – Integration
Registry
0 – No activity 1 – Selected 2 – Installed 3 – Testing workflow
+0.0090 -0.0013 +0.0057 +0.0048
P=0.60
+0.0128 +0.0028 +0.0127 +0.0091
P=0.91
+0.0011 -0.0051 -0.0003 +0.0022
P=0.24
-0.0022 +0.0010 -0.0005 +0.0034
P=0.99
-0.0187 -0.0045 +0.0094 +0.0041
TABLE 3: Rate of Improvement in Asthma Process and Intermediate Outcome Quality Measures According to Practice Characteristics
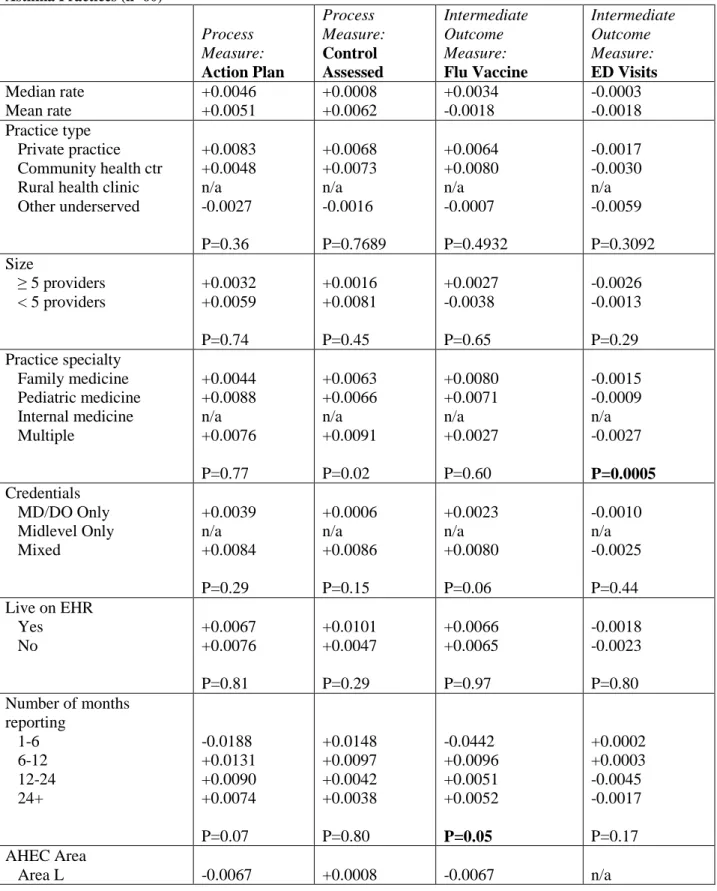
Asthma Practices (n=60)
Process Measure: Action Plan Process Measure: Control Assessed Intermediate Outcome Measure: Flu Vaccine Intermediate Outcome Measure: ED Visits Median rate Mean rate +0.0046 +0.0051 +0.0008 +0.0062 +0.0034 -0.0018 -0.0003 -0.0018 Practice type Private practice Community health ctr Rural health clinic Other underserved +0.0083 +0.0048 n/a -0.0027 P=0.36 +0.0068 +0.0073 n/a -0.0016 P=0.7689 +0.0064 +0.0080 n/a -0.0007 P=0.4932 -0.0017 -0.0030 n/a -0.0059 P=0.3092 Size
≥ 5 providers < 5 providers
+0.0032 +0.0059 P=0.74 +0.0016 +0.0081 P=0.45 +0.0027 -0.0038 P=0.65 -0.0026 -0.0013 P=0.29 Practice specialty Family medicine Pediatric medicine Internal medicine Multiple +0.0044 +0.0088 n/a +0.0076 P=0.77 +0.0063 +0.0066 n/a +0.0091 P=0.02 +0.0080 +0.0071 n/a +0.0027 P=0.60 -0.0015 -0.0009 n/a -0.0027 P=0.0005 Credentials MD/DO Only Midlevel Only Mixed +0.0039 n/a +0.0084 P=0.29 +0.0006 n/a +0.0086 P=0.15 +0.0023 n/a +0.0080 P=0.06 -0.0010 n/a -0.0025 P=0.44 Live on EHR
Yes No +0.0067 +0.0076 P=0.81 +0.0101 +0.0047 P=0.29 +0.0066 +0.0065 P=0.97 -0.0018 -0.0023 P=0.80 Number of months
Charlotte Eastern Greensboro Mountain Northwest Southeast Southern Regional Wake +0.0113 +0.0038 +0.0079 +0.0020 +0.0175 +0.0070 +0.0129 +0.0095 P<0.001 +0.0023 -0.0023 -0.0032 +0.0053 +0.0057 +0.0060 +0.0070 +0.0230 P=0.20 +0.0049 +0.0028 +0.0067 +0.0044 +0.0101 +0.0079 +0.0066 -0.0001 P<0.001 +0.0000 -0.0021 +0.0002 -0.0029 -0.0049 -0.0008 -0.0028 -0.0033 P=0.51 Baseline QIC Team
Assessment 0.5 Intent
1.0 Forming team 1.5 Planning 2.0 Activity 2.5 Changes 3.0 Improvement in 2 areas
-0.0206 +0.0083 +0.0058 +0.0086 +0.0152 +0.0590 P=0.07 -0.0108 +0.0082 -0.0005 +0.0242 +0.0143 +0.0093 P=0.26 -0.0417 +0.0067 +0.0090 -0.0008 +0.0074 +0.0112 P=0.40 -0.0047 -0.0006 -0.0023 -0.0005 -0.0015 +0.0007 P=0.61 Team Engagement 0 – No activity 1 – Occasional mtg 2 – Regular mtg 3 – Active
+0.0016 -0.0056 +0.0104 +0.0058 P=0.62 -0.0030 +0.0053 +0.0147 -0.0045 P=0.63 +0.0027 -0.0196 +0.0032 +0.0090 P=0.70 -0.0047 -0.0015 -0.0012 -0.0003 P=0.51 Leadership
0 – No support 1 – Single person 2 – Special projects 3 – Integration
+0.0011 -0.0080 +0.0070 +0.0136 P=0.48 -0.0011 -0.0020 +0.0196 +00015 P=0.32 +0.0032 -0.0242 +0.0007 +0.0115 P=0.53 -0.0047 -0.0018 -0.0020 +0.0003 P=0.31 Registry
TABLE 4: Rate of Improvement in Diabetes Process and Intermediate Outcome Quality Measures According to Practice Characteristics, Excluding High Performing at Baseline Practices
Process Measure: On Aspirin (% change per month) Process Measure: Foot Exam (% change per month) Intermediate Outcome : a1c ≤7 (% change per month) Intermediate Outcome :
BP ≤ 130/90 (% change per month)
Intermediate Outcome:
LDL ≤ 100 (% change per month)
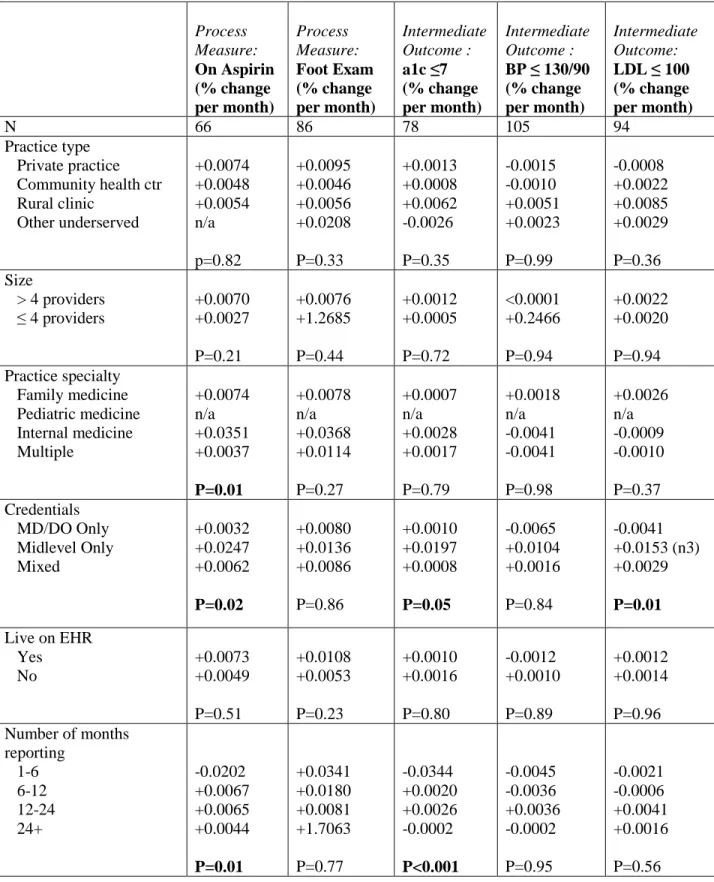
N 66 86 78 105 94
Practice type Private practice Community health ctr Rural clinic Other underserved +0.0074 +0.0048 +0.0054 n/a p=0.82 +0.0095 +0.0046 +0.0056 +0.0208 P=0.33 +0.0013 +0.0008 +0.0062 -0.0026 P=0.35 -0.0015 -0.0010 +0.0051 +0.0023 P=0.99 -0.0008 +0.0022 +0.0085 +0.0029 P=0.36 Size
> 4 providers ≤ 4 providers
+0.0070 +0.0027 P=0.21 +0.0076 +1.2685 P=0.44 +0.0012 +0.0005 P=0.72 <0.0001 +0.2466 P=0.94 +0.0022 +0.0020 P=0.94 Practice specialty Family medicine Pediatric medicine Internal medicine Multiple +0.0074 n/a +0.0351 +0.0037 P=0.01 +0.0078 n/a +0.0368 +0.0114 P=0.27 +0.0007 n/a +0.0028 +0.0017 P=0.79 +0.0018 n/a -0.0041 -0.0041 P=0.98 +0.0026 n/a -0.0009 -0.0010 P=0.37 Credentials MD/DO Only Midlevel Only Mixed +0.0032 +0.0247 +0.0062 P=0.02 +0.0080 +0.0136 +0.0086 P=0.86 +0.0010 +0.0197 +0.0008 P=0.05 -0.0065 +0.0104 +0.0016 P=0.84 -0.0041 +0.0153 (n3) +0.0029 P=0.01
Live on EHR Yes No +0.0073 +0.0049 P=0.51 +0.0108 +0.0053 P=0.23 +0.0010 +0.0016 P=0.80 -0.0012 +0.0010 P=0.89 +0.0012 +0.0014 P=0.96 Number of months
AHEC Area Area L Charlotte Eastern Greensboro Mountain Northwest Southeast Southern Regional Wake +0.0038 +0.0052 +0.0011 +0.0016 +0.0097 +0.0083 +0.0060 +0.0027 +0.0001 P=0.93 +0.0114 +0.0007 +4.258 +0.0085 +0.0047 +0.0044 +0.0032 +0.0139 +0.0361 P=0.84 +0.0055 -0.0068 +0.0010 +0.0010 +0.0002 -0.0034 +0.0027 +0.0008 +0.0011 P=0.47 +0.0060 -0.0085 -0.0023 +0.0001 +0.0011 -0.0025 +0.0049 +0.0083 -0.0104 P=0.99 +0.0051 -0.0104 +0.0017 +0.0023 +0.0066 -0.0009 +0.0046 +0.0039 -0.0043 P=0.28 Baseline QIC Team
Assessment 0.5 Intent
1.0 Forming team 1.5 Planning 2.0 Activity 2.5 Changes 3.0 Improvement in 2 areas
+0.0016 +0.0097 +0.0029 +0.0083 -0.0180 n/a p=0.03 +0.0056 +0.0192 +0.0059 +0.0063 +0.0149 +0.0032 P=0.91 +0.0030 -0.0002 -0.0010 +0.0032 -0.0080 -0.0040 P=0.22 -0.0040 +0.0031 +0.0021 +0.0007 +0.0149 -0.0013 P=0.99 +0.0010 +0.0138 <0.0001 +0.0030 -0.0072 +0.0068 P=0.08 Team Engagement 0 – No activity 1 – Occasional mtg 2 – Regular mtg 3 – Active
+0.0052 +0.0057 +0.0001 +0.0140 P=0.68 +0.0060 +0.0080 +0.0100 +0.0212 P=0.71 -0.0007 0.0004 0.0013 n/a p=0.99 -0.0037 -0.0015 +0.0068 +0.0026 P=0.99 +0.0005 +0.0012 +0.0056 +0.0032 P=0.72 Leadership 0 – No support 1 – Single person 2 – Special projects 3 – Integration
+0.0067 +0.0002 +0.0090 +0.0087 P=0.38 +0.0048 +0.0064 +0.0189 +0.0027 P=0.71 -0.0033 +0.0008 +0.0023 +0.0021 P=0.53 -0.0022 +0.0032 +0.0011 -0.0032 P=0.99 +0.0001 -0.0004 +0.0083 +0.0015 P=0.21 Registry
0 – No activity 1 – Selected 2 – Installed
TABLE 5: Rate of Improvement in Asthma Process and Intermediate Outcome Quality Measures According to Practice Characteristics, Excluding High Performing at Baseline Practices
Process Measure: Action Plan Process Measure: Control Assessed Intermediate Outcome Measure: Flu Vaccine Intermediate Outcome Measure: ED Visits
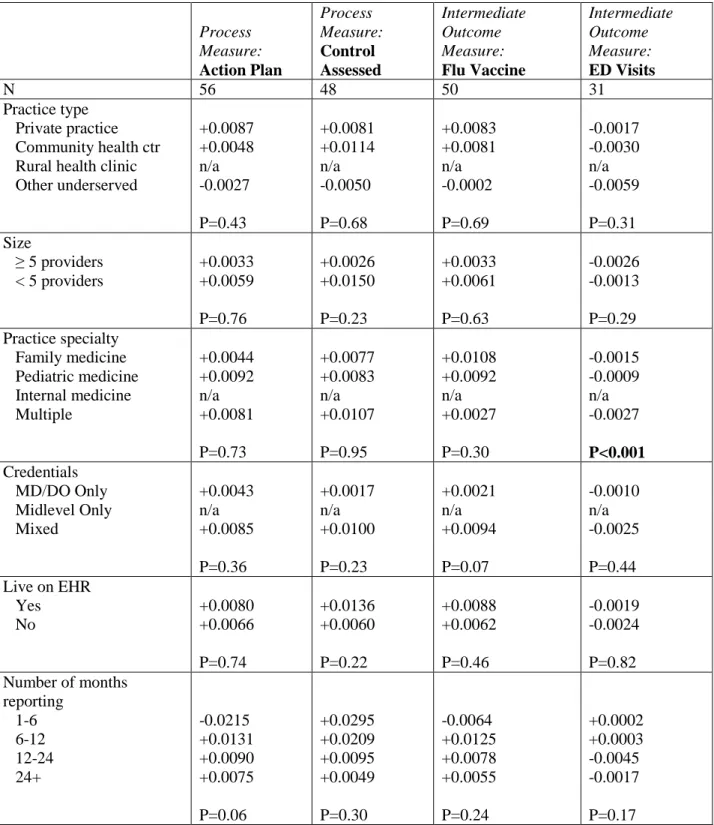
N 56 48 50 31
Practice type Private practice Community health ctr Rural health clinic Other underserved +0.0087 +0.0048 n/a -0.0027 P=0.43 +0.0081 +0.0114 n/a -0.0050 P=0.68 +0.0083 +0.0081 n/a -0.0002 P=0.69 -0.0017 -0.0030 n/a -0.0059 P=0.31 Size
≥ 5 providers < 5 providers
+0.0033 +0.0059 P=0.76 +0.0026 +0.0150 P=0.23 +0.0033 +0.0061 P=0.63 -0.0026 -0.0013 P=0.29 Practice specialty Family medicine Pediatric medicine Internal medicine Multiple +0.0044 +0.0092 n/a +0.0081 P=0.73 +0.0077 +0.0083 n/a +0.0107 P=0.95 +0.0108 +0.0092 n/a +0.0027 P=0.30 -0.0015 -0.0009 n/a -0.0027 P<0.001 Credentials MD/DO Only Midlevel Only Mixed +0.0043 n/a +0.0085 P=0.36 +0.0017 n/a +0.0100 P=0.23 +0.0021 n/a +0.0094 P=0.07 -0.0010 n/a -0.0025 P=0.44 Live on EHR
Yes No +0.0080 +0.0066 P=0.74 +0.0136 +0.0060 P=0.22 +0.0088 +0.0062 P=0.46 -0.0019 -0.0024 P=0.82 Number of months
AHEC Area Area L Charlotte Eastern Greensboro Mountain Northwest Southeast Southern Regional Wake -0.0067 +0.0129 +0.0036 +0.0079 +0.0020 +0.0175 +0.0070 +0.0129 +0.0095 P<0.001 +0.0008 +0.0146 -0.0010 -0.0050 +0.0059 +0.0095 +0.0067 +0.0070 +0.0307 P=0.69 -0.0067 +0.0054 +0.0022 +0.0090 +0.0048 +0.0101 +0.0107 +0.0066 +0.0019 P=0.99 n/a <0.0001 -0.0021 +0.0002 -0.0029 -0.0049 -0.0008 -0.0028 -0.0033 P=0.51 Baseline QIC Team
Assessment 0.5 Intent
1.0 Forming team 1.5 Planning 2.0 Activity 2.5 Changes 3.0 Improvement in 2 areas
-0.0206 +0.0083 +0.0058 +0.0086 +0.0152 +0.0590 P=0.08 +0.0012 +0.0082 +0.0013 +0.0300 +0.0205 +0.0093 P=0.56 +0.0033 +0.0085 +0.0108 -0.0008 +0.0089 +0.0111 P=0.88 -0.0047 -0.0006 -0.0023 -0.0005 -0.0015 +0.0007 P=0.61 Team Engagement 0 – No activity 1 – Occasional mtg 2 – Regular mtg 3 – Active
+0.0016 -0.0056 +0.0105 +0.0058 P=.63 +0.0012 +0.0123 +0.0189 -0.0045 P=0.72 +0.0033 +0.0088 +0.0035 +0.0090 P=0.94 -0.0016 -0.0047 -0.0012 -0.0003 P=0.51 Leadership
0 – No support 1 – Single person 2 – Special projects 3 – Integration
+0.0011 -0.0080 +0.0070 +0.0136 P=0.49 +0.0054 +0.0054 +0.0227 +0.0043 P=0.61 +0.0043 +0.0076 <0.0001 +0.0124 P=0.65 -0.0047 -0.0018 -0.0020 +0.0003 P=0.31 Registry
0 – No activity 1 – Selected 2 – Installed 3 – Testing
APPENDIX A: QIC Rating Form Definitions
Overall Team Assessment
0.5 - Intent to Participate Practice has completed application and participated in
informational call but the practice aim has not been customized nor has the QI team been formed.
1.0 - Forming team An aim statement has been completed and reviewed. Individuals have been assigned to QI Team, but no work has been accomplished yet.
1.5 - Planning for the project has begun
Team is engaged in planning improvement activities but no testing has begun.
2.0 - Activity, but no changes Initial testing cycles for team learning and planning have begun. For example, testing has started on measurement, data collection, study of processes, surveys, etc.
2.5 - Changes tested, but no improvement
Initial cycles for testing changes have begun and some PDSA results have been studied.
3.0 - Modest improvement 2 areas
Successful tests of changes have been completed for up to 2 high-leverage changes. Some improvements have been noted in run charts, monthly data, and monitoring data in at least 2 change areas.
3.5 - Improvement 3 areas Improvement toward project goals is demonstrated in at least 3 change areas.
4.0 - Significant improvement Practice-wide implementation has begun for all components of the change package. Testing and implementation is occurring in all 4 high-leverage change areas. Progress in monthly measures of at least 50% can be seen in monthly reports.
4.5 - Sustainable improvement Data on IPIP measures begins to indicate sustainability of changes and improvements across the practice.
5.0 - Outstanding sustainable results
Implementation cycles have been completed and all project goals and expected results have been accomplished. Organizational changes have occurred to support permanent improvements.
Team Engagement
0 - No activity No improvement activity exists.
1 - Occasional meetings Occasional meetings or discussion regarding improvement but no organization-wide understanding of improvement work or aim exists.
2 - Regular meetings Improvement team communicates regularly (through meetings, huddles, email, memos, etc) to plan tests & discuss results. Improvement team can describe project aim and measures.
3 - Active engagement Improvement team is planning and discussing multiple tests simultaneously and communicates findings to each other. Improvement progress is communicated to entire office staff. Most staff can describe improvement aim and measures. Improvement team participates in collaborative activities such as conference calls and listserv.
Leadership
1 - Single champion A manager or physician champion is involved but no organized improvement structure exists. “Try & see approach” is the norm for improvement activities.
2 - 'Special projects' A leader who supports improvement activities is identified, temporary tasks and roles to support improvement are assigned to staff, and some coordination of aim among projects exists (when multiple projects).
3 - Organizational integration QI work is integrated into daily routines, roles to support improvement are assigned, and performance evaluations are tied to improvement activities. Leadership for improvement exists to select and launch new improvement efforts (e.g., identifying aim, assigning team).
Sampling Methods
Convenience sample Charts selected for review each month; not a systematic random sample
Random chart review Charts selected for review using a systematic sampling method (e.g. random number table), so that all patient charts are equally likely to be reviewed
Registry/EHR incremental Patients are added to a registry or EHR system as the patients appear for visits
Registry/EHR pilot population All patients in a pilot population are pre-loaded into the registry or EHR system at the beginning of participation
Registry/EHR total population All patients in the practice are pre-loaded into the registry or EHR system at the beginning of participation
Registry
0 - No activity No activity on registry adoption or use 1 - Selected Practice has chosen a registry, but not yet begun using it. 2 - Installed Practice has registry installed on a computer, set up a template,
entered demographic data on patients of interest (e.g., diabetes) or has a process outlined to systematically enter the data.
3 - Testing workflow Practice is testing process for entering clinical data into registry; not yet using the registry to help with daily care of patients.
4 - Patient management All clinical data is entered into the registry and practice is using the registry daily to plan care for patients and is able to produce consistent reports on population performance.
5 - Full integration Registry is kept up to date with consistent, reliable processes. Practice has checks and monitors registry processes. Practice uses registry to manage entire patient panel (population).
4 - Partial implementation Process is implemented across the entire clinic, but practice is still working on consistency throughout clinic. To get a 4, the practice should have a consistent process that works at least in part of the clinic.
5 - Full implementation Template is used with every patient with target condition, consistently completed, and entered into the registry. Ongoing monitoring of system to ensure the template is used consistently is occurring.
Protocols
0 - No activity No activity on protocols
1 - Protocols identified Practice has identified protocols as examples and begun the process of customizing the protocols for their own practice.
2 - Planning testing Practice has version of template and planning tests of implementation. Often in only one part of the practice, but could be across the entire clinic.
3 - Tesing workflow Successful testing of the process for using the protocol is occurring. Ongoing implementation and optimization of the process is underway.
4 - Implementation 70% Spread of the process across the entire practice is occurring. The reliability of using the protocol is above 70%.
5 - Implementation 90% Reliability of protocol use is over 90% throughout the entire practice. Ongoing monitoring of the system to ensure that protocols are used consistently is also occurring.
Self Management Support
0 - No activity No activity on self management support 1 - Materials on hand Practice has obtained patient education materials and handouts
to support self-management.
2 - Roles assigned Practice has completed a plan for providing self-management support that includes all of the elements indicated in the change package. Staff roles and responsibilities are clearly delineated.
3 - Testing workflow Practice actively testing their process for self-management support. All staff involved in self-management support has undergone appropriate training. Patient goal setting and systematic follow-up are being implemented at least in part of the practice.
4 - Implementation 70% Self-management support is consistently offered. Practice documents self-management goals for patient in the chart or registry, getting performed across the entire practice. Monitoring reliability is occurring.
5 - Implementation 90% Patients consistently have self-management goals documented, follow-up system is reliable, staff are comfortable providing self-management support. Ongoing monitoring ensures the process is carried out consistently for all patients.
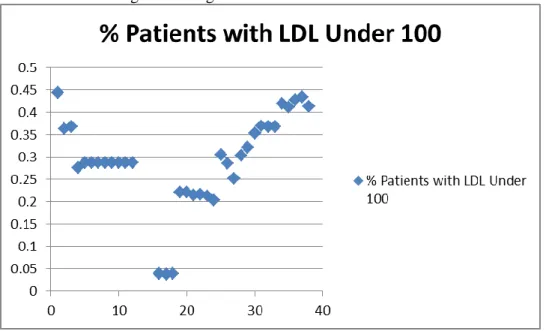
APPENDIX B: Sample rate of change calculation
Here, 0.386627907-0.223557692 = 0.163070215. To calculate the rate, we divided the change by the number of months. Here, the rate of improvement = 0.163070215/26 = 0.0062719313461538 percent per month.
Item Date No. of Months AsthmaPctFluVacc ChangeFluVacc RateFluVacc
11/1/2009 26 n/a 0.163070215 0.0062719313461538
12/1/2009 0.223557692
1/1/2010 0.235576923
2/1/2010 0.240654206
3/1/2010 0.234338747
4/1/2010 0.231277533
5/1/2010 0.233261339
6/1/2010 0.255269321
7/1/2010 0.230932203
8/1/2010 0.234800839
9/1/2010 0.282157676
10/1/2010 0.30785124
11/1/2010 0.398773006
12/1/2010 0.427991886
1/1/2011 0.437371663
2/1/2011 0.520879121
3/1/2011 0.368191721
4/1/2011 0.452926209
5/1/2011 0.460559796
6/1/2011 0.45994832
7/1/2011 0.465473146
8/1/2011 0.45974026
9/1/2011 n/a
10/1/2011 0.410557185
11/1/2011 0.386819484
12/1/2011 0.437888199
1/1/2012 0.386627907
Acknowledgements:
It is with deep appreciation that I acknowledge the individuals below for contributing their expertise, time, and support to this project.
Anthony Viera, MD/MPH
Distinguished Associate Professor, Department of Family Medicine, UNC
Adjunct Associate Professor, Public Health Leadership, Gillings School of Global Public Health
Warren Newton, MD/MPH
Chair, Department of Family Medicine, UNC
Vice Dean, Medical Education, UNC School of Medicine
Ann Lefebvre
Associate Director, Statewide Quality Improvement,
NC AHEC Adjunct Assistant Professor, Department of Family Medicine, UNCSam Cykert, MD
REC Clinical Director, NC AHEC Department of Internal Medicine, UNC
Carlee McConnell
Program Intern, NC AHEC