ABSTRACT
RICHARD P. McCOY. Biological Treatment of Wastewater from the Production of p-Nitrosophenol. (Under the Direction of Dr. MICHAEL D. AITKEN)
The biological treatability of p-nitrosophenol wastewater was investigated using Sequencing Batch
Reactors (SBRs). Two 2.5 1 SBRs were operated for more
than six months and were fed both a raw waste and a
synthetic feed. Removal of phenol was greater than 93% and soluble COD removal was 75% or greater. The inhibitory effects of the phenolic waste were partially overcome by increasing the number of treatment cycles per day.
#
TABLE OF CONTENTS
CHAPTER PAGE
I. INTRODUCTION ... 1
II. LITERATURE REVIEW ... 8
III. EXPERIMENTAL METHODS ... 32
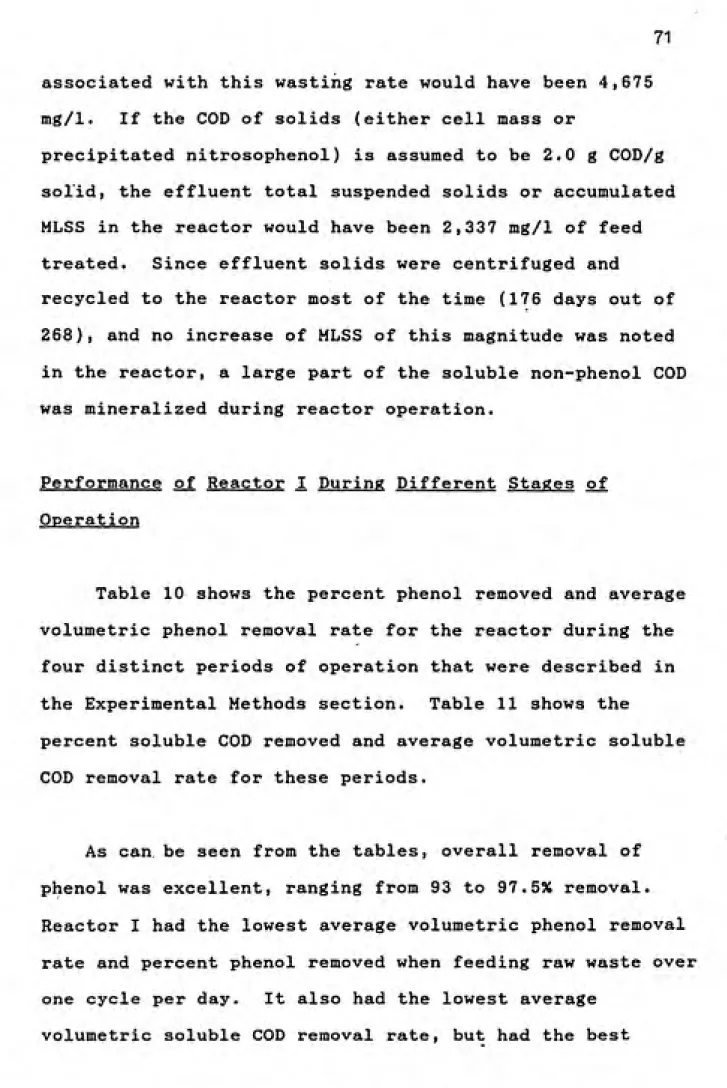
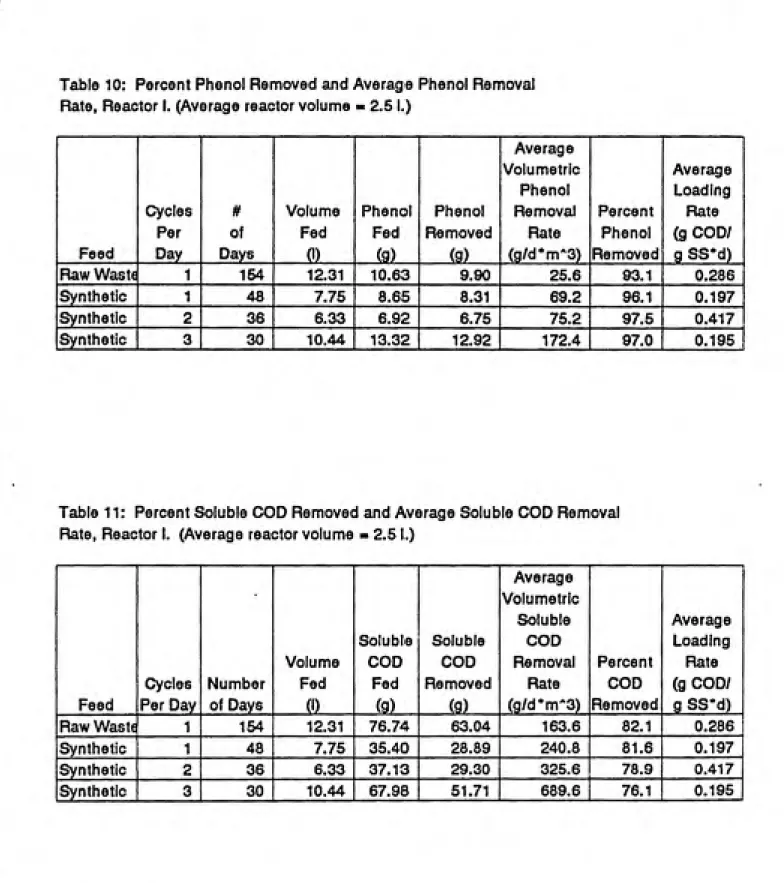
IV. REACTOR PERFORMANCE... 68
V. EXPERIMENTAL RESULTS ... 115
VI. CONCLUSIONS AND RECOMMENDATIONS ... 163
VII. REFERENCES ... 168
VIII. APPENDICES ... 171
11.
ACKNOWLEDGEMENTS
I would like to thank Dr. Mike Aitken for his guidance
and patience throughout this research study. I am also grateful to Marilyn Maerker for the assistance she seemed
always willing to provide in the laboratory. Thanks go to Ramani Kopecki, who performed the HPLC analysis. Also, thanks go to my friend, Jim Struve, who gave me my start with Lotus 1-2-3 and Allways.
Sandoz Chemicals of Mt. Holly, NC, funded this project under Budget Number 41399.
Special thanks also goes to the United States Air Force
and the taxpayers of the U.S.A. who provided my financial
111.
LIST OF FIGURES
Figure Title Page 1 Typical COD Standard Curve. 35 2 Typical Phenol Standard Curve Shown With
Standard Additions Test. 37
3 Nitrate Nitrogen Standard Curve (High
Range) Shown With Standard Additions
Test. 42
4 Nitrate Nitrogen Standard Curve (Medium
Range) Shown With Standard Addtions Test. 43
5 Nitrite Nitrogen Standard Curve Shown With
Standard Additions Test. 45
6 Phosphate Standard Curve Shown With
Standard Additions Test. 47
7 Schematic Drawing of Oxygen Uptake
System. 50
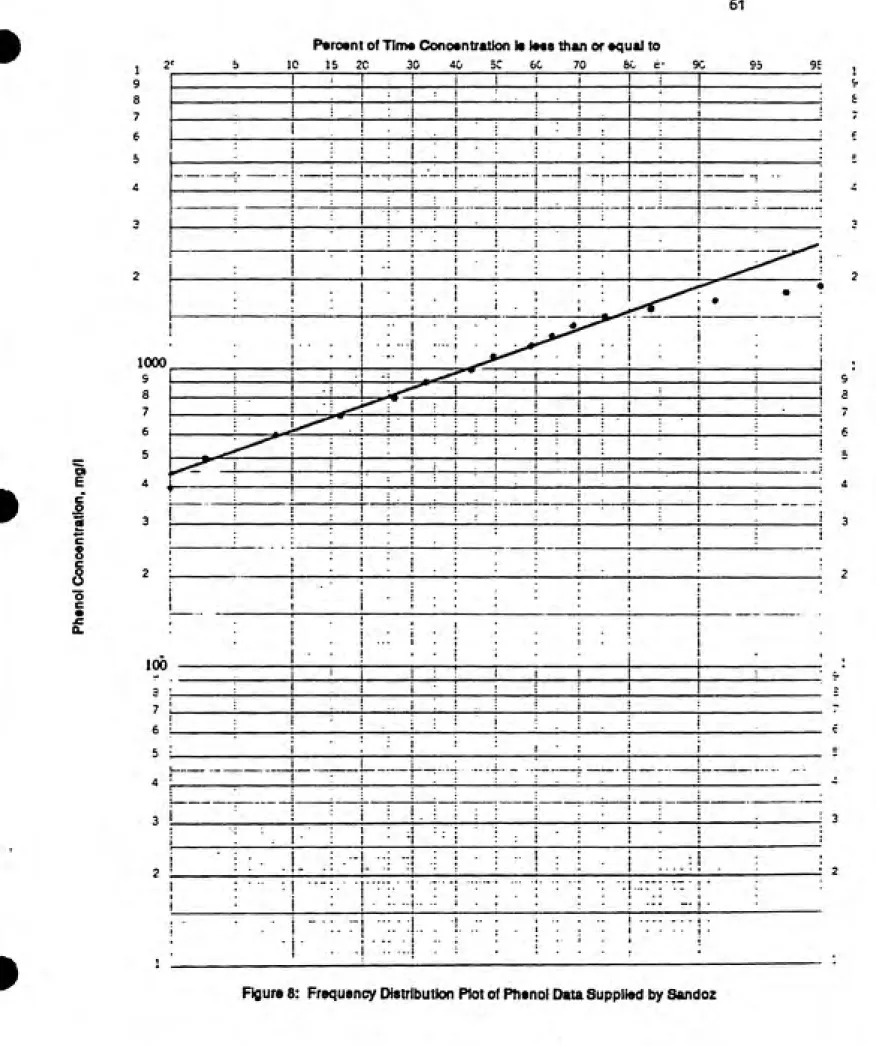
8 Frequency Distribution Plot of Phenol
Data Supplied by Sandoz. 61
9 Frequency Distribution Plot, Phenol Data
Supplied by Sandoz. 63
10 Cumulative Influent and Effluent Soluble
COD, Reactor I. 70
11 Cumulative Influent and Effluent Phenol,
Reactor I. 70
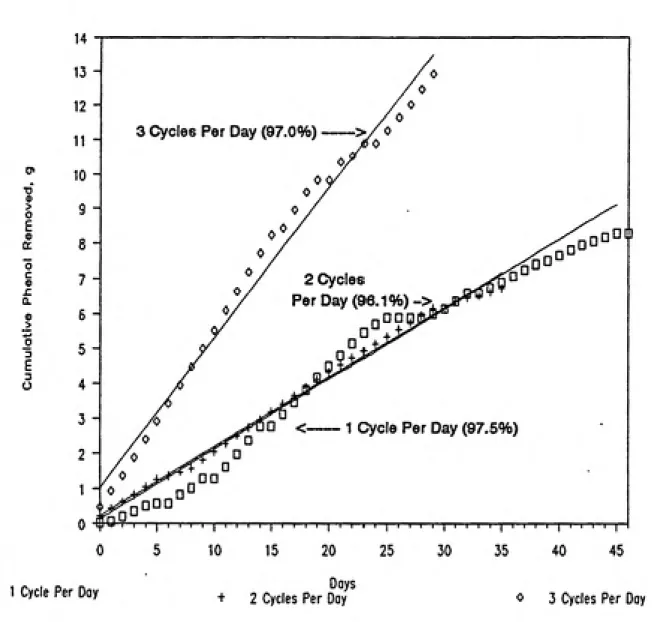
12 Cumulative Phenol Removed Feeding Reactor
I Synthetic Feed. 74
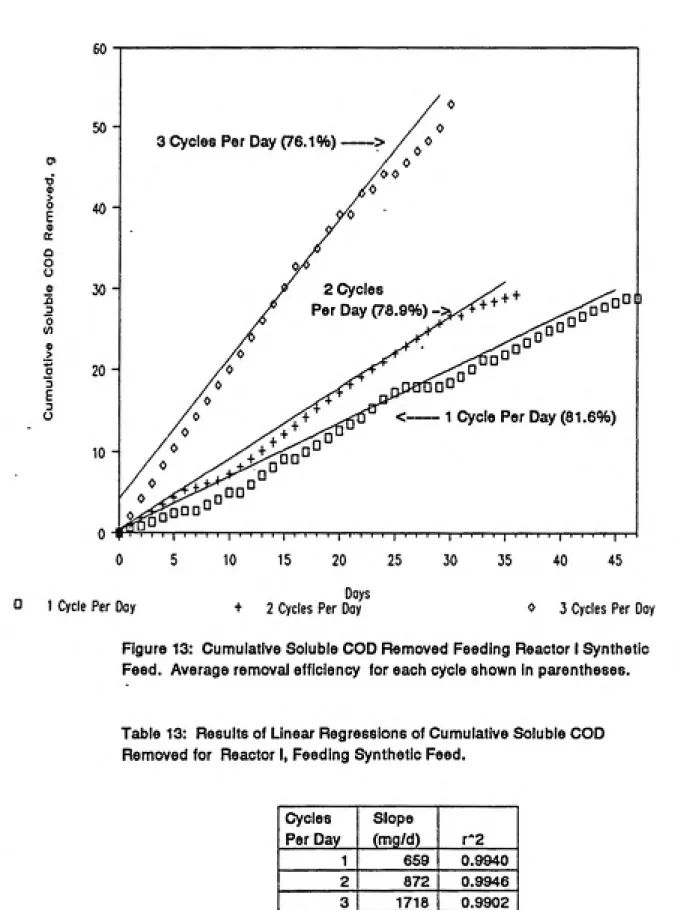
13 Cumulative Soluble COD Removed Feeding
Reactor I Synthetic Waste. 75
14 Effluent Phenol versus Loading Rate,
iv.
Figure Title Page
15 Effluent Soluble COD versus Loading Rate, Reactor I, Raw Waste. 77 16 Effluent Phenol versus Loading Rate,
Reactor I, Synthetic Feed, One Cycle
Per Day. 80 17 Effluent Phenol versus Loading Rate,
Reactor I, Synthetic Feed, Two Cycles
Per Day. 80 18 Effluent Phenol versus Loading Rate,
Reactor I, Syntetic Feed, Three Cycles
Per Day. 81 19 Effluent COD versus Loading Rate,
Reactor I, Synthetic Feed, One Cycle
Per Day. 83 20 Effluent COD versus Loading Rate,
Reactor I, Synthetic Feed, Two Cycles
Per Day. 83
21 Specific Phenol Removal Rate versus Loading Rate, Reactor I, Feeding Raw
Waste. 86
22 Specific Soluble COD Removal Rate versus Loading Rate, Reactor I, Feeding Raw
Waste. 86
23 Specific Phenol Removal Rate versus Loading Rate, Reactor I, Synthetic Feed, One Cycle
Per Day. 87 24 Specific Phenol Removal Rate versus Loading
Rate, Reactor I, Synthetic Feed, Two and
Three Cycles Per Day. 87 25 Specific Soluble COD Removal Rate versus
Loading Rate, Reactor I, Synthetic Feed,
One, Two, and Three Cycles Per Day. 89
26 Percent Phenol Removed versus Loading Rate,
Reactor I, Feeding Raw Waste. 90
27 Percent Soluble COD Removed versus Loading
V.
Figure Title Pa£e
28 Percent Phenol Removed versus Loading Rate, Reactor I, Synthetic Feed, One Cycle Per
Day. 92
29 Percent Phenol Removed versus Loading Rate, Reactor I, Synthetic Feed, Two and Three
Cycles Per Day. 92
30 Percent Soluble COD Removed versus Loading Rate, Reactor I, Synthetic Feed, One, Two,
and Three Cycles Per Day. 93
31 Cumulative Influent and Effluent Soluble
COD, Reactor II. 95
32 Cumulative Influent and Effluent Phenol,
Reactor II. 95 33 Cumulative Phenol Removed Feeding Reactor
II Synthetic Feed. 99 34 Cumulative Soluble COD Removed Feeding
Reactor II Synthetic Feed. 100 35 Effluent Phenol versus Loading Rate,
Reactor II, Raw Waste. 102 36 Effluent Phenol versus Loading Rate,
Reactor II, Synthetic Feed, One Cycle
Per Day. 104 37 Effluent Phenol versus Loading Rate,
Reactor II, Synthetic Feed, Two Cycles
Per Day. 104 38 Effluent COD versus Loading Rate, Reactor
II, Synthetic Feed, One Cycle Per Day. 105 39 Specific Phenol Removal Rate versus
Loading Rate, Reactor II, Raw Waste. 107 40 Specific Phenol Removal Rate versus
Loading Rate, Reactor II, Synthetic
Feed. 108 41 Specific Soluble COD Removal Rate
versus Loading Rate, Reactor II,
VI.
Figure Title Page
42 Percent Phenol Removed versus Loading
Rate, Reactor II, Raw Waste. 110
43 Percent Phenol Removed versus Loading
Rate, Reactor II, Synthetic Feed. Ill
44 Percent Soluble COD Removed versus Loading Rate, Reactor II, Feeding
Synthetic Feed. Ill
45 Effect of Wasting on Performance of
Reactor I. 113
46 Effect of Wasting on Performance of
Reactor II. 114
47 Initial Shake Flask Experiments to
Determine Need for Nutrients. 126
48 Subsequent Shake Flask Study of Need
for Nutrients. 126
49 Effect of Trace Elements Concentration
on Growth. 127
50 Effect of pH on Microbial Growth. 133
51 SOUR Ratios as a Function of Loading
Rate, Reactors I and II, Using Raw Waste
as Carbon Source. 142
52 SOUR Ratios as a Function of Loading Rate, Reactor I, Using Synthetic Feed as
Carbon Source. 142
53 SOUR Ratios as a Function of Phenol
Concentration, Reactor I. 144
54 SOUR Ratios as a Function of Phenol
Concentration, Reactor II. 144
55 Specific Oxygen Uptake Rate as a Function
of Phenol Concentration. 152
56 Specific Oxygen Uptake Rate as a Function
of Soluble COD Concentration. 152
Vll.
Figure Title Page
58 Blowup of Inflection Point for
Nitrosophenol Titration. 156
Vlll.
LIST OF TABLES
Table Title Page
1 COD Standard Curve Correlations. 35
2 Phenol Standard Curve Correlations. 37 3 Characteristics of Raw Waste Received
From Sandoz. 57
4 Nutrient Concentrations of the Feed. 59 5 Data Distribution for Phenol. 60
6 Data Distribution for Nitrosophenol. 60
7 Data Distribution for 4-Nitrophenol. 60
8 Data Distribution for Nitrosophenol:
Phenol Ratio. 60
9 Measured and Theoretical Soluble COD,
Phenol, and Nitrate. 65 10 Percent Phenol Removed and Average Phenol
Removal Rate, Reactor I. 72 11 Percent Soluble COD Removed and Average
COD Removal Rate, Reactor I. 72
12 Results of Linear Regressions of Cumulative
Phenol Removed for Reactor I, Feeding
Synthetic Feed. 74
13 Results of Linear Regressions of Cumulative
Soluble COD Removed for Reactor I, Feeding
Synthetic Feed. 75
14 Effluent Phenol versus Loading Rate,
IX.
Table Title Pa^e
15 Effluent Soluble COD versus Loading Rate, Reactor I, Raw Waste. 77
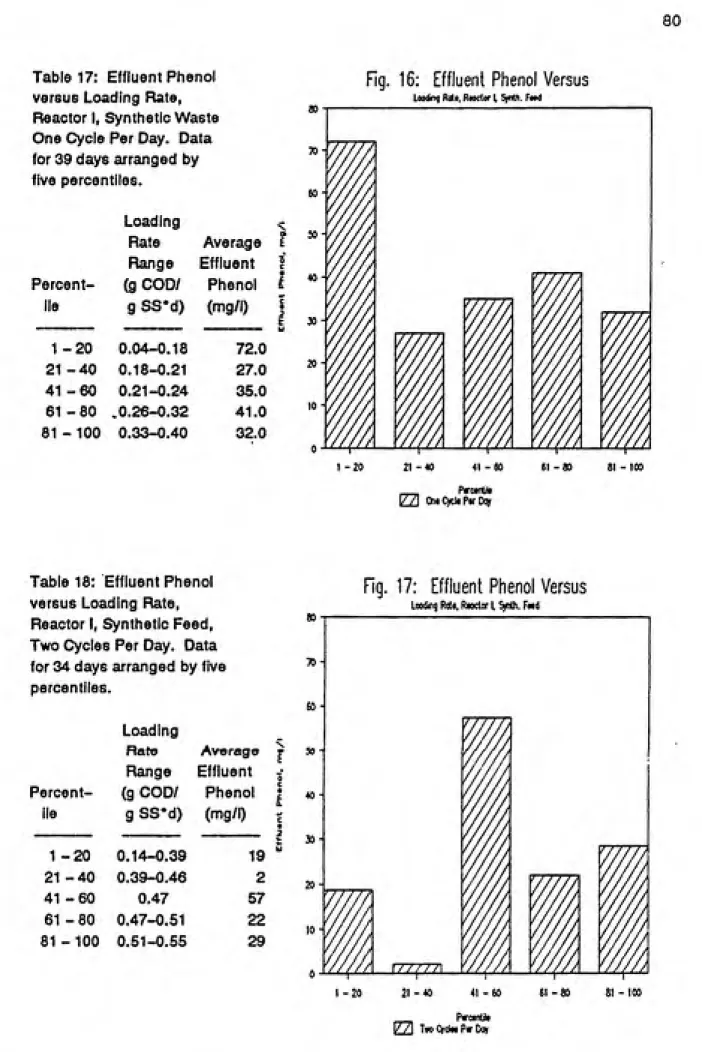
16 Data Distribution of Effluent Phenol
Concentrations, Reactor I, Raw Waste. 79
17 Effluent Phenol versus Loading Rate, Reactor I, Synthetic Waste, One Cycle
Per Day. 80
18 Effluent Phenol versus Loading Rate, Reactor I, Synthetic Feed, Two Cycles
Per Day. 80
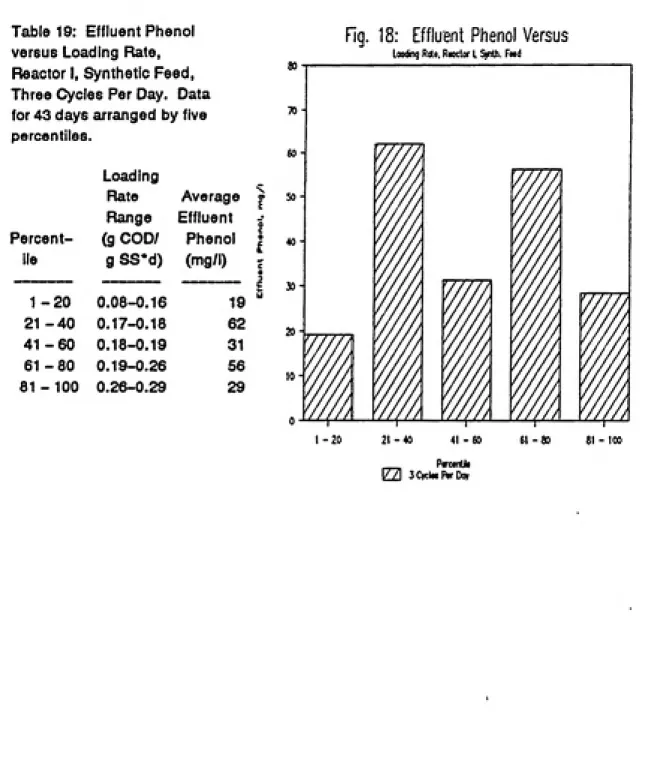
19 Effluent Phenol versus Loading Rate,
Reactor I, Synthetic Feed, Three Cycles
Per Day. 81 20 Effluent Soluble COD versus Loading Rate,
Reactor I, Synthetic Feed, One Cycle Per
Day. 83 21 Effluent Soluble COD versus Loading Rate,
Reactor I, Synthetic Feed, Two Cycles Per
Day. 83 22 Data Distribution of Effluent Phenol
Concentrations, Reactor I, Synthetic
Feed. 84
23 Percent Phenol Removed and Average Phenol
Removal Rate, Reactor II. 97
24 Percent Soluble COD Removed and Average
Soluble COD Removal Rate, Reactor II. 97 25 Results of Linear Regressions of
Cumulative Phenol Removed for Reactor II,
Feeding Synthetic Feed. 99
26 Results of Linear Regressions of
Cumulative Soluble COD Removed for Reactor
II, Feeding Synthetic Feed. 100
27 Effluent Phenol versus Loading Rate,
X.
Table Title Page
28 Data Distribution of Effluent Phenol Concentrations, Reactor II, Feeding
Raw Waste. 102
29 Effluent Phenol versus Loading Rate,
Reactor II, Synthetic Feed. 104
30 Effluent Phenol versus Loading Rate, Reactor II, Synthetic Feed, Two Cycles
Per Day. 104 31 Effluent Soluble COD versus Loading Rate,
Reactor II, Synthetic Feed, One Cycle Per Day. 105
32 Data Distribution of Effluent Phenol
Concentrations, Reactor II, Feeding
Synthetic Feed. 105 33 Effect of Wasting on Performance of
Reactor I. 113
34 Effect of Wasting on Performance of
Reactor II. 114
35 Results of Precipitation Under Reactor
Conditions Experiment. 118 36 Results of Precipitation Experiment. 120 37 Results of Adsorption Experiment. 121
38 Nutrient Concentrations Used for the
Shake Flask Experiments. 123
39 Key to Sample Sets Used in Shake Flask
Experiments. 124
40 Determination of Need for
Ammonia-Nitrogen Using Enrichment cultures. 129
41 Determination of Amount of
Ammonia-Nitrogen Required for Biodegradation
Using Enrichment Cultures. 130 42 Determination of Need for Phosphorus in
Reactor I. 132
43 Determination of Need for Phosphorus in
XI.
Table Title Page
44 Phenol, Soluble COD, and MLSS Monitoring
of 0% Salt Enrichment. 136
45 Phenol, Soluble COD, and MLSS Monitoring
of 2% Salt Enrichment. 138
46 Effect of Feed Species on Inhibition of the Specific Oxygen Uptake Rate in
Reactor I. 146 47 Phenol and Soluble COD Concentration
Profiles for Reactor I During
Non-Consecutive Fill and React Periods. 148 48 Phenol and Soluble COD Concentration
Profiles During React For Reactor I. 148 49 Denitrification After a Pulse Feeding
of Synthetic Waste. 151 50 Determination of Yield During React
Period. 154
51 Fate of Nitrogen During Nitrosophenol
Degradation. 158
52 Degradation of Nitrosophenol as Sole
Carbon Source in Reactor Feed. 160
53 Measurement of Mixed Liquor Decay Over
I. INTRODUCTION
The purpose of this research project was to determine the feasibility of biologically treating an industrial wastewater using sequencing batch reactors (SBRs). This project was funded by Sandoz Chemicals of Mt. Holly, NC.
Sandoz Chemicals, located 6 miles west of Charlotte, NC, is one of the largest manufacturers of textile dyes and
dye intermediates in the United States. The plant employs approximately 350 people and its products are distributed throughout the US and overseas. The textile manufacturing processes at the Mt. Holly plant are all batch processes. The most common reactions used to produce dyes are
sulfonation, chlorination, nitration and nitrosation of phenol and chlorobenzene. These batch processes result in a waste stream with varying concentrations of a wide
variety of organic and inorganic constituents. The plant currently treats the majority of its wastewater on site by means of chemical neutralization and biological treatment.
#
2 One particular wastestream that the company is
concerned about is the wastewater resulting from the
production of p-nitrosophenol. p-Nitrosophenol (C H NO ,
6 5 2 1,4-benzoquinone monoxime) is an important stock chemical used in the synthesis of dyes by Sandoz and other dye manufacturers. Nitrosophenol (as p-nitrosophenol will be referred to in the rest of this report) is produced by the nitrosation of phenol using sodium nitrite in a
concentrated sulfuric acid medium. 4-Nitrophenol is a byproduct of this reaction.
After the reaction is complete, the liquid
(approximately 50,000 gallons) is drained from the reaction vessel and put through a centrifuge. Since nitrosophenol
is a relatively insoluble compound at acid pH, the majority of the nitrosophenol produced in the reaction is captured
in the centrifuge cake.
The centrate that remains consists of dissolved and
suspended nitrosophenol, 4-nitrophenol, phenol, sodium nitrite, and sulfuric acid. The organic content of the wastestream, on average, consists of 1340 mg/1
nitrosophenol, 1140 mg/1 phenol and 190 mg/1 4-nitrophenol. However, there is considerable variability in these
concentrations from batch to batch.
•
currently treats the majority of the wastewaters
generated, the nitrosophenol process wastewater is not sent to the activated sludge system. The discharge permit issued to Sandoz Chemicals has a very strict mass limit on phenol, so that it is prudent for them to pre-treat wastes that have a high phenol content, such as the nitrosophenol wastewater. The current treatment method for this
wastestream is chemical oxidation in a batch system using
hydrogen peroxide in the presence of iron (the Fenton
Reaction):
Fe(III) p-Nitrosophenol + Phenol + 4-Nitrophenol + H 0 ---->
2 2 CO + H 0 + NO + other products
2 2 3
The optimum pH for the reaction has been found to be between 3.5 and 4.3. This is achieved by adding sodium hydroxide to the centrate. The theoretical molar ratio of peroxide to phenol is 14:1. Personnel at the plant use considerably more than the theoretical ratio. The current cost of treatment with this system is very high.
Ferric sulfate is used as the catalyst at 50 lb per 50,000 gallon batch. The oxidation reaction is highly
exothermic and foaming is used as an indication of reaction rate. The reaction is performed at very low initial
o
4
nitrosophenol, 4-nitrophenol, and phenol after peroxide oxidation showed virtually complete elimination of all
three chemicals in 60 individual batches. Data on reaction
products from the chemical oxidation process are not
available.
Because of the hazard and expense of using hydrogen peroxide (50% reagent is used), Sandoz is very interested
in converting its nitrosophenol filtrate treatment process to a biological system. In addition, the current
production rate of nitrosophenol is restricted by the limited capacity of the chemical oxidation treatment
process.
Sequencing batch biological reactors pose significant advantages to Sandoz in the treatment of this waste stream. Sequencing batch reactors are essentially a set of tanks
that operate on a fill and draw basis. Each tank in the SBR system is filled during a discrete period of time and then operated as a batch reactor. After desired treatment,
the mixed liquor is allowed to settle and the clarified supernatant is drawn from the tank. Sequencing batch
biological reactor design and operation was recently / reviewed (Irvine and Ketchum, 1989), and the following
description of SBRs is from that article.
conventional continuous-flow activated sludge system is
that each SBR tank carries out functions such as
equalization, aeration, and sedimentation in a time, rather
than a space sequence. One advantage of the time
orientation is the flexibility of operation. The total
time in the SBR is used to establish the size of the system
and can be related to the total volume of a conventional continuous-flow facility.
The cycle for each tank in a typical SBR is divided
into five discrete time periods: Fill, React, Settle,
Draw, and Idle.
During Fill, the influent wastewater is added to the
biomass which remained in the tank from the previous cycle.
The Fill period may be either a Static Fill (no mixing or
aerating). Mixed Fill (mixing without aerating), or Aerated
Fill. Fill is typically terminated when the tank is full
or when the next tank in the sequence is ready to receive
influent.
Reactions that may have been initiated during the Fill
period are completed during React. React is characterized
by a high concentration of substrate at the beginning of
the period. By the end of React, most, if not all, of the
6
differences in substrate concentration thus achieved can be
an important aspect in selection of the microbial community
in the reactor, and can lead to the development of a
culture adapted to transient loading conditions.
After the React period is over, aeration (and sometimes
mixing) is stopped and quiescent conditions are maintained
in the reactor during a Settle period to allow settling of
the biomass. The Settle period is usually between 1 and 2 hours. After Settle, the supernatant is drawn off during Draw. Supernatant can be drawn by either a floating pump or adjustable weir or a pipe at a fixed position in the side of the reactor. Draw typically only takes 5-30% of the total cycle time. After drawing off the effluent, the SBR may go into an Idle period or it may immediately begin
a new Fill period.
At the Sandoz plant, three tanks are available near the nitrosophenol treatment area and would be ideal for use as
SBRs. With a minimum of retrofitting, a two tank SBR system, using the third tank as an equalization/storage tank could be set up with a minimal amount of capital
equipment.
One of the objectives of this study was to determine whether the existing tank volume would be sufficient to
This required an evaluation of treatment efficiency as a
function of loading rate. In addition, Sandoz gave a
stated objective that the biological process should remove
phenol to below 10 mg/1 consistently. Specific objectives
of the study included:
1. evaluate the biodegradability of nitrosophenol
wastewater constituents and the treatability of the waste
in a bench-scale SBR;
2. determine nutrient requirements for optimum
degradation;
3. evaluate treatment performance as a function
of reactor operating conditions; and
4. draw conclusions as to the biological
treatability of the waste and develop a conceptual process
II. LITERATURE REVIEW
Sequencing Batch Reactors
The historical perspective, advantages of SBRs over
conventional biological treatment systems, and design considerations for using multiple tanks (since it is proposed that two or three tanks at the Sandoz plant be reconfigured as SBRs) are discussed below. This
information has been excerpted from Irvine and Ketchum
(1989).
1. Historical Perspective: Sequencing Batch
Biological Reactors were initially studied and placed into actual service in the early 1900s. Good removal of
suspended solids and BOD was observed in the treatment of domestic sewage as early as 1914. However, in the 1920s, research and development efforts switched to continuous
flow treatment systems due to the high discharge flow rate relative to that of the influent when one tank is employed,
clogging of diffusers because of periodic settling of the
multiple tank strategy alleviates the first objection and
vast improvements made since the 1920s in aeration devices
and control systems obviate the second and third
objections. Today, applications of SBR technology can
focus more on process advantages over continuous systems,
rather than on factors associated with hardware and
operating labor.
2. Advantages of the SBRs:
a. Equalization and Dilution: SBRs have two
distinct advantages over conventional biological treatment
systems when employed in the degradation of high strength,
variable composition waste. These are its ability to
equalize and dilute wastes. When a significant amount of
the total reactor liquid volume is removed during Draw, and
no aeration is provided during Fill, the SBR acts like a
stepwise equalization system. Wastewater with a highly
variable concentration is equalized over the period of
Fill. When a relatively small amount of effluent is
withdrawn during Draw, and the liquid level in the reactor
is high at the beginning of Fill, the effect is to dilute
the influent wastewater. Thus, the SBR provides a
buffering action against rapid changes in concentration of
any component in the reactor that could result from a
10
b. Population Selection: The power of an
unsteady-state SBR comes from its ability to provide the
microbial consortium with a controlled environment which
will select for organisms that have advantageous
characteristics in treating the wastewater. For instance,
Static Fill is frequently used to establish feast
conditions (high instantaneous substrate concentratations)
in the SBR. Famine conditions naturally result during
React, when the substrates are being utilized without the input of raw waste. Organisms that are able to compete
best for the food supplied under alternating conditions of
feast and famine will be enriched in the system.
In another example. Mixed Fill conveniently allows alternative electron acceptors such as nitrite and nitrate to be utilized. Thus if oxidized forms of nitrogen are
generated by nitrification in the SBR during Aerated Fill
or React, denitrification will take place during unaerated
periods.
3. Design Considerations Involved with Using Multiple-Tank SBRs:
a. In multiple tank systems, the time
11
sum of the Fill periods for all other tanks. Therefore as
the number of tanks increases, the fraction of time devoted
to Fill in any one tank decreases, and an increased
fraction of time during a cycle is available for React,
Settle, and Idle.
b. For a given total tank volume, the load
that can be handled increases as the number of tanks is
increased.
Because of the unsteady-state nature of Fill and React,
a kinetic-based definition of sludge age, an important
operating parameter in conventional activated sludge
systems, is not possible. However, an evaluation of the
kinetics and stoichiometry of the treatment system is vital
(Irvine, et al., 1977). A mathematical method of
describing the kinetic relationships of multiple reactions
involved in an SBR has been presented (Irvine, et al.,
1980). The rates of various reactions help determine the
relative importance of each reaction in a reaction scheme.
Because the SBR has five nonaeration-oriented functions
(Static Fill, Mixed Fill, Settle, Draw, and Idle), the
definition of mass loading rate is also obscured. A useful
definition of mass loading rate in an SBR adjusts the time
• 12
including only the fraction of time the mixed liquor is
under aeration each day.
The effect of the organic loading rate on the operation
of an SBR treating municipal waste has been reported
(Irvine, et al., 1985). The study was done at the Culver,
IN, Wastewater Treatment Plant. Two SBRs had been
retrofitted at the plant. During the two month study, one
tank was operated at an organic loading rate (adjusted for
aeration time) of 0.16 kg B0D5/kg MLVSS-d, and the other
was operated at an organic loading rate of 0.42. The
performance of the SBR at the low loading rate was found to
be better than the SBR at high loading rate in terms of
effluent B0D5, and suspended solids (SS) . However, both
SBRs maintained effluent qualities that were quite good.
It was found that the highly loaded reactor was more
difficult to operate.
The effect of the loading rate on effluent quality in
an SBR treating domestic sewage was evaluated (Hoepker and
Schroeder, 1979). Because bioflocculation has been
associated with extracellular polymer production occurring
under low growth rate conditions, the effluent turbidity
was thought to be related to the maximum growth rate
experienced during the feed cycle. In this study effluent
SS and TOC were measured as functions of loading rate.
13
concentration. No relationship was found between effluent
quality and growth rate in the reactor. The lower feed
strength and lower growth rate systems were found to have
lower suspended solids concentrations.
A study was performed to determine the effect of the
Fill:React ratio on SBR performance (Dennis and Irvine,
1979). In this study Fill and React times were varied to
determine the effect on settleability of the mixed liquor.
A loading rate of 0.3 g B0D5/g MLSS-d was used. It was
found that employing short Fill periods, and consequently
long React periods, settleability was markedly better than
for long Fill and short React periods.
Treatment of Hazardous Waste Using Sequencing Batch
Biological Reactors
The treatment of an industrial wastewater with SBRs has
been evaluated at bench scale (Murthy, et al., 1988). In
this study the wastewater from the production of Roundup
(TM), an agricultural pesticide, was treated using batch
flasks and with SBRs. The target compound for removal in
the wastewater was glyphosate (N-phosphono-methyl glycine,
COOH-CH2-NH-CH2-H2P03). The feed to the reactors had a
soluble COD of 3600 mg/1 and a glyphosate concentration of
14
Complete removal of glyphosate was achieved in preliminary studies using SBRs up to an initial
concentration of 3000 mg/1. Denitrification was found to
be an important mechanism in glyphosate removal, so the
Fill period was changed from an Aerated Fill to a Mixed
Fill. When this occurred, better removal rates were observed.
The results of bench scale and initial operation of a
full scale SBR system to treat landfill leachate, water
from a groundwater remediation program, and bulk hazardous
waste has been reported (Herzbrun, et al., 1985). The
plant is operated by CECOS International at Niagara Falls,
NY. Prior to the SBR study, removal of organics in the
wastewater was accomplished by adsorption onto activated
carbon.
Preliminary studies had confirmed the treatability of
the wastewater (Herzbrun, et al., 1984). Total Organic
Carbon degradation ranged from 55 to 81% and phenol
degradation ranged from 96.8 to 99.2%. Foaming was
observed during the treatment of the waste on several
occasions, but was easily controlled with a bubble breaking
compound. A study to determine the effect of a power
failure or mechanical problems showed that with no air
short-15
term or long term effects were observed.
During the bench scale testing, the waste treated had
an influent TOC of 1620 mg/1 and influent phenol of
approximately 40 mg/1. Two reactors were operated over a
nine-week period. One reactor operated at room temperature
(21 - 25 degrees C) and the other operated below room
temperature (5-17 degrees C) to simulate cold weather
operation. Total Organic Carbon (TOC) removal averaged 79%
for the room temperature reactor and 75% for the cold weather reactor. Overall effluent phenol concentrations
averaged 0.4 mg/1 throughout the bench scale study for both
reactors.
Phenol augmentation was evaluated in both reactors to evaluate reactor performance at increasing levels of
influent phenol. The weekly average concentration of
phenol was increased from 40 mg/1 to 570 mg/1 over a six
week period. The room temperature reactor maintained an
effluent phenol concentration of 0.4 mg/1 and the simulated
cold-weather reactor experienced two weekly average spikes
of 55 mg/1 and 63 mg/1.
Results of the second through the fifth week of full
scale SBR operation were reported. The one 1900 m^S SBR
16
an eight to nine day retention time. Phenol degradation in
the SBR averaged 99% and average TOC removal was 72%.
These reductions in phenol and TOC by biological methods
resulted in significant cost savings over carbon adsorption
alone. Carbon adsorption was retained, though, as a
polishing step for the effluent.
The treatment of soils and leachate from a landfill
containing typical coal gasification wastes such as
polynuclear aromatic hydrocarbons (PNAs), phenols, coal
tars and oils, and cyanide- and sulfate-containing wastes
was reported (Brenner, et al., 1987). In this study the
overall goal was to develop a "specialized bacteria" to be
used in a land farming technique to remediate the soil.
The SBR was chosen to develop the specialized bacteria
because of the unique activities that can occur during its
Settle period.
During the Settle period, the microorganisms have an
opportunity to perform plasmid exchange, in which general
enrichment of genetic information is achieved. This was
thought to be an excellent way to develop a population of
organisms that would be adapted to coal conversion gas by¬
product degradation. Once the population was developed,
the SBR would be used to culture organisms to be applied to
the surface of the contaminated site to maximize the rate
17
A population of organisms was isolated from soils at
the site and were confirmed to degrade phenol, naphthalene,
and acenaphthene by plating and respirometry methods. Two
initial SBRs were operated using a soil/leachate mixture as
the feed to one reactor and the low COD (100 mg/1 soluble
COD) leachate as the feed to the other reactor.
Performance of these screening test reactors showed good
removal of soluble COD and good oxygen uptake rates.
Four bench scale SBRs were then operated. Two of the
four reactors were fed a soil/leachate mixture which had a
soluble COD of 30 to 75 mg/1 and a total COD of 350 to 900
mg/1. Phenol concentrations in the feed mixture averaged
13.1 ug/1. The other two reactors received this same feed
supplemented with glucose (5 mg/1 as COD).
Effluent soluble COD ranged from 15 to 40 mg/1.
Effluent phenol concentrations were 0.5 ug/1 in one reactor
not supplemented with glucose and less than 0.14 ug/1 in
the other three reactors. Moderate wasting of sludge
resulted in higher MLSS. The reactors fed
glucose-augmented feed had higher yields of solids, though all
reactors achieved high removal efficiencies for most of the
feed constituents. The effluents from the reactors were
turbid and this was thought to be due to the oily nature of
18
Treatment of another landfill leachate in Niagara, NY
was also evaluated using SBRs (Ying, et al., 1986). The
leachate was mixed with a small amount of chemical
manufacturing wastewaters before treatment. The leachate
accounted for about 60% of the combined wastewater volume,
but 80% of the total organic loading to the existing
adsorption system. The combined waste feed had an average
phenol concentration of 780 mg/1, COD concentration of 9200
mg/1, and total dissolved solids averaged 22,000 mg/1.
Previous treatment consisted of activated carbon
adsorption. Poor adsorptive capacities were observed for
many of the organic compounds present in the wastewater due
to competitive adsorption rather than poor bed design or
operational problems. Any treatment technology capable of
reducing this competition could extend the adsorption
service cycle.
Initial bench scale SBR studies showed reduction of
about 90% of the TOO was achieved. Supplementation of a
strain of bacteria isolated from the landfill.site improved
the treatment efficiency of the reactor. Subsequent SBR
studies were then performed using 1, 12 and 500 1 reactors.
All reactors operated with a MLSS from 8000 to 13,000 mg/1
19
the study). Hydraulic retention times of 1.7 and 1.0 days
were also evaluated. Good performance was observed during
these higher hydraulic loadings.
The 500 1 SBRs were then operated to simulate
long-term, full-scale operation of the reactor. Good removal
efficiencies were observed with reactors that had MLSSs of
5000 and 10000 mg/1. The SBR resulted in reduction of the
activated carbon requirement by 90%. Results obtained in
the 1 1 SBRs was reproduced in 12 1 and 500 1 units. The
experimental data served as the basis for the design of a
full-scale SBR-adsorption system.
Cloudy effluents (SS greater than 250 mg/1), due to
populations of dispersed and/or filamentous bacteria, were
observed several times during this study. They were caused
by excessive organic loading, short React period, low D.O.,
nutrient deficiency and accumulation of toxic compounds.
Effluent SS was less than 100 mg/1 except when the feed TOC
was higher than 3000 mg/1. The SBR performance was nearly
unchanged when the feeding was suspended on holidays and
weekends.
The integrated wastewater treatment system (biological
treatment in SBRs followed by carbon adsorption polishing)
produced a better quality effluent at lower overall cost.
20
savings of $526,000/year over 10 years was estimated to be
realized if biological pretreatment was implemented
A novel way to treat a complex landfill leachate has
been reported (Smith and Wilderer, 1986). A landfill near
Hamburg, West Germany had a leachate containing organic
solvents, phenol, several chlorinated hydrocarbons and heavy metals. A two-stage SBR treatment strategy was tested. This strategy involved treatment of the more
readily degraded compounds in a first stage SBR followed by
treatment of less concentrated, but more refractory
compounds in a second stage "fixed film SBR." A fixed film
reactor was chosen for the second stage because, due to low
concentrations of substrate, doubt existed as to whether biological sludge floes would develop and settle.
A silicone-membrane oxygenation system was used to
provide oxygen transfer to the reactors. This system was
employed to prevent the formation of gas bubbles and
thereby reduce the amount of volatile organics released by
stripping, so that more of the volatile organics would be
available to the microorganisms as substrate.
The first stage SBR was a conventional 15 1 glass biological reactor. The second stage reactor was
21
mixer and it was filled with expanded-clay aggregate.
A synthetic leachate feed was fed to the reactors which
had a soluble COD concentration of 1170 mg/1 and the phenol
content was 15 mg/1. The sludge used to seed the reactors
was obtained from a local wastewater treatment plant and
was augmented with water that had been filtered through
soil obtained from the landfill. The suspended solids of
the reactor was 3000 mg/1.
During the initial stage of operation, the reactor
performance deteriorated appreciably over the 5 weeks of
operation. The fraction of flocculant organisms in the
first stage reactor consistently decreased and the effluent
COD and suspended solids increased. These effluent
suspended solids then became trapped in the second stage
reactor. By the end of the initial seven weeks of
operation, effluent suspended solids were appearing from
the second stage reactor.
To correct these problems, a different strategy was
employed in the next phase of operation. After a React
period was completed, the normal amount of reactor volume
was decanted from the second stage reactor. The remaining
volume in the second stage reactor was placed in the first
stage reactor. The contents of the first stage reactor,
22
second stage reactor. This resulted in a decreased
hydraulic retention time for the stage one reactor to
selectively favor flocculant organisms.
This operating strategy performed well over the 70 days
of operation. Effluent quality, evaluated by measuring
soluble COD and suspended solids, steadily improved over
time. However, three weeks into this phase of the
experiment the MLVSS of the first stage reactor was noted
to have decreased to virtually zero, despite the fact that
the reactor was performing consistently well. This was
explained by the fact that the organisms in the reactor had
become trapped between the reactor wall and the silicone
tubing structure. So the first stage reactor was, in
essence, also operating as a fixed film reactor.
Bench scale studies were then performed by taking the
laboratory apparatus to the landfill site. Effluent
concentrations of COD and TSS in all reactors steadily
increased over time and were much higher than in the
initial studies. From these results, it was apparent that
none of the operating strategies investigated resulted in
stable performance of the suspended growth SBR process,
indicating that the suspended growth activated sludge
process is not a suitable method of biological treatment of
23
Studies Done On Nitrosophenol
Very little literature is available on nitrosophenol or treatment of wastewaters containing nitrosophenol. One article of particular interest to this research study
described a method of analyzing phenols in water samples by
first converting the phenols to nitrosophenol (Hassan, et
al., 1987). This method was purported to have several
advantages over the commonly used 4-aminoantipyrine method.
These advantages include a lower detection limit for
phenols (4 ug/1 as opposed to 10 ug/1) and the capability
of detecting para-substituted phenols.
The method involves converting all phenols and
substituted phenols in a water sample to their respective
nitrosophenol derivatives by the nitrosation reaction.
These reaction products are then coupled with resorcinol to
produce a chromophore whose optical absorbance can be
measured at 480 nm. The color development obeys Beer's Law
in the concentration range from 4 ug/1 to 40 ug/1.
In another reference to nitrosophenol wastewaters, a
patent has been issued (U.S. Patent # 4,391,715) concerning
an improvement on the treatment of the raw waste resulting
24 {Coates, 1983).
During the peroxide oxidation of the mother liquor,
large amounts of dark-colored foam are created which, at
treatment facilities in the U.K., have hampered the
oxidation of the wastewater. Coates (1983) has found that
this foaming is due to the presence of a stable diazonium
salt in the nitrosophenol raw wastewater. This salt is
believed to cause the foaming by forming a co-polymer with
other monomer units in the liquor, such as the phenolic
compounds, and at the same time release nitrogen which
causes the polymer to float up to the foam.
The foaming can be prevented by reacting the salt with
sodium sulfite prior to chemical treatment of the raw
waste. Treatment of the raw waste with sulfite under
preferred conditions has been found to substantially
decrease the toxicity of the liquor by breaking down the
phenolic compounds.
Sims (1981) has reported the successful treatment of a
nitrosophenol wastewater using chemical oxidation. In this
process a pharmaceutical wastewater containing 6,000 mg/1
of nitrosophenol was oxidized using hydrogen peroxide and
iron. The resulting effluent was found to consistently
25
Studies Done on Phenol Degradation
Problems created in receiving waters by the presence of phenols in effluents include toxicity to aquatic life,
increased BOD, and taste and odor problems in water subsequently used for potable purposes (Sims, 1981).
Methods of treating phenolic effluents include
biological oxidation, chemical treatment, incineration, and
physical treatment, such as carbon adsorption. Biological
oxidation is the method commonly applied to large volumes
of biodegradable phenolic effluents.
Chemical oxidants which are effective for the oxidation
of phenols are hydrogen peroxide, chlorine dioxide, ozone
and potassium permanganate. Of these chemical methods, hydrogen peroxide is the most cost effective method of
treating effluents containing phenols.
When phenol or phenolic compounds are treated by
biological processes, an important consideration that must
be accounted for is substrate inhibition. Substrate
inhibition occurs as a result of the substrate binding with
the enzyme-substrate complex as well as the free enzyme
enzyme-26
substrate-substrate complex is formed which cannot undergo further reaction to yield the product.
With a nontoxic substrate, a higher substrate
concentration results in a higher specific growth rate. With a toxic substrate, an increase in substrate
concentration results in increased growth rate over a much
more limited range. Beyond a critical substrate
concentration, the toxicity of the substrate causes a
decrease in growth rate, so that the peak specific growth
rate is below the theoretical maximum growth rate for the
system.
Some debate exists as to whether inhibition exists when
a culture has been acclimated to phenol. Rozich and Gaudy
(1984) have concluded that in the great majority of cases,
with thoroughly acclimated populations, definite evidence was found that an inhibitory function more accurately depicted the behavior of a system treating phenol.
The kinetic relationship for biological treatment of non-inhibitory substrates is described by the Monod
equation:
u = (Umax * S)/(Ks + S)
27
umax = maximum specific growth rate, 1/time,
S = soluble substrate concentration, mg/1,
Ks = saturation constant, mg/1.
For inhibitory substrates, the Haldane relationship has been found to most accurately describe the kinetics of
biodegradation,
u = (umax * S)/(Ks + S +(S"2/Ki))
where Ki = inhibition constant, mg/1.
Rozich and Gaudy (1985) have reported the values of these kinetic constants which were determined with over 100 batch
growth curves. These values are: umax = 0.194/hr, Ks = 48
mg phenol/1, and Ki = 62 mg phenol/1. In addition, the
biological decay constant, b, was determined to be
0.0195/hr.
Loading rates successfully achieved when treating
phenol have been reported by Khararjian and Smith (1979).
Using aerated lagoons and activated sludge to treat coke oven wastes, loading rates up to 0.86 g phenol/g MLSS-d
were achieved. At this high loading rate, excessive
28 and multi-stage activated sludge processes for treatment of high strength phenolic wastes (phenol concentration
averaged 3270 mg/1), bench scale studies showed that effluent concentrations of less than 0.1 mg/1 could be achieved 40% of the time at loading rates of 0.1 to 0.3 g
phenol/g MLSS-d.
Rozich and Gaudy (1985) have studied the effect of
shock loading on a phenol-acclimated activated sludge
culture. In this study a bench scale activated sludge system was operated at an influent concentration of 500
mg/1. When the influent concentration was instantaneously increased to 1000 mg/1, the system adjusted very well. The
system was operated for 11 days at 1000 mg/1 and then the influent concentration was instantaneously increased to
2000 mg/1. Six days after the shock was administered, the
system had not achieved steady state. An increase in
diispersed organisms was evident soon after the increase to 2000 mg/1. By the eighth day, washout of the activated
sludge had begun to occur and the experiment was stopped.
This experiment was then repeated and after 3 days of operation at 2000 mg/1, washout had occurred.
29
concentration of phenol determines the extent of the pH drop during the degradation. The minimum pH measured was found to coincide with the point at which the phenol had been exhausted, which is due to the production of organic acids. After exhaustion of the phenol, the pH was noted to rise again, but never back to its original pH before being
fed phenol.
Uncoupling
A phenomenon that may or may not be applicable to the degradation of nitrosophenol production wastewater is uncoupling (Okey and Stensel, 1989). The uncoupling of
oxidative phosphorylation causes substantial oxygen use without substrate assimilation. The term also refers to
the uncoupling of the energy-yielding electron transport sequence from the energy-requiring formation of adenosine triphosphate (ATP).
The production of ATP regulates cell respiration rate through the cytochrome system. When uncoupled, regulation
is lost and the cell respiration rate continues to increase until intracellular reserves are exhausted. Symptoms of uncoupling are increased rate of respiration, limited or no
30
Any refractory alcohol with roughly the same dimensions as phenol appears to be capable of uncoupling.
4-Nitrophenol has been found to be a strong uncoupler (Clowes
and Krahl, 1936) and nitrosophenol has the classic
characteristics of an uncoupler. Uncouplers are generally alcohols roughly the size of the benzene ring in overall
dimension, and are substituted with materials that normally impede metabolism or which incidentally increase the acid
strength of the molecule.
Mitchell recognized that certain lipid soluble weak acids can cross a membrane in either the ionized form or the intact form (Mitchell, 1963). When crossing in the intact (non-ionized) form, they transport a proton which is
then promptly released in the alkaline environment to react
with a hydroxyl group. In the presence of proton-conducting molecules (uncouplers), the biosystem is
uncoupled. More substrate is utilized to augment the now limited ATP production and the cell literally runs down.
Unexpected findings in biodegradation research
involving chlorinated and nitrated phenols may have been due to uncoupling. These findings include low cell yield and inhibition at high concentrations which may or may not
be related to uncoupling. Clearly, the halogenated and
31 activated sludge which apparently experiences only the uncoupling phenomenon even when acclimated to the carbon skeleton.
The response of activated sludge to the presence of uncouplers falls into one or more of the four categories depending on the relative concentration (concentration
ratio) of uncouplers and sludge, the chemical nature of the uncoupler and the presence of usable substrates. These four categories are: increased rate of endogenous
III. Experiaental Methods
Several parameters were monitored during operation of the batch reactors. These included Chemical Oxygen Demand (COD), phenol concentration, Mixed Liquor Suspended Solids
(MLSS), Mixed Liquor Volatile Suspended Solids (MLVSS),
nitrate nitrogen (N03-N), nitrite nitrogen (N02-N), and
phoshporus. High Performance Liquid Chromotography (HPLC)
was also attempted to identify the extent of nitrosophenol
degradation. In addition, the oxygen uptake rate was
measured in a number of experiments to gauge the metabolism
of the mixed liquor.
The COD, phenol, nitrate nitrogen, nitrite nitrogen, and phosphorus tests were all based on formation of colored species and were measured with a Bausch & Lomb Spectronic
70 spectrophotometer.
Chemical Oxygen Demand
The chemical oxygen demand of an industrial wastewater
is often used as a measure of degradation of a mixture of
33
oxidation of the organic compounds in a wastewater to
carbon dioxide and water, and the results are expressed on a mass basis in terms of the amount of oxygen required if
it were the terminal electron acceptor.
In this study COD was measured using the Hach COD Reactor (Model #45600) with high range COD vials, which measured COD in the range 0 - 1500 mg/1. In the Hach
method, test reagents are pre-mixed in vials. Reagents in the vial include potassium dichromate, silver sulfate,
concentrated sulfuric acid, and mercuric sulfate. Silver sulfate is added as a catalyst and mercuric sulfate is
added to suppress interference from chloride ions. (Interference from chloride occurs at a chloride ion concentration of greater than 2000 mg/1. The samples analyzed in this study had only traces of chloride in them.) Potassium dichromate is the oxidizing agent and oxidizes the available carbon and hydrogen to carbon dioxide and water. The production of reduced chromium
Cr(III) as a result of the oxidation is proportional to the COD of the sample. This method is approved by the EPA
(Federal Register, 1984).
Two ml of a sample or an aliquot of the sample is
#
34
C for two hours. After the two hour digestion period and a one hour cool down, the absorbance of the solutions in the vials are measured.
A standard curve was prepared for each lot of vials
received. Potassium hydrogen phthalate was used to prepare a 1500 mg/1 COD solution. In this study, 4 lots (150 vials per lot) were received from Hach. A typical COD Standard Curve is shown in Figure 1. As can be seen from Table 1 on the same page, correlations of the standard curves was
always good. Initially all COD measurements were done in duplicate and the standard deviations were always found to be less than 5% of the mean. As a result, single
measurements were used subsequently for routine monitoring of COD.
Phenol Concentrations
Total Recoverable Phenolics were measured using EPA
Method 420.1 (Federal Register, 1984). In this procedure,
phenol reacts with 4-aminoantipyrine in the presence of potassium ferricyanide to form a stable reddish brown
colored antipyrine dye. The amount of color produced is a function of the concentration of phenolic material. This
method cannot measure para-substituted phenols, so the
35
o
0
c
0
0
<
Regression Line--->
COO Concentration, g/l
Q COO Measurements
Figure 1: Typical COD Standard Curve. Measurements were taken with vials
received 26 September 1989. r"2 - 0.9999
Date
Vials
Received r-2 6Feb 0.9997 28 Mar 0.9998 22 May 0.9999
36
nitrosophenol standard confirmed that nitrosophenol did not
react with the aminoantipyrine.
A standard curve was prepared for each batch of
4-aminoantipyrine and potassium ferricyanide made. A 10 ug/1 phenol solution was freshly prepared for each standard
curve by dissolving 1 ml of liquid phenol in 1 liter of distilled water. This solution was then diluted 100:1 to
give a 10 ug/1 standard. Though the EPA method calls for
making a standard curve in the range of 0 - 1 mg/1, the standard curves were found to be linear up to 0-10 mg/1. The standard curve was then broken up into a high and low
range. A typical standard curve for the phenol test is
shown in Figure 2.
The analytical method requires a distillation to remove
interfering materials that may be present in a sample. Since the phenol test was used in this study as a daily measure of reactor performance, it was deemed infeasible to perform such a large number of distillations. The method of standard additions was performed on the reactor effluent to determine if interfering species were present to
confound the data. The results of the standard additions test is also shown in Figure 2. The slope of the standard
addition curve (0.151) is almost equal to the slope of the
37
E
c o
9
O
c 0 0
<
1.50- 1.40- 1.30-
1.10-1.00- Std. Add tions Line
0.70-Standard Curve
0.60-
0.40- -0.10-
-0.20-D Std Cunre Points
Phenol Concentration, mg/l
+ Std. Addftions
Figure 2: Typical Phenol Standard Curve Shown V\Ath Standard Additions Test. Standard curve measurements are for High Range values (1-10 mg/l)
taken on 3 March 1989. Concentration measured in standard addition sample: 0.59 mg/l. X intercept: 0.60 mg/l.
Date
Low
Range r"2
High 1
Range r-2 29 Aug 0.9954 0.9962
1 Dec 0.9997 0.9969
3 Mar 0.9999 0.9987 26 Apr 0.9998
0.9998 1
38
the concentration read from the x-intercept of the standard addition curve. Consequently, there were very few, if any, interfering compounds in the reactor effluent.
All phenol concentrations measured on reactor effluents were performed in duplicate. Typical standard deviations
were less than 1% of the mean.
Mixed Liquor Suspended Solids (MLSS)
Mixed liquor suspended solids were measured using EPA
Method 160.2, Non-Filterable Residue (Federal Register, 1984). A known volume of mixed liquor was filtered through
glass fiber filters that had been pre-rinsed with distilled water, placed in aluminum weighing pans, dried in a drying oven at 103 degrees C, and pre-weighed. After filtering the mixed liquor, the filters were again rinsed with distilled water to remove any filterable solids and the
filters were again placed in the drying oven. All
suspended solids filters were allowed to dry for at least one day before the first weight was taken. Each filter was weighed three times on consecutive days to determine the
suspended solids. The difference in the filter's weight before and after filtering the mixed liquor was divided by
the volume of mixed liquor filtered to determine the MLSS.
39
liquors were done in triplicate. Standard deviations were
found to be less than 5% of the mean.
Mixed Liquor Volatile Suspended Solids (MLVSS)
Volatile suspended solids were measured using EPA
Method 160.4, Volatile Residue (Federal Register, 1984).
After the MLSS was determined as described in the previous
section, the filters were placed in a muffle furnace and
heated to a temperature of 450 - 500 degrees C for at least
two hours. These filters were then placed back into the
drying oven at 103 degrees C and allowed to cool overnight.
Three daily weights were also taken on the volatile
suspended solids. The weights of the filters from the
muffle furnace were subtracted from the MLSS weight to give
the amount of volatile solids in the mixed liquor.
Standard deviations for volatile suspended solids were also less than 5%. Typically, mixed liquor suspended solids were found to be greater than 85% volatile, ranging from
82% to 97%.
Nitrate Nitrogen (N03-N)
The raw waste received from Sandoz was found to have
high levels of nitrate (1150 mg/1 N03-N). This high
nitrate concentration is due to the oxidation of excess
; ͣ 40
Initially, the concentration of nitrate nitrogen was
measured with an ion specific electrode (Orion Research
Model 930700). However, interfering species in the effluent matrix, such as sulfate, caused inaccurate readings when verified with the method of standard
additions. Consequently, an alternative method of nitrate
analysis was sought.
Approximate concentrations of nitrate nitrogen were
measured using the Hach Cadmium Reduction Method. Pre¬ packaged NitraVer 5 nitrate reagent powder pillows were
added to 25 ml dilutions of samples. The samples were
shaken for one minute, allowed to react for 5-15 minutes,
and absorbance was measured.
This method of analysis is a modification of the
cadmium reduction method using gentisic acid in place of 1-naphthylamine. Cadmium metal in the pillows reduces
nitrates to nitrites. The nitrites then react in an acidic medium with sulfanilic acid to form an intermediate
diazonium salt, which when coupled with gentisic acid,
forms an amber colored compound. Color intensity of the compound is in direct proportion to the nitrate and nitrite concentrations of the water sample.
The NitraVer 5 powder pillows can be used to measure
nitrate nitrogen in a "high" range (0-30 mg/1 N03-N) and
absorbance of the samples at 500 and 400 nm respectively.
Interferences can be caused by the presence of strong
oxidizing and reducing agents. Ferric ions cause false
positive results. Chloride concentrations above 100 mg/1
as CI- will cause false negative results. None of these
interfering species were believed to be present in
concentrations high enough to affect the results.
All nitrate nitrogen tests were performed using the
same lot of powder pillows. The standard curve for the
high range method is shown in Figure 3. The standard curve
for the medium range method is shown in Figure 4. All
nitrate nitrogen tests were performed in duplicates and the
standard deviations were found to be less than 5% of the
mean. Checks of the veracity of the nitrate nitrogen tests
were performed using the method of standard additions. The
results of these tests are included in the calibration
curve figures. As can be seen from Figure 3, some
interferences were present in the mixed liquor matrix,
which caused the slopes and actual concentrations measured
in the standard additions curve at high range to differ
from those in the standard curve. As shown in Figure 4,
interferences were considerably less of a problem at higher
42
o o
9 0 c 0
u
0
a
< 1.30 1.20
1.10 1.00
a90 aso
0.70 0.60 0.50
0.40 0.30 0.20
0.10
0.00
-0.10 -20
Standard Curve —>/
<— Standard Additions
Line
0
"T"
20 40
1---1---1---r-60 80 100
Nitrate Nrtrogen Cone, mg/l (N03-N)
Std. Curve Read'mqs + Std. Additions
Figure 3: Nitrate Nitrogen Standard Curve (High Range) Shown With
Standard Additions Test. Concentration measured in sample with no nitrate
standard added: 9.0 mg/l. Actual concentration: 11.4 mg/l. Correlation
coefficient of Standard Curve: 0.9940. Correlation coefficient of
43
0.8000
0.7000-
0.6000-£
0.5000-o o
9 0 c 0 0
«
< 0.4000
0.3000
a20oo
0.1000
0.0000
-0.1000
1 / I
Standard Additions Curve —>/
y/ /D <---Standard Curve
r
1
1 1 1 I
ͣ
'H
Nitrate Mtrogen Cone, mg/1 (N03-N)
a Std. Curve Reodinqs + Std. AddHbns
Figure 4: Nitrate Nitrogen Standard Curve (Mediunn Range) Shown With
Standard Additions Test. Concentration measured in standard addition
sampie: 1.52 mg/l. Actual concentration: 1.50 mg/i. Correlation
coefficient of Standard Curve: 0.9980. Correlation coefficient of
44
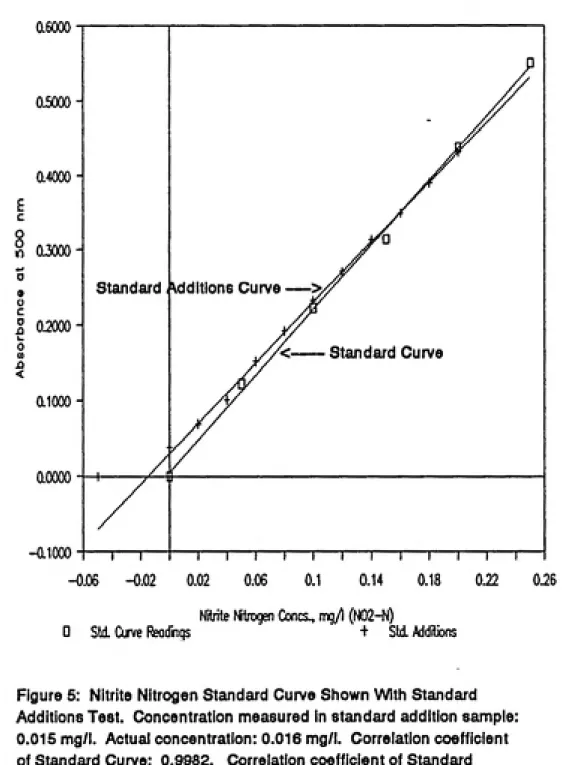
Nitrite Nitrogen (N02-N)
Nitrites were present in the raw waste due to
unoxidized excess sodium nitrite and possibly as a result
of degradation of nitrosophenol. Nitrites were measured by
the Hach Diazotization Method. NitriVer 3 nitrite reagent
powder pillows were added to 25 ml dilutions of samples.
Samples were then shaken for one minute, allowed to react
for 10 - 15 minutes and the absorbance was measured at 500
nm. The detection level of this test is 0 - 0.2 mg/1
N02-N. In this test, nitrite ions react with sulfanilic acid
to form an intermediate diazonium salt. This salt reacts
with chromotropic acid to produce a red-orange complex
directly proportional to the amount of nitrite nitrogen
present.
All nitrite nitrogen measurements taken during this
study were from one lot of Hach Nitriver 3 reagent pillows.
A standard curve was prepared using a 0.2 mg/1 nitrite
nitrogen standard solution. This standard curve is shown
in Figure 5 along with a test for interferences by the
method of standard additions. As can be seen, there was
slight, if any, interference caused by the effluent matrix.
Phosphate
Phosphorus was added to the raw waste and synthetic
45
0.6000
0.5000-0.4000 E
c
o
° 0.3000
o
E 0.2000
0
«
< 0.1000
0.0000
-0.1000
standard Additions Curve
Standard Curve
-Oj06 -0.02 0.02 0.06 0.1 0.14 0.18 0.22 0.26
Nitrite NKrogen Cones., mq/l (N02-N)
D Sti Curve ladings + Std. Additions
Figure 5: Nitrite Nitrogen Standard Curve Shown With Standard
Additions Test. Concentration measured in standard addition sample:
0.015 mg/l. Actual concentration: 0.016 mg/l. Correlation coefficient
of Standard Curve: 0.9982. Correlation coefficient of Standard
46
was added as a phosphate monobasic and dibasic buffer (O.IM
KH2P04/K2HP04). The concentration of phosphate in the
effluent was monitored to determine the amount of phosphate
required to achieve biodegradation.
Phosphate was measured by the Hach Ascorbic Acid Method. The first step of this analytical procedure
involves reaction of orthophosphate with molybdate in acid
solution to form a yellow-colored phosphomolybdate complex.
The phosphomolybdate complex is then reduced by ascorbic
acid, causing a characteristic molybdenum blue species.
All phosphate measurements were performed using one lot
of PhosVer 3 powder pillows. A standard curve for this lot
of reagent pillows is shown in Figure 6. Measurements of
reactor phosphate concentrations were all done in
duplicates. Standard deviations were found to be less than
5% of the mean. A test for interferences was done by the
method of standard additions. This test is also shown in
Figure 6. Again, some interfering species were present in
the effluent matrix. However, if standard curve values
above 1.5 mg/1 P are omitted, the slopes of the standard
curve and standard additions curve are nearly parallel. Of
84 phosphate measurements taken during this study, only 2
samples had phosphate concentrations greater than 1.5 mg/1
47
E
c
o
o
^ «
o
c 0 0
(0
Si <
standard Add tions Curve
Standard Curve
-1 0 1
Phosphote Concentration, mq/l PCM
D Std. Orve l^dinqs + Std. Additions
Figure 6: Phosphate Standard Curve Shown With Standard Additions Test.
Concentration measured in standard addition sample: 0.388 mg/l. Actual
concentration: 0.438 mg/l. Correlation coefficient of Standard Curve:
- - . 48
High Performance Liquid Chromotography (HPLC)
Limited HPLC data was collected during this study due to many equipment problems and the limited amount of time that a post-doctoral student was available to work with the HPLC unit. HPLC was performed on an ISCO HPLC (Model 2350 pump and 2360 gradient programmer, with UV detection at 254
nm) using a C analytical reversed phase column (Supelcosil
8
LC-8, 5 um packing, 15 cm X 0.46 cm). Gradient elution
consisted of methanol:H20 at 35:65 (initial) to 100:0 over
20 minutes, then returned to 35:65 over 5 min., at a flow
rate of 1.5 ml/min. Calibration curves were prepared for
phenol, nitrosophenol, and 4-nitrophenol. Retention times were 1.0 to 1.5 min. for nitrosophenol, 1.9 to 2.2 min. for
4-nitrophenol and 2.7 to 3.3 min. for phenol.
Nitrosophenol standards gave a second peak at about 2.2 min. Based on the known retention time of 4-nitrophenol
and the known presence of 4-nitrophenol as a by-product of
nitrosophenol synthesis, this second peak was assumed to