Wildemuth
This paper assumes different types of people prefer different online experiences and proposes a research study to determine whether there is a match between competing user interface design patterns and individual differences. In this study, subjects responded to two online questionnaires: social design pattern preference and entrepreneurial attitude orientation. First they answered the Entrepreneur Attitude Orientation (EAO)
questionnaire consisting of 75 questions and four subscales: Achievement, Innovation, Personal Control, and Self-Esteem. Second, they answered a social design pattern questionnaire. The data was then used to examine correlations between entrepreneurial attitude orientation and design pattern preferences. No statistically significant
relationships were found. However, one intriguing U-shaped pattern emerged between an EAO subscale (Personal Control) and social design pattern preference.
Headings:
Cognition/Surveys Web Sites/Design Design Patterns
Entrepreneurial Attitude Social Networks
by
David A. Iberkleid
A Master’s paper submitted to the faculty of the School of Information and Library Science of the University of North Carolina at Chapel Hill
in partial fulfillment of the requirements for the degree of Master of Science in
Information Science.
Chapel Hill, North Carolina July 2010
Approved by
___________________________
TABLE OF CONTENTS
LIST OF FIGURES… page 2
ACKNOWLEDGEMNTS… page 3
INTRODUCTION… page 4
LITERATURE REVIEW… page 12
METHODS… page 21
RESULTS… page 33
DISCUSSION… page 39
CONCLUSION… page 43
REFERENCES… page 45
APPENDICES… page 49
Appendix A: Yahoo! Social Design Patterns… page 50 Appendix B: Entrepreneurial Attitude Orientation (EAO) Scale with subscales and
attitude components identified… page 52
Appendix C: Email Invitations… page 56
Appendix D: Consent Form… page 62
Appendix E: Survey Questions… page 63
Appendix F: EAO Scoring… page 68
LIST OF FIGURES
Figure 1: The 10-point rating scale used in the EAO questionnaire Figure 2: SPDQ (preference) Distribution
LIST OF TABLES
Table 2: Highest Education Levels Achieved Table 3: EAO Scores by Subscale
Table 4: Correlations between EAO Subscales and Design Pattern Preferences Table 5: Groupings Based on EAO Subscale Scores
ACKNOWLEDGEMENTS
I would like to thank my advisor, Barbara Wildemuth, for her remarkable dedication and for her willingness to guide me through this project; Diane Kelly and Laura Sheble for helping me polish my research plan; Chiyoung Oh, Ketan Palshikar, and Jessica Weber
for their honest feedback and thorough proof reading; and Odum Institute’s Jessica Pearlman at the for all her outstanding help. I would also like to thank my parents, Wolf and Regina Iberkleid, and my dear Laura Joseph for their support. This study would have
INTRODUCTION
Two converging stories motivate this study. One is the story of the experienced web user and the other is the story of the online start-up on a shoe-string. Both are oriented toward improving the design of web applications for a particular audience.
The Story of the Experienced Web User
Imagine a user, Ulysses, who has been using the web for 15 years. Throughout this time, Ulysses has fed the cloud—the aggregate of all websites and web databases—a long series of discrete data, filling out a number of political polls, rating movies, and sharing information with others. The cloud has come to “know” Ulysses quite well, and continues to learn about him as time goes by. Should all this data be centralized,
collaborating cloud services could calculate how similar Ulysses is to other users. Based on the behavior exhibited by others like him, such a calculation could better advise web designers about Ulysses’ preferences, and better guide advertisers about Ulysses' next click.
book reviews on Amazon.com or blog entries requires human assistance and thus requires more resources to carry it out.
Such an approach does not present a significant economic advantage over the time-intense immersion into a foreign niche culture that characterizes ethnographic research. Design teams use ethnographic research to gain a deep understanding of a particular setting and to create personas and scenarios that depict that setting. However, as users’ digital identities grow, the burden on designers to create these research products should lessen or at least be less costly. A cheaper alternative is to generate statistical analyses of discrete data (such as traces of web user behaviors). The prevalence of online questionnaires like personality tests can be added to and enlighten the analysis of online behavior data. Given the advantages in efficiency and affordability of pairing
questionnaires and automatically-captured data on user behavior, there is good reason to believe that low-budget design teams would prefer computational analysis of such data instead of costly, real-life ethnographic research or content analysis of naturalistic online text. The proposed approach may not provide as rich a description of a user as the
unstructured interviews and direct observation more often used in ethnographic research. However, it may be more feasible to apply on a broad scale.
The Story of the Online Start-Up
entrepreneurs. The design team has many intuitive ideas but limited resources. Like most companies, OP will require more resources (time and effort) to draft and iterate their design. This process is the well-known life cycle of website building.
Being that developers at such companies want to serve the needs of a particular group of users, they are likely to employ User-Centered Design (UCD). UCD is an approach to interactive systems development that stresses, among other things, an early focus on users, their active involvement in the design process, and their feedback. In this case, the target group of users is likely to have previously interacted with the web,
leaving traces of those interactions. If developers could access this vast amount of data about their target audience's online behavior, their UCD process could be well under way even before a single user is asked for any amount of feedback.
MyType1, for instance, offers online quizzes that test for individual differences and currently boasts nearly 5,000 Facebook fans. If there is a link between users’ online preferences and their individual differences, web designers could use the data collected by such companies to create personas. This study set out to find such a link. It focused on entrepreneurial attitude as an individual characteristic. A hypothetical design question was used: what emerging design in social interaction do highly entrepreneurial
individuals prefer? Through subsequent data analysis, this study then rated user interface design patterns based on how likely they are to be attractive to future OP customers: innovative entrepreneurs. Overall, this study aims find out if a recommendation can be made to OP’s design team, should a link be found between attitude and preference using only online testing.
1
Defining Entrepreneur
Because there are several traits associated with entrepreneurship, a collection of themes is often used to illustrate what is meant by entrepreneurship. The creators of the Entrepreneurial Attitude Orientation (EAO) scale were aware of recurring themes in definitions of entrepreneurs, such as innovation, organization creation, creating value, profit or nonprofit, growth, uniqueness, and owner-manager. However, they chose to focus on just two, organization creation and innovation, as representative characteristics because they did not need an exhaustive list but rather a small number of traits that could effectively predict entrepreneurship. The final definition they chose and to which this study adheres is simple.
“The operational definition of a start-up entrepreneur used here was an individual who has started more than one business, the last one being within five years, using some type of innovation.” (Robinson, Stimpson, Huefner, & Hunt, 1991)
For the purpose of this study, high scores on the EAO will be understood as an indication of high entrepreneurial potential among subjects.
Defining Design Patterns
Erich Gamma, Richard Helm, Ralph Johnson and John Vlissides, often referred to as the Gang of Four in the software engineering community2, defined a DP to be a "description of communicating objects and classes that are customized to solve a general design
2
See the website of Cunningham & Cunningham, Inc. for more information on the origin of
problem in a particular context" (Gamma et al., 1995, p. 3). For example, Yahoo! documented an “invite” design pattern. It is one of many design patterns for “social engagement.” It comes into play when a user is prompted to invite all or some of his/her contacts to try a service. Consider the case when the prompt appears as soon as the user has signed-up for the service—before even trying it. In reaction to this prompt, one can imagine a range of user behavior from ignoring it to impulsively inviting all of one’s contacts. This decision seems largely based on how one values online privacy, personal information, and ultimately, friendship and acquaintances. These values could be the result of habit, error, or potentially, personality or attitude. If the design team could anticipate the behavioral tendencies of its audience, it could better deploy such a pattern, placing it, perhaps, at a point in the sign-up or usage process where it will be ignored by the least number of users.
There are several user interface DP inventories available online, such as
Study Purpose and Context
This study focused on entrepreneurial attitude among its subjects because OP targets an audience of innovative entrepreneurs. The EAO scale is one instrument thought to predict their behavior but there are others that, for example, assess creativity (Cropley, 2000), like the 24-item Basadur Preference Scale (Basadur & Hausdorf, 1996), which could also have been used in this study.
While it is focused on the needs of OP, there are many more companies/sites this study could impact. Many companies are now trying to attract entrepreneurs and offering services to them. These services help entrepreneurs work on their projects and show those projects to investors. According to Jeffrey Sohl, director of the Center for Venture Research at the University of New Hampshire, there are an estimated 260,500 active start-up investors in the United States (Sohl, 2008).
These sites’ design patterns are the elements that communicate the purpose of their services to their audience and shape the use of that site. Online social networking sites are an emerging “Web 2.0” internet service technology where users are content creators. Therefore such sites are ideal places for entrepreneurs to build a reputation, showcase their projects, and receive feedback. Site developers use design patterns to support these activities. The design patterns used in these sites may vary slightly to emphasize peer-to-peer communication (e.g., Facebook), help users promote their own music (e.g., MySpace), or help them manage their professional connections (e.g., LinkedIn).
Brand Network operates several sites to help people with their entrepreneurial endeavors, Kickstarter helps fund new ideas, Quirky takes their users' creations from sketch to the market, Bulbstorm helps seek opportunities for its users' ideas, and You Noodle predicts the success of an entrepreneur’s start-up. Angelsoft and Kiva are two major social network sites helping entrepreneurs seek financing. Angelsoft connects entrepreneurs to angel investors. These investors are "generally wealthy people seeking promising start-ups that are too small to attract the attention of venture capitalists" (Sohl, 2008). Kiva connects entrepreneurs from around the world to micro-lenders. Because of their informal approach to lending, micro-lenders are not regarded as angel investors but they can be seen as the “Long Tail” (Anderson, 2008) of a large population of investors.
OP is trying to differentiate itself from all the companies discussed above. Based in Durham, NC, OP operates a social networking site aiming to serve the needs of a highly innovative and entrepreneurial audience. However, because its current
membership is small, a study that would ask only its members for feedback may not be broad enough. Furthermore, its members have already signed-on and have thus already been attracted by OP’s services.
To attract more users, OP would like to be perceived as useful to more
blog). Yet, OP has no evidence that collaboration, for example, is what entrepreneurs are looking for. They may be more attracted by a competitive environment, for instance.
Research Question and Hypotheses
LITERATURE REVIEW
This chapter will provide a brief summary of research concerning the relationship between the appeal of technology and psychological characteristics. The research comes from a wide array of sources and contexts including the military, education, psychology, and computer science. Strengths and weaknesses of various studies will be discussed to show a gap in the literature that this study aims to fill.
HCI Research and Individual Differences
Human-Computer Interaction (HCI) research is concerned with fitting and adapting systems for human use (Hewett, Baecker, Card, Gasen, Mantei, Perlman, Strong, & Verplank, 1992, p. 19). Outside the military, users in the marketplace are consumers with the power of choice. When a user is presented with a set of new systems or with the option to keep or abandon an old system, the user will make a judgment on the usefulness of each system before switching (Smith & Mosier, 1986). Many of the dimensions of this sort of technological selection and tailoring can evolve during design or usage, by designers, users, or even by the system itself (Hewett, Baecker, Card, Gasen, Mantei, Perlman, Strong, & Verplank, 1992, p. 19). Thus, HCI research and software designers are concerned with finding ways to adapt system characteristics to user
to this end. Because human diversity is vast, as interface design grows and matures, HCI researchers seek more and better ways to ways to measure psychological traits that may inform interface design.
A good example is a study that sought individual differences among users that had rated search engine usability. Four types of individual differences were tested: study approaches, cognitive features, demographic features, and perceptions of and preferred approaches to Web-based information seeking. Comparing two types of subjects, wholist and analytic, showed that only the first would change search strategies as task complexity increased. Subjects’ expectations of the quality of the results and other such factors particular to search, affected changes in strategy (Ford, Miller, & Moss, 2005). Because my study does not involve performing tasks, contextual factors will not be addressed. However, Ford’s study shows that personal characteristics, tested before a task is performed, do affect subjects’ performance once that task is given. Hence, I have good reason to believe that individual differences will affect subjects’ design pattern
preferences, which act as an anticipation of a task.
The Challenge of Matching Mind and Design
In order to pursue the HCI goal to map personal characteristics to preference of different design patterns, we must ask: how do individual cognitive and affective differences affect individual perceptions of usefulness of user interface design patterns?
audience. For many developers and web service companies, the issue is not in how to build a general-purpose website but how to tailor it to their intended audience. Websites that already have an audience may analyze web traffic on their site or conduct a usability test in order to improve the site’s interface. For those who lack an audience, the
challenge of tailoring a website is greater. However, regardless of the stage of
development or length of time present on the web, websites could make better use of user data in order to improve their interfaces. Some emerging sources of user data include users' email content, online social behavior, and search term history. Website developers could use all these sources to customize their interface to specific users or user groups with similar traits.
Overview of Current Approaches
Automatic profiling is used in Recommender Systems (RS) (Resnick, 1997), to help a system adapt to users' needs remotely, while profiling users manually is more often used in software development or usability testing. Both automatic and hand-made user profiling are relevant to the challenge of matching users to interfaces. The first
2007). RS systems that use psychological profiling could be used in Social Matching Systems (Terveen & McDonald, 2005).
On the other hand, human-driven interface development is a process where intuition and empathy are often leveraged to make design decisions. Personas, for example, are one common artifact produced by designers to represent their audience (Anderson, McRee, & Wilson, p. 196). Such personas often include details about the users’ psychological characteristics such as the root of one’s motivations: for example, convenience versus altruism.
When users are available to interact with, software designers may employ Participatory Design, a method that goes beyond just personas and deliberately includes potential users in the design process, from the beginning to the end (Weinberg &
Stephen, 2002). The issue of matching user preferences to variation in the interface can also be addressed by software-shaping workshops where users are given the tools to customize the interface (Costabile, Piccinno, Fogli, & Marcante, 2006). However, not all system design efforts can afford to include such tools.
Research in Individual Differences and User Interface Design
In psychology, openness, conscientiousness, extraversion, agreeableness, and neuroticism comprise the big five traits of personality. It was demonstrated that, when recommending humans to other humans -- in this case, a presidential candidate to test subjects -- these five personality traits were exceptionally good predictors of people's presidential choices (Nunes et al., 2008). Although this study suggests that an RS could match people to other people in the same way they would have done so themselves, it is not clear whether it could recommend an interface. The same personality inventory and a test of motivation towards something desirable or undesirable were used in an
exploratory study to predict users' preference of software skins (the graphical look and feel of an application). Unfortunately, the personality traits and scales proved to be too broad and compromised the strength of the correlations (Brinkman & Fine, 2005). Furthermore, because the skins were deconstructed by the testers and placed into
categories such as scary or calm based on the skin theme and color, this study introduces social norms not likely present in matching users to the more functional aspects of an interface that indicate usefulness rather than hedonic appeal. An earlier study that simply tested users on a scale from introversion to extroversion and their preference for interface color and shape provides some support for predicting this preference (Karsvall, 2002). However, the sample size was only 24 subjects and was highly skewed on the side of extroversion. Furthermore, this study also involved social norms since the interfaces tested were designed to attract either introverts, assuming they would prefer a more modest design, or extroverts, assuming they would prefer a flashier one.
usefulness of personalized online services (Liang et al., 2009). Their study was limited to services found in online bookstores, which are known to leverage users' searches and clicks to make personalized recommendations on content—an advantage that few websites enjoy. This study limited its observation of personality characteristics to emotional responses. But in another study, rational choices were considered in addition to three major personality traits observed in marketing research: need for cognition (being naturally driven to seek and process high amounts of information), variety seeking, and need for uniqueness. In that study, researchers found that personality traits moderate users' preferences for personalized content (Ho et al., 2008). Although Ho et al. studied content rather than design patterns and leveraged previous usage in order to generate personalized content, the results point out the significant impact of personal
characteristics on users' perceptions of usefulness, especially for those with a high need for cognition and uniqueness.
Technology Readiness (TR) is a multidimensional construct of psychographic attributes (relating to personality, values, attitudes, interests, or lifestyles) that helps segment online customers in terms of their underlying positive and negative beliefs about technology, including optimism, innovativeness, discomfort, and insecurity. Controlling for age, gender and prior web experience, the effect of these four dimensions was
personality characteristics influence perceptions of interface design. Unfortunately, the subjects did not interact with an interface. Instead, they were asked to rate usability requirements such as ease-of-use, based on Microsoft usability guidelines. One drawback in using usability guidelines is that they please the majority of users, not the niche. Usability guidelines are considered a particular instance of design pattern. Therefore, another drawback of using guidelines is that they carry a bias towards a particular design.
Like TR, the Technology Acceptance Model also attempts to explain how users come to accept a technology, although more generally, by proposing two major factors: users' perceptions of the technology's ease-of-use (PEOU) and usefulness (PU) (Davis, 1989). Six determinants of such perceptions -- computer self-efficacy, facilitating conditions, intrinsic motivation (computer playfulness), emotion (level of computer anxiety), objective usability, and perceived enjoyment -- were considered (Venkatesh, 2000). This study does not link individual differences to differences in the interface. The reason is that the interfaces were drastically different and each was tested with
completely different users, in different settings. There was no systematic variation of the interfaces, which included an interactive online help desk system, a multimedia system for property management, and a company payroll application. Another relevant
perspective is taken in a study that considered culture's moderating effect on technology acceptance (Srite & Karahanna, 2006). The cultural dimension most relevant to my study was individualism versus collectivism. However, it had no significant effect as a
need to be conceptualized in a more distinguishing manner to capture the nuances of the social environment” (Srite & Karahanna, 2006, p. 697).
Summary
This review covered the research done to match human diversity in the realm of affect and cognition to distinct interface designs or design elements. Several approaches to assessing diversity in human cognition and affect were outlined. These approaches vary in which personal characteristics are considered, and in the level of detail used to segment users based on those characteristics. Some approaches depended on pre-tests in order to profile the users' personal characteristics, while other approaches use online user behavior as an implicit means of evaluating the differences in users' personal
characteristics.
Call to Action
The adoption of a system based on perception is subject to change depending on various circumstantial factors. Therefore, it is more appropriate to focus on attitude, a changeable and transient human factor, than personality which is considered to be more permanent. Attitudes are personal traits exhibited towards someone or something, for example towards smoking and drinking or towards the church (Ajzen, 1988, p.1).
Because attitudes are more poignant to a particular object, issue, or cause, in my opinion, they seem to fit better with particular task-supporting functionality on the web.
exhaustive, it served as a good indication that most studies take a global view of personality that segments the population into major groups. Among these, the weakest attempts to provide a richer perspective on personality are those studies that propose a dualistic view, dividing the population into two major categories.
It's always been a trend in HCI to reach into surrounding bodies of knowledge in order to better inform HCI research. The research done so far indicates that there is still more to be reached for in psychology, especially more fine-grained traits. There are numerous scales to be tested against recently-established usability guidelines and design patterns. Such studies would benefit designers and users, and would leverage the growing availability of online user data. Moreover, in light of growing web traffic and the availability and popularity of tests of individual differences online, the time to match precise and granular assessments of individual differences to interface design may have never been better.
METHODS
This study will attempt to bridge two bodies of knowledge, one concerning attitude and another concerning best practices in user interface design. Efforts in developing these two have been extensive and have lasted many years, starting from qualitative exploration to now concrete measures of attitudes and well-accepted solutions to challenges in information management.
While some portions of the study methods have been tested in a variety of other contexts, other portions are newly-developed for this study. Overall, this study's nature is highly exploratory, so the research hypotheses have been limited to the following:
H1: Design pattern preferences will differ between those with different levels of entrepreneurial attitude orientation.
Rationale: Assuming reputation is especially important to high-performing, entrepreneurial individuals, the preferences of that group will be different than that of others.
H2: High entrepreneurial attitude orientation scores will correlate positively with preference for competitive social design patterns.
A sample from UNC students and mostly Triangle-based entrepreneurial individuals participated. A questionnaire collected demographic characteristics and measured entrepreneurial attitude and preference for social networking interaction. A recruitment email was sent out, linking to the online questionnaire. The data were analyzed, using Spearman correlations to examine the relationships of primary interest. The study methods are described in more detail here.
Sample
A convenience sample was drawn from the researcher’s immediate network at the University of North Carolina at Chapel Hill and personal contacts beyond. The
researcher contacted employees at OP, and students and professors at the business school at UNC. A snowball sample was generated as the email asked for participants to refer other participants.
Because the goal of the study was to rank design patterns according to the preferences of most to least entrepreneurial subjects, it was not desirable to screen
subjects for high entrepreneurial attitude orientation. On the contrary, this study sought a wide range in entrepreneurial attitude orientation among subjects. Because the sample was drawn from a diverse population, a wide range of EAO scores was expected.
All students at UNC, business and non-business, were contacted through the UNC mass email system. The emails targeting this pool explained the purpose of the study, and briefly described the study procedures in terms of how much time it was expected to take, and the basic steps involved.
Kenan-Flagler professors at UNC were also contacted through the UNC mass email system. Their particular emails also explained the purpose of the study, and briefly described the procedure in terms of how much time it would take and the basic steps involved. However, the main purpose of their email was to ask professors to encourage their students to participate. This encouragement was necessary to increase the chances of recruiting entrepreneurial-minded individuals.
The researcher also contacted professionals in the area that he had met over the past year and a half at events for entrepreneurs. As in traditional snowball sampling, these contacts were encouraged to forward the email to other professionals involved in entrepreneurial activities.
A small amount of grant money was used to stimulate participation and
Variables and Measurement Techniques
There were two variables of interest for this study – entrepreneurial attitude orientation and design pattern preference. Each of these variables was measured with a questionnaire. The questionnaire was chosen as a means of data collection for several reasons. First, it was chosen because it has at least a 30 year history of being used to measure attitudes and preferences in a systematic way and with a high response rate if crafted properly (Dillman, 1978). The field of psychometrics provides us with a variety of tools for ensuring that measures taken with questionnaires are reliable and valid.
Second, questionnaires were chosen because of their similarity to online quizzes. As was mentioned previously, the web has been seeing a growing number of free quizzes and tests. Users are taking these to learn about themselves or share their results with others. The use of a scale taken from research in psychology is a surrogate for an online quiz. In fact, with only 75 questions, the EAO could easily be one of the many tests administered online.
Lastly, questionnaires are relatively more time-efficient, cheaper and farther-reaching. Being able to administer the questionnaire online may increase the
generalizability of the study because more subjects could be reached. Because it can be completed from the comfort of the subject’s home, more subjects are likely to participate.
The Demographic Questionnaire
The demographic questionnaire asked about age, sex, and educational level, and whether the respondent was currently a business student or not. This was minimal demographic information, as demographic analysis was not the primary focus of the study.
The Entrepreneurial Attitude Orientation (EAO) Questionnaire
The EAO questionnaire was developed (Huefner, Hunt, & Robinson, 1996) to predict entrepreneurship, based on attitude rather than personality theory. It is based on a three-part model that states that cognition (thought), affect (feeling), and conation (behavioral intentions) are the fundamental components for orienting attitudes towards achievement, innovation, personal control, and self esteem. These four components are the EAO as subscales, and one can calculate a single score for each (Robinson et al., 1991).
In its entirety, the EAO consists of 75 statements (see appendix B). The subject indicates how much he/she agrees with each of the statements by circling a number between 1 and 103 where 1 indicates strong disagreement with the statement and 10 indicates strong agreement with the statement, as shown in Figure 1. A 5 indicates that he/she only slightly disagrees and a 6 shows only slight agreement (see instruction in appendix B).
Figure 1: The 10-point rating scale used in the EAO questionnaire
The anchors between 2 and 4 and between 7 and 9 were not labeled because of the lack of words of evenly increasing magnitude that all subjects are likely to agree upon. Numbers, however, will still be used as labels, as shown in Figure 1. The instructions and statements will also be written in a way to avoid disrupting subjects’ adaptation to the style used in the EAO.
The range of the four EAO subscale scores is 1.0 to 10.0 after averaging the responses. On each subscale, the higher the value, the more entrepreneurial the individual is predicted to be.
With their introduction of the EAO, Robinson et al. also report on its validity. Entrepreneurs’ EAO scores are significantly higher than non-entrepreneurs. Its reliability
3
was shown to be acceptable, though the researchers regret having tested reliability with naïve introductory psychology students rather than entrepreneurs.
The Social Design Pattern Questionnaire (SDPQ)
The Yahoo! DP Library is one of the resources found at the Yahoo! Developer Network. It was selected as the basis for this study in acknowledgement of their experience and success in designing for the World Wide Web. The DPs in this library serve as solutions to specific problems in user interface design. All patterns are sensitive to context. Yahoo’s DPs are created using a process that begins with practice and is then supported through usability testing and user experience research.4 Yahoo provides a title, problem, context, and solution for each DP. For the purpose of this study, it is important to note, however, that there is always some amount of ambiguity associated with each pattern and, ultimately, their use often depends on context or the designers’ best guess.
For this study, DPs that address the social web were selected from the various categories in the library (see Appendix A). The SDPQ was designed specifically for this study, to determine the subjects’ preferences for particular DPs, from caring to combative social user interface DPs. Minimal context was included within the questionnaire
statements and a general entrepreneurial context was provided in the questionnaire instructions, as follows:
Design an online social network!
In this exercise, you'll decide how a new online social networking website will work. This social network is intended to help you launch projects successfully. For each problem, please respond as directed, either ranking the solutions that would fit best with you, or selecting the best choice for you.
4
Likert scales are not used in the SDPQ but the wording is clear and the order of the questions is appropriate because they were pilot-tested and iterated for several weeks prior to the start of the study. All four SDPQ questions are ranking questions. While each question shows five rankable options, the subjects need only choose their top three in order of preference. It is hoped that choosing three out of five will have provided enough breadth to distinguish vehement opinion (first choice) from simple conformity (third choice).
To construct effective statements, Peterson (2000) advises researchers to avoid double negatives. Statements in the SPDQ do not contain double negatives. Peterson also recommends using as few words as possible, however, statements in the SPDQ also articulate nuances between social patterns. Another recommendation is not to overuse commas, clauses, not to sound convoluted, and to use smaller words when possible (p. 50). Considering the challenges of expressing social design patterns, these considerations were followed as closely as possible when crafting the questions and choices in the SDPQ.
Yahoo!’s "competitive spectrum" details a range of patterns that manage member reputation with varying levels of competitiveness, from caring to combative. Yahoo! provides the following introduction to all Reputation DPs:
structures. Balancing these forces determines in large measure the success or failure of a social system.5
The Competitive Spectrum is one dimension within Reputation. Yahoo! claims that a community's competitiveness "depends on the individual goals of community members, the actions they engage in, and to what degree inter-person comparisons or contests are desired." Yahoo! suggests that designers "pay careful consideration to the degree of competitiveness the community ought to exhibit" in order to design an appropriate reputation system, if required.
Each of the five competiveness levels differs on three factors: (1) the goal that motivates the “competitors,” (2) how reputation is used, and (3) how it is represented. It is implied that designers already understand the motivations of the members in their social network. Factor two simply ties the goal to the appropriate DP, which is described in factor three.
Among those who are motivated by caring, helping others is suggested as the goal. For those who seek collaboration, collaborating with others is, of course, the goal. There are those who may seek the cordial, neutral goal and desire to be at peace with others as their goal. Community members who seek competition look to out-perform others. And finally, combative members aim to win over others.
Yahoo! implies that caring members value reputation if it prompts others to consider their advice. Collaborators use it to assess trustworthiness. Cordial members use it to compare their own interests and values with each other. Competitive members
5
use it to check their performance against each other, and combative types use it to inspire admiration in their peers.
Representation can be as simple as a nominal or numeric title or label. For
members motivated by helping others, Yahoo! suggests placing a label that that expresses members’ unique expertise. For all others, Yahoo! suggests a ranking because it carries comparative information. The difference lies in how revealing or detailed to make the information. A non-numeric ranking based on standard, well-established levels of achievement is proposed for collaborators. A more internal, community-based ranking may work best for cordial members, yet less granular than that for competitive and combative members.
Frary (1995) explains that, "when responders are asked to rate items for which the general level of approval is high," social norms may influence subjects to answer
according to what they perceive is valued in society. In the United States, there are undeniable stigmas against extremely aggressive competition but there are also known pressures towards competition overall. Frary suggests that a "strategy for reducing the tendency to mark every item at the same end of the scale is to ask responders to rate both positive and negative stimuli". SDPQ statements are deliberately written to vary
Although Yahoo!’s DP Library leverages iconic visuals to make a point, the SDPQ is text-only, without any visual aids. This will reduce the influence on the subjects. Ultimately, illustration of DPs may be detrimental to the purpose of a DP because they are to be understood as mere patterns, intended to be repurposed and
redressed. The intent of this study is not to test the usage of or preference for a particular manifestation of any given DP. The purpose is to test the concept behind DPs and the appropriateness of their solution from the point of view of my subjects. Any illustrations would likely lead to assumptions and confusion. Subjects would link particular
manifestations of the DP concepts with the concepts themselves.
Traditionally, a subject’s answers are aggregated to arrive at his/her overall
measure. SDPQ answers will also be summed to arrive at a single score for each subject. Please refer to Appendix G for a detailed explanation of the scoring.
Procedures
Implicit informed consent was obtained online. The recruitment emails had a link to an information sheet (Appendix D). Once there, the participant was able to click on a link to give consent and proceed to the questionnaire. The participant could also click on a link in the recruitment email to be taken directly to the questionnaire, skipping the information sheet. The respondent was informed that clicking any of these links gives consent and certifies that the respondent is above 18 years of age.
a reminder. The four parts of the questionnaire were the demographic questionnaire; the Entrepreneurial Attitude Orientation (EAO) scale, that asked subjects questions about their behavior when completing projects and how they manage and feel about
accomplishing tasks; the Social Design Preference Questionnaire (SDPQ), that asked subjects to express their preferences for particular social web patterns found in the
Yahoo! DP Library; and a fourth part, which asked subjects to submit contact information should they choose to participate in the drawing for monetary compensation.
Qualtrics6 software was be used to create the form. Subjects were expected to take about 20 minutes to complete the entire questionnaire. Once data was collected, it was exported from Qualtrics and imported into SPSS.
There were no known risks in answering the online questionnaire. The IP address is normally captured with each response to a Qualtrics questionnaire. In this study, the IP addresses were deleted immediately. The names or email addresses (depending which one the participant chose to provide) of those subjects wanting to participate in the drawing were be stored separately from the data.
The entire study required about one month for data collection. The final report was completed by August, 2010.
Data Analysis
Whereas each Social DP has been validated for a general user base, this study will fragment its pool of subjects using the EAO questionnaire. It will look at how the social DP preferences among the individuals with the strongest entrepreneurial attitudes
6
compare to those preferences among those with the lowest entrepreneurial attitude orientation. In this way, the SDPQ was used to test the appropriateness of differing Social DPs for an entrepreneurial context.
The answers to the EAO scale were aggregated by subscale, generating a score on each subscale for each subject (see Appendix F for calculation details). Similarly, an SDPQ score was calculated for each subject (see Appendix G for calculation details). Using SPSS, Spearman's rho was calculated to examine the relationships between EAO subscales and SDPQ total scores. Particular attention was paid to the possibility that, as EAO sub-scores increased or decreased, DP preferences changed from caring to
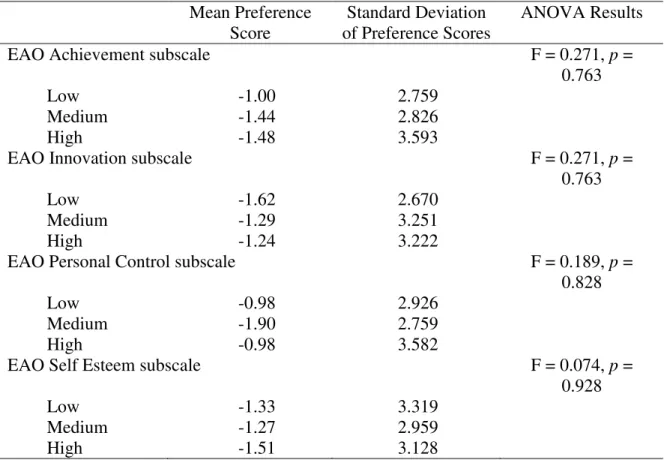
combative. In further analysis, the four EAO subscale scores were used to divide the subjects into three groups, with high, medium, and low scores on each of the four subscales on entrepreneurial attitudes. The mean SDPQ scores for each
RESULTS Participant Characteristics
Of the many people who might have responded to the questionnaire, 216 attempted to complete the study and 144 of them completed it entirely. This gives a completion rate of about 67% (144/216). It is interesting to note that, out of the 72 individuals who did not complete the questionnaire, about 94% reported their age, nearly 99% reported their sex, highest level of education, and UNC student status, and nearly 96% reported their business school status. Therefore, we can compare the demographic characteristics of participants (144) versus non-completers (72).
Participants reported ages ranging from 18 to 63 with an average age of 27.24 and standard deviation of 10.18. Non-completers were similar, having an average age of 26.69, and a standard deviation of 9.64. Eight participants did not report their age. All participants reported their sex. Ninety-nine (69%) reported that they were female and 45 (31%), male. Within non-completers, 49 (68%) reported that they were female and 22 (31%), male.
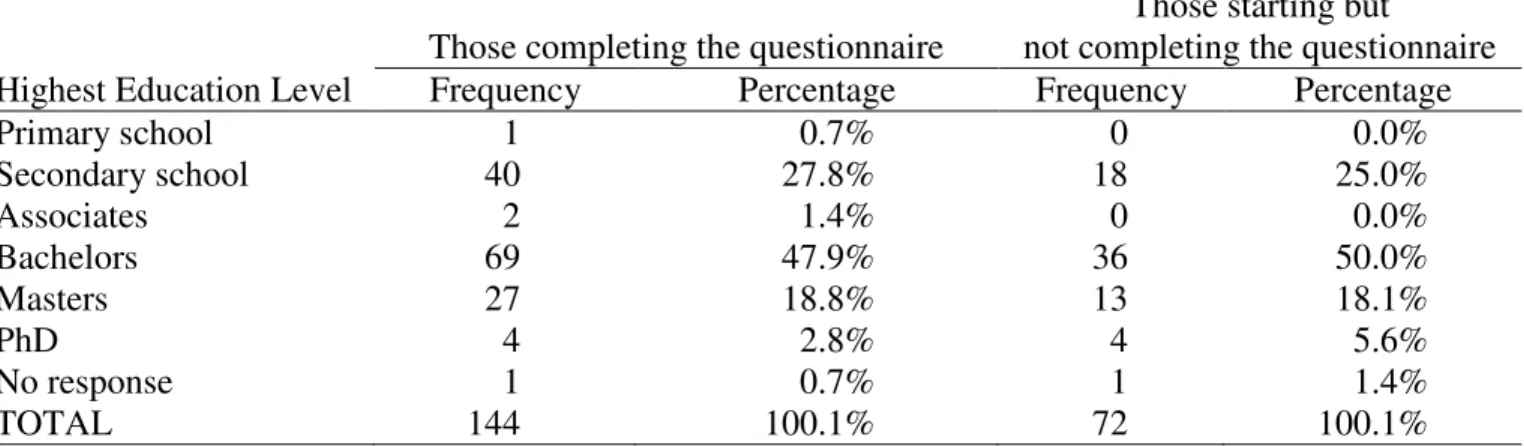
Respondents were asked about the highest level of education they had completed. Table 2 shows the breakdown of highest achieved education level. Most of the
Table 2: Highest Education Levels Achieved
Those completing the questionnaire
Those starting but not completing the questionnaire Highest Education Level Frequency Percentage Frequency Percentage
Primary school 1 0.7% 0 0.0%
Secondary school 40 27.8% 18 25.0%
Associates 2 1.4% 0 0.0%
Bachelors 69 47.9% 36 50.0%
Masters 27 18.8% 13 18.1%
PhD 4 2.8% 4 5.6%
No response 1 0.7% 1 1.4%
TOTAL 144 100.1% 72 100.1%
In a separate question, respondents were asked whether they were students at UNC. About 65% were enrolled as students at UNC. Five or 6 of these were also business students. Among non-completers, 70% were enrolled as students at UNC and there may have been one business student. This ambiguity is explained and analyzed in the Discussion chapter.
square test invalid. Since Primary school, Associates degree, and PhD had very low frequencies, the new categories group primary with secondary school, associates’ degrees with bachelors’ degrees, and masters’ with PhD. There was no statistically significant difference in the distribution by level of educational attainment (χ2 = 0.309, p = 0.857). Finally, chi square was also used to examine possible differences in enrollment at UNC and in business school. There was no statistically significant difference in either of these distributions (χ2 = 0.569, p = 0.451, and χ2 = 1.372, p = 0.242, respectively). From these analyses, we can conclude that the participants and those who did not complete the questionnaire did not differ on any of the demographic characteristics examined.
Results on Entrepreneurial Attitude Orientation (EAO)
Theoretically, subscale scores on the EAO could range from 1 to 10. The participants’ mean scores (and standard deviations) for each of the four subscales are shown in Table 3.
Table 3: EAO Scores by Subscale
Mean Standard Deviation Range
Achievement 7.55 0.87 3.82-9.48
Innovation 6.51 0.94 3.42-8.65
Personal Control 6.55 1.02 2.50-8.83
Self Esteem 6.03 0.73 4.50-8.11
Results on Design Patterns
Figure 2: SPDQ (preference) Distribution
Relationship between EAO and Social Design Pattern Preferences
Table 4 shows the Spearman correlations derived for each sub-score against preference. None of these correlations were statistically significant.
Table 4: Correlations between EAO Subscales and Design Pattern Preferences
EAO subscale Spearman’s rho P
Achievement -0.052 0.538
Innovation 0.051 0.543
Personal control -0.010 0.909
Self esteem 0.007 0.930
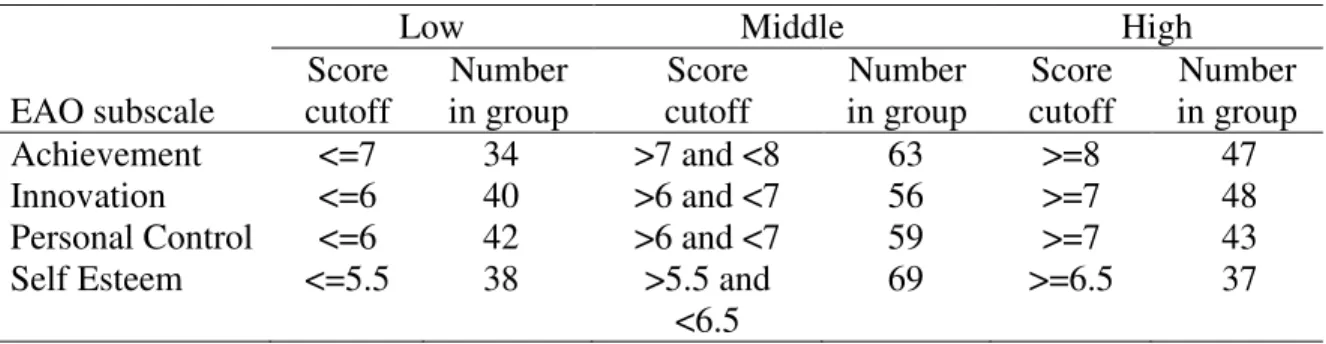
this possibility. Each subscale was divided roughly into thirds at natural cuts where the sub-scores seems to divert quickly to extremely low or high levels. Table 5 shows the cuts between groups for each subscale.
Table 5: Groupings Based on EAO Subscale Scores
Low Middle High
EAO subscale
Score cutoff
Number in group
Score cutoff
Number in group
Score cutoff
Number in group Achievement <=7 34 >7 and <8 63 >=8 47
Innovation <=6 40 >6 and <7 56 >=7 48
Personal Control <=6 42 >6 and <7 59 >=7 43 Self Esteem <=5.5 38 >5.5 and
<6.5
69 >=6.5 37
Table 6: Preference Scores for Each EAO Subscale Grouping Mean Preference
Score
Standard Deviation of Preference Scores
ANOVA Results
EAO Achievement subscale F = 0.271, p =
0.763
Low -1.00 2.759
Medium -1.44 2.826
High -1.48 3.593
EAO Innovation subscale F = 0.271, p =
0.763
Low -1.62 2.670
Medium -1.29 3.251
High -1.24 3.222
EAO Personal Control subscale F = 0.189, p =
0.828
Low -0.98 2.926
Medium -1.90 2.759
High -0.98 3.582
EAO Self Esteem subscale F = 0.074, p =
0.928
Low -1.33 3.319
Medium -1.27 2.959
DISCUSSION
Many respondents abandoned the questionnaire and it is not clear why. The good news is that demographic characteristics are similar between participants and
completers. Age, sex, and education level were similar among participants and non-respondents. However, the reasons for aborting the survey may lie in some other characteristic. For instance, non-completers may have been less entrepreneurial. Upon discovering the focus of the survey, they may have lost interest or surmised that the study was not intended to include them and aborted the survey. Thus, while it is clear that the sample was not biased in terms of demographic characteristics, it may be biased in other ways.
The sample was relatively young and female, with only 1/3 of the sample above 37 years of age and 1/3 being male. As many of the participants were UNC students, this is not surprising, since the UNC undergraduate student population is primarily of
traditional college age and the majority of the students are female.7
The sample is highly educated, as nearly 2/3 have at least a bachelor’s degree. This group includes 39 participants 21 years of age and older that also reported being enrolled at UNC – presumably graduate students. However, one participant must have
7
Based on data from Fall 2009, 94% of the UNC-Chapel Hill undergraduate students were
between 18 and 24 years old; 59% of the undergraduate student population was female
misunderstood the question as he/she reported to have completed primary school, yet also claimed to be enrolled at UNC.
The questionnaire asked only UNC students to report whether they were also business students. Five UNC students did so; however, one non-UNC student reported being a business student as well. This error happened with one subject in the
non-completer group as well. These two participants were either business students at another university or made some logical mistake when answering these enrollment questions. They were counted as business students because it seems more likely that they
overlooked an “if yes” logical clause, than that they reported being business students when they were not.
With a mean of -1.35, preference is off-center toward the lower end on the scale. This means that the participant pool, as a whole, prefers caring and collaborative over competitive or combative social design patterns.
The primary goal of this study was to examine the relationship between
entrepreneurial attitude orientation and social design pattern preferences. Specifically, the relationship between the four subscale scores on the EAO and SDPQ scores were
H1 stated that social design pattern preferences would differ between those with different levels of entrepreneurial attitude orientation. No evidence was found to support this hypothesis.
H2 stated that high EAO scores would correlate positively with preference for competitive social design patterns. Since the correlations are not significant, this hypothesis cannot be supported either
The results were surprising to me, although many studies fail to find relationships between personality and attitudes toward technology. It would have been beneficial to seek a larger number of real entrepreneurs to compare to the sample represented in this study. It may have also helped to have a controlled environment for subjects rather than have them answer questions at their leisure and whereabouts.
Limitations
ambiguous. However, the use of a validated and reliable scale in this study should have ameliorated this limitation. While the SPDQ was newly-developed for this study, it was quick and hopefully entertaining.
The SDPQ had its own limitations. It was neither not tested for reliability nor validity. It has never been used before, and could suffer from many mistakes and problems.
CONCLUSION
It is important to investigate the possibility that people with particular cognitive or personality characteristics prefer particular design patterns, because the results of such studies can give developers an idea about what interface design patterns are preferred by a particular segment of the population before these developers spend as many resources as they do today in designing an interface. Should UNC deploy a social networking site, I would advise that they employ rather collaborative social design patterns, given the results of this study. The respondents were predominantly UNC students and their overall mean SDPQ score tended toward the more collaborative design patterns.
The results also imply that individuals who show highly entrepreneurial attitudes do not have a predictable preference for online collaboration or competition, as was expected. No statistically significant relationship was discovered between
entrepreneurial attitude orientation and social design pattern preferences.
What we do not know is how important this preference is to these entrepreneurial individuals. Some who prefer collaborative social networks may outright reject a social network that encourages competition. Others who possess the same preference may accept it, adapt to it, or even learn to like and thrive in it. But it's not clear whether those who prefer competition are more likely to adapt to collaboration or vice versa.
Facebook, LinkedIn, and other such networks have seen their growth act as a driver itself, as members pull their friends in. Those who resist joining these networks despite peer pressure may be especially stoic, sacrificing the benefits of online social networking for personal reasons. Each one of us may have our own individual threshold when we decide to join a network. What does it take for each one of us to give up privacy for social cohesion? Similarly, entrepreneurial individuals may have a threshold of their own. Each one of them may tolerate a different level of competition or
REFERENCES
Ajzen, I. (1988). Attitudes, personality, and behavior. Chicago, IL: Dorsey Press. Anderson, C. (c2008). The long tail : Why the future of business is selling less of more.
New York: Hyperion.
Anderson, J., McRee, J., Wilson, R., (2010) Effective UI: The Art of Building Great User Experience in Software. Sebastopol :: O'Reilly Media, Inc., 2010
Basadur, M., & Hausdorf, P. A. (1996). Measuring divergent thinking attitudes related to creative problem solving and innovation management. Creativity Research Journal, 9, 21-32.
Brinkman, W., & Fine, N. (2005). Towards customized emotional design: An explorative study of user personality and user interface skin preferences. ACM International Conference Proceeding Series. Chania, Greece, 132, 107-114.
Burke, R. (2002). Hybrid recommender systems: Survey and experiments. User Modeling and User-Adapted Interaction, 12(4),331–370. Caporusso, N. (2009).
Personality-aware interfaces for learning applications. ACM SIGUCCS Fall Conference on User Services Conference. New York, NY, 189-196.
Costabile, M. F., Piccinno, A., Fogli, D., & Marcante, A. (2006). Supporting interaction and co-evolution of users and systems. Working Conference on Advanced Visual interface. Venezia, Italy, 143-150.
Crumlish, C., & Malone, E. (c2009). Designing social interfaces : [principles, patterns, and practices for improving the user experience]. Beijing ;: O'Reilly Media.
Davis, F. D. (1989). Perceived usefulness, perceived ease of use, and user acceptance of information technology. MIS Quarterly, 13(3), 319-340.
Dillman, D.A. (1978). Mail and telephone surveys: The Total Design Method. New York: Wiley.
Ford, N., Miller, D., & Moss, N., (2005). Web search strategies and human individual differences: Cognitive and demographic factors, Internet attitudes, and
approaches. Journal of the American Society for Information Science and Technology, 56(7), 741-756.
Frary RB. A brief guide to questionnaire development. Available at:
http://ericae.net/ft/tamu/vpiques3.htm. Accessed December 2009.
Gamma, E. (c1995). Design patterns : Elements of reusable object-oriented software. Reading, Mass.: Addison-Wesley.
Gonzalez, G., de la Rosa, J.L., & Montaner, M. (2007). Embedding Emotional Context in Recommender Systems. The 20th International Florida Artificial Intelligence Research Society Conference. Key West, Florida.
Hewett, T., Baecker, R., Card, S., Gasen, J., Mantei, M., Perlman, G., Strong, G., Verplank, W.:
Ho, S.Y., Davern, M., and Tam, K. Y. (2008) Personalization and choice behavior: The role of personality traits. Date Base for Advances in Information Systems, 39(4), 31-47.
Huefner, J., Hunt H. K., & Robinson P.B. (1996). A comparison of four scales predicting entrepreneurship. Academy of Entrepreneurship Journal, 1(2), 56-80.
Karsvall, A. (2002). Personality preferences in graphical interface design. The Second Nordic Conference on Human-Computer Interaction. Aarhus, Denmark, 19-23.
Liang, T., Chen, H., & Turban, E. (2009). Effect of personalization on the perceived usefulness of online customer services: A dual-core theory. The 11th international Conference on Electronic Commerce. Taipei, Taiwan, 279-288.
Massey A.P., Khatrim V., & Montoya-Weiss, M.M., (2008). Online Services, Customer Characteristics and Usability Requirements," Hawaii International Conference on System Sciences. Big Island, Hawaii, 33.
Nunes, M. A., Cerri, S. A., & Blanc, N. (2008). Towards user psychological profile. The VIII Brazilian Symposium on Human Factors in Computing Systems. Porto
Alegre, Brazil, 378, 196-203.
Peterson, R A. (c2000). Constructing effective questionnaires. Thousand Oaks, Calif.: Sage Publications.
Resnick, R. (1997). Recommender systems. Communications of the ACM, 40(3), 56–58. Robinson, P., Stimpson, D., Huefner, J., & Hunt, H. (1991). An attitude approach to the
Smith, S.L. and Mosier, J.N. Guidelines for Designing User Interface Software. Report MTR.10090, The MITRE Corp, Bedford, MA, August 1986.
Sohl, J. (2008). The Angel Investor Market in 2008: A Down Year In Investment Dollars But Not In Deals, Retrieved from
http://www.innovationamerica.us/index.php/publications-and-
presentations/published-reports/75-the-angel-investor-market-in-2008-a-down-year-in-investment-dollars-but-not-in-deals
Srite, M., & Karahanna, E. (2006). The role of espoused national cultural values in technology acceptance. MIS Quarterly, 30(3), 679-704.
Terveen, L. & McDonald, D.W. (2005). Social matching: A framework and research agenda. ACM Transactions on Computer-Human Interaction, 12(3), 401–434. Venkatesh, V. (2000). Determinants of perceived ease of use: Integrating control,
intrinsic motivation, and emotion into the technology acceptance model. Information Systems Research, 11(4), 342.
Weinberg, J. B. & Stephen, M. L. (2002). Participatory design in a human-computer interaction course: Teaching ethnography methods to computer scientists. The 33rd SIGCSE Technical Symposium on Computer Science Education. Cincinnati,
Kentucky, 237-241.
Appendix A: Yahoo! Social Design Patterns
This table is taken directly from the Yahoo! Design Pattern Library, part of the Yahoo! Developer’s Network at
http://developer.yahoo.com/ypatterns/social/people/reputation/competitive.html. It was borrowed and adapted from Christian Crumlish and Erin Malone in “Designing Social Interfaces: Principles, Patterns, and Practices for Improving the User Experience” (see References).
Goals
Members are motivated by helping other members - giving advice, solace or comfort.
Member goals are largely shared ones. Members work together to achieve those goals.
Members have their own intrinsic
motivations, but these goals need not conflict with other members' goals.
Members share the same goals, but must compete against each other to achieve them.
Members share opposing goals: in order for one member to achieve these goals, others must necessarily be
denied their own.
Use Reputation to...
Identify senior community members of good standing, so that others can find them for advice and guidance.
Identify community members with a proven track-record of being trustworthy partners.
Show a member's history of participation, that others may get a general sense for their interests, identity and values.
Show a member's level of accomplishment, that others may
acknowledge (and admire) their level of performance.
Show a member's history of accomplishments, including other members' victories and defeats against them. Reputation is used to
Represent Reputation with...
Accept volunteers (of good standing) from the community to wear an Identifying Label: 'Helpful' or 'Forum Leader'. New members can trust these folks to help initiate them into the community.
Use Named Levels to communicate members' history and standing: members with higher ranks should be trusted more easily than newbies.
Consider Statistical Evidence to highlight a members'
contributions: just show the facts and let the community decide their worth. Optionally, Top X designations can highlight members with numerous valued contributions.
Allow easy
comparisons between members with
Numbered Levels. Provide mini-motivations by awarding Collectible Achievements.
Let a member track her own progress by assigning Point Values to different actions. Rank
members against each other, displaying winners and losers. Example Communities
• Y! Health
Expert Blogs
• Wikipedia
• Yelp
• Yahoo! Answers
• Slashdot
• Ebay
Appendix B: Entrepreneurial Attitude Orientation (EAO) Scale with subscales and attitude components identified
Instructions: Indicate how much you agree with each of the following statements by circling a number between "1" and "10" where "1" indicates that you strongly disagree with the statement and "10" indicates you strongly agree with the statement. A "5"
indicates you only slightly disagree and a "6" shows only slight agreement. Work as quickly as you can, don't stop to think too deeply about any one question, but mark down your first thought. Please answer all of the questions.
Statement Subscale
1 I get my biggest thrills when my work is among the best there is. achievement—affect 2 I seldom follow instructions unless the task I am working on is too
complex,
innovation—behavior 3 I never put important matters off until a more convenient time, achievement—behavior 4 I have always worked hard in order to be among the best in my
field,
personal control— behavior
*5 I feel like a total failure when my business plans don't turn out the way I think they should,
self-esteem—affect 6 I feel very energetic working with innovative colleagues in a
dynamic business climate,
innovation—affect 7 I believe that concrete results are necessary in order to judge
business success,
achievement— cognition
8 I create the business opportunities I take advantage of. personal control— behavior
9 I spend a considerable amount of time making any organization I belong to function better,
achievement—behavior 10 I know that social and economic conditions will not effect my
success in business,
personal control— cognition
11 I believe it is important to analyze your own weaknesses in business dealings,
achievement— cognition 12 I usually perform very well on my part of any business project I
am involved with,
self-esteem—behavior 13 I get excited when I am able to approach tasks in unusual ways, innovation—affect *14 I feel very self-conscious when making business proposals, self-esteem—affect 15 I believe that in the business world the work of competent people
will always be recognized,
personal control— cognition
16 I believe successful people handle themselves well at business gatherings,
self-esteem—cognition 17 I enjoy being able to use old business concepts in new ways, innovation—affect * 18 I seem to spend a lot of time looking for someone who can tell me
how to solve all my business problems,
self-esteem—behavior 19 I feel terribly restricted being tied down to tightly organized
business activities, even when I am in control,
Statement Subscale business opportunities,
*21 I feel self-conscious when I am with very successful business people,
self-esteem—affect 22 I believe that to succeed in business it is important to get along
with the people you work with,
self-esteem—cognition 23 I do every job as thoroughly as possible, achievement—behavior 24 To be successful I believe it is important to use your time wisely, achievement—
cognition 25 I believe that the authority I have in business is due mainly to my
expertise in certain areas,
self-esteem—cognition 26 I believe that to be successful a businessman must spend time
planning the future of his business,
achievement— cognition 27 I make a conscientious effort to get the most out of my business
resources,
achievement—behavior *28 I feel uncomfortable when I'm unsure of what my business
associates think of me.
self-esteem—affect *29 I often put on a show to impress the people I work with, self-esteem—behavior 30 I believe that one key to success in business is to not procrastinate, achievement—
cognition 31 I get a sense of pride when I do a good job on my business
projects,
achievement—affect 32 I believe that organizations which don't experience radical changes
now and then tend to get stuck in a rut.
innovation—cognition *33 I feel inferior to most people I work with, self-esteem—affect 34 I think that to succeed in business these days you must eliminate
inefficiencies,
achievement— cognition 35 I feel proud when I look at the results I have achieved in my
business activities,
achievement—affect 36 I feel resentful when I get bossed around at work, personal control—
affect *37 Even though I spend some time trying to influence business events
around me every day, I have had very little success,
personal control— behavior
*38 I feel best about my work when I know I have followed accepted procedures,
innovation—behavior 39 Most of my time is spent working on several business ideas at the
same time,
innovation—behavior 40 I believe it is more important to think about future possibilities
than past accomplishments.
achievement— cognition 41 I believe that in order to succeed, one must conform to accepted
business practices,
innovation—cognition 42 I believe that any organization can become more effective by
employing competent people,
personal control— cognition
Statement Subscale 44 I will spend a considerable amount of time analyzing my future
business needs before I allocate any resources,
achievement—behavior 45 I feel very good because I am ultimately responsible for my own
business success,
personal control— affect
46 I believe that to become successful in business you must spend some time every day developing new opportunities,
innovation—cognition 47 I get excited creating my own business opportunities, personal control—
affect 48 I make it a point to do something significant and meaningful at
work every day.
achievement—behavior 49 I usually take control in unstructured situations, innovation—behavior *50 I never persist very long on a difficult job before giving up. self-esteem—behavior 51 I spend a lot of time planning my business activities, personal control—
behavior 52 I believe that to arrive at a good solution to a business problem, it
is important to question the assumptions made in defining the problem,
innovation—cognition
53 I often feel badly about the quality of work I do. self-esteem—affect 54 I believe it is important to continually look for new ways to do
things in business,
innovation—cognition 55 I believe it is important to make a good first impression, self-esteem—cognition 56 I believe that when pursuing business goals or objectives, the final
result is far more important than following the accepted procedures,
innovation—cognition
57 I feel depressed when I don't accomplish any meaningful work, achievement—affect 58 I often approach business tasks in unique ways, innovation—behavior 59 I believe the most important thing in selecting business associates
is their competency,
achievement— cognition 60 I take an active part in community affairs so that I can influence
events that affect my business,
personal control— behavior
61 I feel good when I have worked hard to improve my business, achievement—affect 62 I enjoy finding good solutions for problems that nobody has
looked at yet.
innovation—affect 63 I believe that to be successful a company must use business
practices that may seem unusual at first glance,
innovation—cognition 64 My knack for dealing with people has enabled me to create many
of my business opportunities,
personal control— behavior
65 I get a sense of accomplishment from the pursuit of my business opportunities,
achievement—affect *66 I believe that currently accepted regulations were established for a
good reason,
innovation—cognition 67 I always feel good when I make the organizations I belong to
function better,