1
Diabetes Mellitus affects 8.3% of the U.S. population and the prevalence, particularly of type 2 diabetes, is increasing alongside the growing overweight and obesity numbers (Centers for Disease Control and Prevention [CDC], 2011). Consequently, this chronic condition has become a serious public health concern, as many diagnoses of type 2 diabetes are considered preventable through physical activity, proper diet, weight loss, and tobacco cessation. The lack of
comprehensive surveillance methods at the state level contributes to the ineffectiveness at reducing the incidence of diabetes, as the geographic trends reveal continued disparities.
Surveillance is a fundamental tool in pushing forward the movement against diabetes. Better tracking, unification of methods, and accessible data sources could raise awareness and allow policy makers, patients, researchers, and the public to recognize the grave burden of diabetes. Acquiring and distributing this information is critical at the state level, since each state has varying prevalence numbers and environmental factors. Individuals cannot be expected to make positive lifestyle modifications and properly manage their conditions if they are not provided with the opportunities to do so, and these opportunities can only come with improved surveillance methods, research, and funding.
This paper examines the burden of diabetes (type 2) through its life span: the rise in the prevalence among youths, adult diabetes, complications of diabetes (diabetic retinopathy, end-stage renal disease, and lower limb amputations), and finally, death from diabetes. Findings from a literature and electronic search regarding current surveillance methods and data sources will be presented and the paper will conclude with recommendations for moving forward. Taking action to improve surveillance of diabetes and its complications would allow the cohesiveness
2 Introduction: Diabetes Mellitus (Focus on type 2)
Diabetes Mellitus is a chronic condition that affects 8.3% of the U.S. population (Centers for Disease Control and Prevention [CDC], 2011). The total estimated diabetes cost was $174 billion in 2007 (CDC, 2011); this poses a severe burden on individuals with diabetes, insurers, and states with a high diabetes prevalence. Type 2 diabetes is the most common form of diabetes in which cells become resistant to insulin and ultimately the pancreas stops producing it (CDC, 2011). This disease is a serious public health problem because it is a preventable
non-communicable disease and consequently, action needs to be taken at the state level.
As prevalence of type 2 diabetes is growing in numbers, it is also expanding its reach to the younger population. Childhood diabetes is a growing concern as an increasing number of children form unhealthy dietary and physical activity patterns. As they grow into adults, they join the number of people who develop type 2 diabetes in adulthood. These individuals affected with diabetes then join the increasing number of individuals with immune-mediated and nonimmune-mediated diabetes to develop complications of diabetes, such as diabetic retinopathy, end stage renal disease (ESRD), and lower limb amputations due to poorly controlled or severe diabetes. Finally, as a result of the complications and other comorbidities, death serves as the final marker in the life span of the disease.
Purpose and Methods
3
Human Services [DHHS], 2011). In addition, Healthy People 2020 lists objectives that affect policy at the state level, including “Increase the number of States that have State-level policies that incentivize food retail outlets to provide foods that are encouraged by the Dietary
Guidelines” and “Increase the number of States with licensing regulations for physical activity provided in child care” (DHHS, 2011).
States must make available these types of resources in order for their residents, especially those who are disadvantaged, to even have the option of making behavioral changes to avoid developing type 2 diabetes. Once changes are made at the state level, individual behavior change can follow, which would decrease the prevalence of overweight and obesity, and ultimately decrease the prevalence and incidence of diabetes.
In order to raise awareness and support these crucial improvements, better surveillance methods must be executed at the state level. Surveillance is defined by the World Health Organization as the “systematic collection, analysis and interpretation of health data and the timely dissemination of this data to policymakers and others” (World Health Organization [WHO], 2011). Surveillance data is fundamental for raising awareness, setting policy measures, and planning for the future (WHO, 2011). The development of diabetes may be slowed or even prevented by providing the aforementioned resources to residents, but in order to do so, proper tracking, research, and translation of the research must be implemented. There is a need for state-level information, which is more precise than direct estimates from surveys or administrative records (Srebotnjak, Mokdad, Murray, 2010).
4
the availability of current state or national surveillance methods and data sources found through a literature and electronic database search. Finally, recommendations and strategies in moving forward will be discussed.
Burden and Contributors
Childhood Diabetes
The growing prevalence of type 2 diabetes among children is alarming for many reasons: it is a reflection of increased weight gain at an early age and it presents difficulties and increased health risks for these individuals throughout their lives. The percentage of immune-mediated type 1 diabetes is slowly decreasing as the prevalence of nonimmune-mediated diabetes (mostly type 2) is increasing among children. Type 1 diabetes was thought to be the only type considered prevalent among children, but during 2002-2005, about 18.75% of children were newly
diagnosed with type 2 diabetes (CDC, 2011). The SEARCH study, conducted by SEARCH for Diabetes in Youth, determined the prevalence of both types of diabetes among individuals < 20 years to be 0.18% (Table 1; SEARCH for Diabetes in Youth Study Group, 2006). The group also estimated the number of newly diagnosed children and adolescents with type 2 diabetes in the U.S. to be approximately 3700 each year (The Writing Group for the SEARCH for Diabetes in Youth Study Group [SEARCH], 2007).
5
aged 15-19 years show the highest rates, particularly American Indian youth at 49.4 per 100,000 person-years (SEARCH, 2007). This highlights a significant public health problem, particularly as the proportion of minorities is increasing in the U.S. (Rosenbloom, Joe, Young & Winter, 1999). Language barriers, low health literacy and education, and lack of health insurance are several factors among many that have a large bearing on minorities (Institute of Medicine [IOM], 2002). These contributors, particularly low health literacy and education, may indirectly give rise to poor nutrition and other unhealthy behaviors, which in turn increase the likelihood of weight gain and consequently, the development of type 2 diabetes.
Obesity serves as a marker for type 2 diabetes, with almost 85% of diabetic children either overweight or obese at the time of diagnosis (ADA, 2000). Obese children had over twice the odds of developing diabetes than those who were not overweight, with an odds ratio (OR) of 2.67 for the 6 to 11 year-old age group and 2.45 in the 12 to 17 year-old age group (Lee,
Herman, McPheeters & Gurney, 2006). Preventing and treating type 2 diabetes in the youth population can be challenging because of the behavioral and nonadherence trends.
Children may find it difficult to reverse overweight and obesity, partly due to peer pressure to consume foods and beverages that are high in calories and sugar content. Many current social marketing strategies make unhealthy foods seem attractive, but this trend is
reversing as more pressure and incentives are placed on improving nutrition and reducing obesity in children (Evans, Christoffel, Necheles & Becker, 2010). This particular age group, especially with the lack of symptoms, may also be more vulnerable to the denial of health status, resulting in dangerous nonadherence patterns for which children with diabetes are already at risk
6
physically, mentally, and emotionally during puberty, which makes managing and controlling diabetes even more challenging (CDC, 2001).
As diabetes worsens throughout childhood and into adulthood, youths may experience economic burden and a decreased quality of life. Particularly in children, poorly-controlled type 2 diabetes affects present and future productivity in school and work and may result in an increased risk of morbidity and mortality throughout the most productive years of life. Pinhas-Hamiel and Zeitler (2007) found that children and adolescents are prone to secondary obesity-related complications such as metabolic syndrome and hypertension, which are associated with increased cardiovascular risk. This relationship signifies a need for the development of public health strategies to target overweight and obesity in youths to effectively reduce the future burden of diabetes in the U.S. (Lee, Herman, McPheeters & Gurney, 2006).
Adult Diabetes
From 1980 to 2009, the number of adults with diagnosed diabetes more than tripled to affect approximately 25.6 million men and women over the age of 20 (CDC, 2011). The
pervasiveness of diabetes in the U.S. corresponds closely with obesity trends from state to state: Colorado, Connecticut, and Massachusetts have the lowest rates of obesity and also have lower rates of diabetes, while Alabama, Mississippi, and West Virginia have the highest rates of
7
Colorado, which has the lowest prevalence of diabetes, has a population of which 20.7% are of Hispanic or Latino origin. In contrast, only 3.9% of residents in Alabama are of Hispanic or Latino origin and 26.2% black (U.S. Census Bureau, 2011). While Colorado’s percentage of individuals of Hispanic or Latino origin is significantly higher than Alabama’s, they have similar percentages of total minorities. The two states, however, are on opposites ends of the diabetes prevalence rankings, which emphasizes the fact that while minority status is a factor in diabetes risk, geography and environment play a large role in how likely individuals are to be diagnosed with diabetes. It may be valuable for states with these striking differences to compare health systems and discover exactly what states are doing to fight off obesity and diabetes.
Minorities are at a higher risk of being affected by diabetes for several reasons, including low education and health literacy, lack of health insurance, language barriers, and cultural factors. In 2008, the age-adjusted prevalence of medically diagnosed diabetes among adults aged ≥18 years was 11.0% black and 10.7% Hispanic, compared to 7.0% white, and the prevalence among black females was at 11.4% (Beckles, Zhu & Moonesinghe, 2011). In addition, the age-adjusted diabetes-related ESRD incidence for Hispanics and blacks was 1.5 and 2.0 times higher than for whites in 2006 (Burrows, Li & Geiss, 2010). Among people who did not complete high school, 11.8% were diagnosed with diabetes (up from 9.7% in 2004) and among those who have greater than high school education level, only 6.2% have diabetes (Beckles, Zhu &
Moonesinghe, 2011).
8
lifestyle, have increased health literacy and management of their health, and to be employed. In addition, the increases in prevalence and incidence rates from 2004 to 2008 of diagnosed diabetes between the groups with regards to education level reflect the increase in disparities between the education levels.
Of individuals classified as poor (<1.0 poverty to income ratio), 11.7% have diabetes, while only 5.5% of high-income (≥4.0 poverty to income ratio) adults have diabetes (Beckles, Zhu & Moonesinghe, 2011). The CDC (2001) found that “reproductive-aged women with type 2 diabetes have fewer years of education, lower incomes, and are less likely than women without diabetes to be employed.” Women are more affected by diabetes, with over half of the diabetic population being women (Beckles & Thompson-Reid, 2001). Since more women than men believe that interventions will be effective and that preventive behaviors will produce positive outcomes (Beckles & Thompson-Reid, 2001), this group may be an effective intervention approach. Women may be more open to changes and, depending on the family structure of a household, may be able to encourage successful lifestyle modifications within their families.
9
Both obesity and type 2 diabetes are largely preventable (Mokdad et al., 2003) but the required lifestyle modifications may seem overwhelming to individuals who are overweight or obese. Diet and physical activity habits are subject to time pressures and other priorities, such as taking care of children or working long hours. Overweight individuals increase their
susceptibility to diabetes after additional weight gain (Resnick, Valsania, Halter, & Lin, 2000). However, overweight people who lose small amounts of weight decrease their risk of developing diabetes when compared to overweight individuals who maintain a stable weight: Resnick et al. (2000) found that losing approximately 22 pounds over 10 years was associated with a 33% reduction in diabetes in the next 10 years, relative to stable weight. In addition, Hu et al. (2001) estimated almost half of diabetes cases in overweight and normal weight women could have been prevented with lifestyle changes, such as abstinence from smoking, low alcohol consumption, healthy diet, and exercise (Hu et al., 2001). Obese women who practiced regular exercise and a healthy diet experienced a 24% reduction in risk of developing diabetes (Hu et al., 2001).
Realistic weight loss goals in overweight individuals through dietary modifications and increased physical activity may substantially reduce the risk of diabetes.
Complications of Diabetes
10 Diabetic Retinopathy
Among adults aged 20-74 years, diabetic retinopathy is the leading cause of new cases of blindness (CDC, 2011). The risk for developing proliferative retinopathy is greater in females and by the age of 20, 40-60% of the U.S. population with diabetes will have retinopathy (CDC, 2001). In one estimate, the crude prevalence rates were 40.3% for retinopathy and 8.2% for vision-threatening retinopathy among diabetic individuals (The Eye Diseases Prevalence Research Group, 2004). In the general U.S. population, the prevalence rates were 3.4% (4.1 million people) for retinopathy (Table 3) and 0.75% (899,000 people) for vision-threatening retinopathy (The Eye Diseases Prevalence Research Group, 2004).
Although diabetic retinopathy can only occur in individuals with diabetes, the prevalence of diabetes in the general U.S. population is great enough to make diabetic retinopathy
considered highly prevalent (The Eye Diseases Prevalence Research Group, 2004). Given the aging U.S. population and increasing prevalence of diabetes, the prevalence of diabetic
retinopathy will increase substantially by 2020 (The Eye Diseases Prevalence Research Group, 2004).
11
patients with adequate health literacy, even after adjusting for patient sociodemographics, diabetes education, treatment regimen, and duration of diabetes (Schillinger et al., 2002).
Understanding management and control of the disease is particularly important for diabetes, since it is preventable and can be treated to a degree. In one study, individuals with intensive glycemia treatment had a rate of diabetic retinopathy progression of 7.3%, while the standard therapy yielded a rate of 10.4% (The ACCORD Study Group and ACCORD Eye Study Group, 2010). Considering the high numbers of those affected by diabetic retinopathy, providing intensive care and management for diabetic patients would positively affect many individuals. End-Stage Renal Disease (ESRD)
Patients reach ESRD when they experience kidney failure, requiring dialysis or transplantation; this disease takes up more than 6% of the Medicare budget and has a high mortality rate (Burrows, Li & Geiss, 2010). The National Institutes of Health (NIH) spends $655 million on kidney research and, including costs to other payers and expenses, the bill for treating ESRD is over $35 billion a year (The National Institute of Diabetes and Digestive and Kidney Diseases (NIDDK), 2010). Those affected by diabetes make up the largest component of ESRD patients, with 44% of new cases of treated ESRD in 2006 being due to diabetes (Burrows, Li & Geiss, 2010). Although the health status of many diabetics is already poor, patients with chronic kidney disease are 16 to 40 times more likely to die instead of advancing to kidney failure (NIDDK, 2010).
12
diabetes means that more are living with the condition. The surge of diabetes in the 1990’s also suggests that people have not had diabetes long enough to develop ESRD (Burrows, Li & Geiss, 2010). In addition, the ADA modified the diagnostic criteria for diabetes, allowing less severe cases to qualify as diabetes and thereby increasing the value of the denominator in this equation, or the number of diabetic individuals (Burrows, Li & Geiss, 2010).
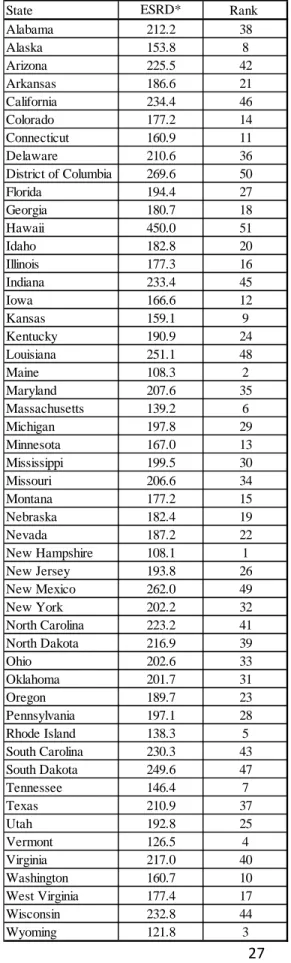
Although ESRD is only one complication of many that diabetic patients may encounter, it is interesting to note the geographical differences in the state rankings of diabetes-related ESRD prevalence and diabetes prevalence (Table 4; CDC, 2011). The differences in the rankings could mean that the differences lie in the treatment of diabetes. For example, Tennessee is ranked at #47 for diabetes prevalence (rankings function from best to worst), but at #7 for diabetes-related ESRD. The relative gap in rankings could mean that while Tennessee has a high number of people developing diabetes, they are able to better manage the disease in order to avoid getting to the ESRD stage. On the other hand, Utah has a low prevalence of diabetes (ranked #3), but it is ranked #25 for ESRD. This difference, in contrast, could indicate that while Utah does not have many residents developing diabetes, it does not have enough systems and treatments in place to effectively handle the individuals who actually develop diabetes and progress to ESRD.
Lower limb amputations
13
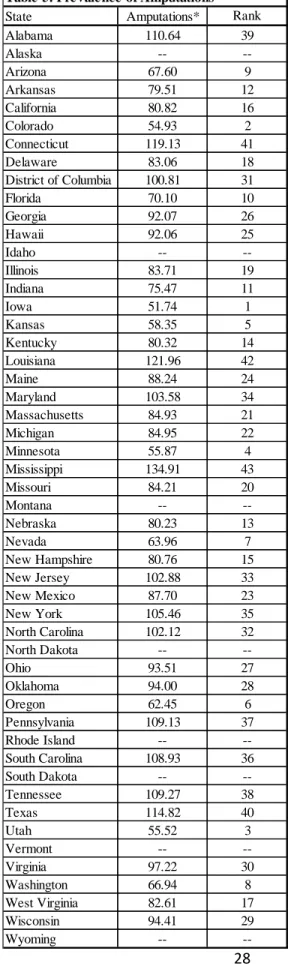
In the U.S., the age-adjusted amputation rate among diabetics is approximately 8/1,000 patient-years with a prevalence of about 3% (ADA, 2003). Amputations among diabetics are indicative of poor glycemic and lipids control (Dorsey, Eberhardt, Gregg & Giess, 2009). Amputations can be considered preventable among diabetics, as early identification and better management would limit the number of severe infections in the lower extremities and
consequent amputations (ADA, 2003). Smoking is considered to be the single most preventable risk factor; tobacco cessation and counseling is critical, as it would limit the complications of diabetes (ADA, 2003).
Non-Hispanic whites are more likely to have adequate glycemic control and blood pressure control than blacks (Dorsey et al., 2009), reflecting similar patterns stated previously. This trend is to be expected, as a higher number of blacks would have diabetes and therefore be at risk for late-stage disease, leading to amputations. However, these continued disparities are disturbing, as it shows that type 2 diabetes and many of its complications are preventable to some extent and that this disease targets those with low health literacy, lower socioeconomic status, and consequently, those with decreased ability to manage their conditions.
14
Deaths from Diabetes
In 2007, diabetes was the seventh leading cause of death in the U.S. (CDC, 2011). The risk of death for people with diabetes is almost double that of their counterparts without diabetes (CDC, 2011). Particularly at older ages, adults face more complications including heart disease, stroke, and blindness, and their relative decline may be faster than for younger patients (CDC, 2011). The Emerging Risk Factors Collaboration group (2011) noted strong positive associations of diabetes with deaths from renal and digestive diseases and infectious diseases, and diabetes was found to be associated with “substantial premature death” from various cancers,
degenerative disorders, and external causes. The Emerging Risk Factors Collaboration group (2011) also observed that approximately 40% of the years of life lost from diabetes can be attributed to nonvascular conditions, including about 10% attributable to death from cancer.
Surveillance and Potential Data Sources
Childhood diabetes
15
2007). Although this estimate and others are useful for ongoing research and prevention efforts, undiagnosed diabetes and presymptomatic disease are not taken into account (Lee, Herman, McPheeters & Gurney, 2006), nor is geographic information available.
Local areas and several countries have taken the initiative to set up childhood diabetes registries, such as the Chicago Childhood Diabetes Registry (Grigsby-Toussaint et al., 2010) and the Swedish Childhood Diabetes Registry (Hanberger, Samuelsson, Lindblad & Ludvigsson, 2008). This method allows researchers to efficiently reach a target population and produce useful results. Grigsby-Toussaint et al. (2010) utilized the Chicago Childhood Diabetes Registry to study how socioeconomic characteristics in Chicago over a 30-year period may relate to
neighborhood distribution of diabetes risk in children. The Swedish Childhood Diabetes Registry was used to examine the relationship between A1c and insulin regimen, duration of diabetes, age, sex, and BMI in adolescents (Hanberger, Samuelsson, Lindblad, & Ludvigsson, 2008). In this national registry, data is extracted from outpatient visits and registered locally in a special childhood diabetes program.
16
acknowledge the epidemic and act as these children enter adulthood and further contribute to the burden of this disease.
Adult diabetes
Currently, the Behavioral Risk Factor Surveillance System (BRFSS) is one of the only state-based monitoring systems for diabetes prevalence among adults. In this telephone survey, participants are asked, “has a doctor, nurse or other health professional ever told you that you have diabetes?” (CDC, 2011). Due to the fact that this database relies on random participants’ responses over the telephone, it is subject to self-reporting bias (of which recall bias is a concern) and is limited to households with telephones.
As cellular phones are becoming more common, the validity of BRFSS is being questioned; in 2009, only about 63% of the U.S. used a landline as a source of phone communication (Mokdad, 2010). Landlines are also facing competition from telemarketers, which could discourage participation and may contribute to the significant decrease of survey response rates over the last 10-15 years (Mokdad, 2010). Despite these challenges, the overall national diabetes estimates between BRFSS and the National Health Interview Survey (NHIS), which includes both self-report and proxy data, were found to be similar, thereby strengthening the reliability of the two surveys (Nelson, Powell-Griner, Town, Kovar, 2003).
17
area analysis focuses on “the experience of the population living in a defined geographic area or the population that uses a specific hospital” (The Dartmouth Institute for Health Policy and Clinical Practice, 2011). The Dartmouth Institute, along with other researchers, uses the atlas for publications and reports, many focusing on the regional differences of various conditions and risk factors. It is useful in providing accurate numbers, such as in finding the percent of diabetic Medicare enrollees receiving a Hemoglobin A1c Test. However, it is limited in that it only provides information regarding Medicare enrollees- excluding those in managed care due to capitated payments- and with regards to diabetes, it only presents data on three screening procedures at the state level (The Dartmouth Institute for Health Policy and Clinical Practice, 2011).
18
The Chronic Condition Data Warehouse presents information from Medicare and Medicaid claims and therefore only reflects those populations. It is a reliable source, as it is driven off of claims data, but only top-level information is accessible through the website. One must either create an account or “request data” in order to receive more detailed information.
The MarketScan Commercial Claims and Encounters Database includes claims data from commercial, Medicare, and Medicaid populations but must be purchased for access. The
Healthcare Cost and Utilization Project (HCUP) / State Inpatient Databases (SID), maintained by the Agency for Healthcare Research and Quality (AHRQ), is accurate and reliable due to the nature of its source, but only contains information from hospitals and 44 states at this time. Although there are many resources available, including ones not mentioned above, creating an easily accessible diabetes registry or other comprehensive methods of tracking would be convenient and provide the most accurate information for interested parties.
Complications from diabetes
Diabetic retinopathy
19
Currently, collaborations such as the ACCORD Eye Study Group and The Eye Diseases Prevalence Research Group focus on diabetic retinopathy and preventing this complication. However, there is little emphasis on tracking diabetic retinopathy for the purpose of
implementing policy change. Diabetic retinopathy could be monitored by creating a state-based registry for those diagnosed with diabetic retinopathy, by adding an additional question
regarding this complication to current surveillance systems, or by using a “cutoff” Hemoglobin A1c level to serve as a marker for diabetic retinopathy (Cheng et al., 2009).
ESRD
Early detection, improved treatments, and better control of risk factors in diabetes must be in place for the numbers of ESRD patients and total diabetic patients to decline. The Chronic Kidney Disease Surveillance System is an on-going project run by the CDC/U.S. Department of Health and Human Services to monitor those with chronic kidney disease. In addition, the U.S. Renal Data System is useful in providing information on the number of patients who have ESRD. These programs are helpful in extracting numbers at the local and state levels in order to promote prevention; particularly due to the nature of ESRD, gathering the prevalence numbers by state is fairly straightforward (Table 4).
Lower limb amputations
Diabetic individuals make up over 60% of people with non-traumatic lower-limb amputations (CDC, 2011). Information regarding amputations is available through the National Hospital Discharge Survey (NHDS), NHIS, and the Chronic Condition Data Warehouse /
20
Warehouse), but it is often overlooked because the prevalence numbers are lower than those of the other complications. However, it is important to note the significance of having a lower extremity removed due to the inability to manage this disease. Healthy People 2020 lists it as an objective: “Reduce the rate of lower extremity amputations in persons with diagnosed diabetes” (DHHS, 2011).
Deaths from diabetes
Death from diabetes is recorded in death certificates and the data is reported by the
National Center for Health Statistics. However, diabetes may be responsible for more deaths than reported, as it is often a co-morbidity and not necessarily the “event” that results in death. Many times, it is underreported: about 35% to 40% of people with diabetes who died had it listed anywhere on the death certificate and approximately 10% to 15% had diabetes listed as the underlying cause of death (CDC, 2011).
Discussion
Diabetes Registry
21
same proportions from state to state: individuals with diabetes over the total number of individuals who visited a clinician in a certain time period.
Peterson et al. (2008) implemented an electronic diabetes registry to support their clinical intervention; a registry would be a useful tool not only for tracking the prevalence, but for
supporting interventions and further research. The study, in which the registry played an integral role by providing functions such as reminders and monthly progress reviews, discovered
statistically significant increases in diabetes process measures between control and intervention practices (Peterson et al., 2008).
As reviewed earlier in the examples of the Chicago Childhood Diabetes Registry and the Swedish Childhood Diabetes Registry, it may be simpler to implement registries in more local or smaller areas. If this is the case, a registry system could be formed at the national level (in order to initiate consistency) but implemented at the county level. These counties could submit registry information to state health departments at a standardized interval, such as quarterly, which can then be rolled up for national estimates.
22
committee is scheduled for release on July 22, 2011 (L. Hernandez, Institute of Medicine, personal communication, July 13, 2011).
Moving Forward
The numbers that reveal the extreme burden of diabetes are staggering. However, a high number of undiagnosed individuals who have developed coping mechanisms to manage their health conditions may exist. Therefore, the burden of diabetes and people living with its
complications may be even worse than presented in research, particularly since BRFSS and other commonly-used tracking methods do not include institutionalized individuals. It may be
worthwhile to increase screening procedures to catch undiagnosed diabetic individuals; in order to make this a valuable practice; however, improved systems must be in place.
23
As outlined throughout this paper, attention must be provided to all facets of the diabetes burden in order for interventions to be effective. A comprehensive view of development and opportunities to improve health and life chances across the spectrum of life must be emphasized (Wise, 2009). Children need resources as they grow, including safe outdoor environments that promote physical activity, proper nutrition, and access to health care. These positive efforts cannot be realized, however, without the emphasis on parents and adults and targeting not just from the bottom-up or top-down, but equally throughout the life span. The complications that arise and deaths that are attributable to diabetes must be properly surveyed in order for the resources to appear.
24
Table 1. Prevalence of Diabetes in Youth Age group
(years) Prevalence*
*Cases per 100,000 youth, 2001
0-9 79
10-19 280
Total 182
25 Table 2. Pre vale nce of Adult Diabe te s
State Prevalence* Rank
Alabama 13,200 51
Alaska 5,300 1
Arizona 11,400 48
Arkansas 9,600 33
California 8,600 24
Colorado 6,000 2
Connecticut 7,300 11
Delaware 8,700 25
District of Columbia 10,900 46
Florida 10,400 43
Georgia 9,700 34
Hawaii 8,300 20
Idaho 7,900 18
Illinois 8,700 26
Indiana 9,800 36
Iowa 7,500 14
Kansas 8,400 21
Kentucky 10,000 38
Louisiana 10,300 41
Maine 8,700 27
Maryland 9,300 31
Massachusetts 7,400 12
Michigan 10,100 39
Minnesota 6,700 4
Mississippi 12,400 50
Missouri 9,400 32
Montana 7,000 7
Nebraska 7,700 16
Nevada 8,500 22
New Hampshire 7,900 19
New Jersey 9,200 30
New Mexico 8,500 23
New York 8,900 29
North Carolina 9,800 37
North Dakota 7,400 13
Ohio 10,100 40
Oklahoma 10,400 44
Oregon 7,200 9
Pennsylvania 10,300 42
Rhode Island 7,800 17
South Carolina 10,700 45
South Dakota 6,900 6
Tennessee 11,300 47
Texas 9,700 35
Utah 6,500 3
Vermont 6,800 5
Virginia 8,700 28
Washington 7,600 15
West Virginia 11,700 49
Wisconsin 7,100 8
Wyoming 7,200 10 Source: BRFSS, 2010
26
Table 3. Prevalence of Diabetic Retinopathy Age group
(years)
Diabetic retinopathy*
40-49 1,380
50-64 3,780
65-74 5,810
≥ 75 4,960
Total 3,400
27 Table 4. Prevalence of ESRD
State ESRD* Rank
Alabama 212.2 38
Alaska 153.8 8
Arizona 225.5 42
Arkansas 186.6 21
California 234.4 46
Colorado 177.2 14
Connecticut 160.9 11
Delaware 210.6 36
District of Columbia 269.6 50
Florida 194.4 27
Georgia 180.7 18
Hawaii 450.0 51
Idaho 182.8 20
Illinois 177.3 16
Indiana 233.4 45
Iowa 166.6 12
Kansas 159.1 9
Kentucky 190.9 24
Louisiana 251.1 48
Maine 108.3 2
Maryland 207.6 35
Massachusetts 139.2 6
Michigan 197.8 29
Minnesota 167.0 13
Mississippi 199.5 30
Missouri 206.6 34
Montana 177.2 15
Nebraska 182.4 19
Nevada 187.2 22
New Hampshire 108.1 1
New Jersey 193.8 26
New Mexico 262.0 49
New York 202.2 32
North Carolina 223.2 41
North Dakota 216.9 39
Ohio 202.6 33
Oklahoma 201.7 31
Oregon 189.7 23
Pennsylvania 197.1 28
Rhode Island 138.3 5
South Carolina 230.3 43
South Dakota 249.6 47
Tennessee 146.4 7
Texas 210.9 37
Utah 192.8 25
Vermont 126.5 4
Virginia 217.0 40
Washington 160.7 10
West Virginia 177.4 17
Wisconsin 232.8 44
Wyoming 121.8 3
Source: CDC's Division of Diabetes Translation, 2011
28 Table 5. Prevalence of Amputations
State Amputations* Rank
Alabama 110.64 39
Alaska --
--Arizona 67.60 9
Arkansas 79.51 12
California 80.82 16
Colorado 54.93 2
Connecticut 119.13 41
Delaware 83.06 18
District of Columbia 100.81 31
Florida 70.10 10
Georgia 92.07 26
Hawaii 92.06 25
Idaho --
--Illinois 83.71 19
Indiana 75.47 11
Iowa 51.74 1
Kansas 58.35 5
Kentucky 80.32 14
Louisiana 121.96 42
Maine 88.24 24
Maryland 103.58 34
Massachusetts 84.93 21
Michigan 84.95 22
Minnesota 55.87 4
Mississippi 134.91 43
Missouri 84.21 20
Montana --
--Nebraska 80.23 13
Nevada 63.96 7
New Hampshire 80.76 15
New Jersey 102.88 33
New Mexico 87.70 23
New York 105.46 35
North Carolina 102.12 32
North Dakota --
--Ohio 93.51 27
Oklahoma 94.00 28
Oregon 62.45 6
Pennsylvania 109.13 37
Rhode Island --
--South Carolina 108.93 36
South Dakota --
--Tennessee 109.27 38
Texas 114.82 40
Utah 55.52 3
Vermont --
--Virginia 97.22 30
Washington 66.94 8
West Virginia 82.61 17
Wisconsin 94.41 29
Wyoming --
--Source: Chronic Conditions Warehouse, 2008
29 Table 6. Prevalence of Diabetic Deaths
State Deaths* Rank
Alabama 26.0 38
Alaska 23.4 27
Arizona 17.4 5
Arkansas 26.5 43
California 21.8 16
Colorado 16.7 4
Connecticut 15.8 2
Delaware 23.4 28
District of Columbia 25.2 36
Florida 21.1 15
Georgia 19.5 10
Hawaii 18.5 8
Idaho 22.7 22
Illinois 21.8 17
Indiana 23.4 29
Iowa 20.5 14
Kansas 22.8 23
Kentucky 24.1 32
Louisiana 33.3 50
Maine 21.9 19
Maryland 23.4 30
Massachusetts 16.6 3
Michigan 26.3 42
Minnesota 19.6 11
Mississippi 21.8 18
Missouri 22.3 21
Montana 23.1 24
Nebraska 23.3 26
Nevada 12.9 1
New Hampshire 20.1 13
New Jersey 24.4 33
New Mexico 32.7 49
New York 17.5 6
North Carolina 23.4 31
North Dakota 28.3 46
Ohio 29.1 47
Oklahoma 29.3 48
Oregon 27.0 44
Pennsylvania 22.0 20
Rhode Island 19.2 9
South Carolina 26.2 39
South Dakota 25.6 37
Tennessee 26.2 40
Texas 24.9 35
Utah 27.6 45
Vermont 24.4 34
Virginia 19.7 12
Washington 23.2 25
West Virginia 35.5 51
Wisconsin 18.3 7
Wyoming 26.2 41
30 References
American Diabetes Association. (2000). Type 2 diabetes in children and adolescents. Diabetes Care, 23(3), 381-389. doi:10.2337/diacare.23.3.381
American Diabetes Association. (2003). Peripheral arterial disease in people with diabetes. Diabetes Care, 26(12), 3333-3341. doi:10.2337/diacare.26.12.3333
Beckles, G., Zhu, J., & Moonesinghe, R. (2011). Diabetes --- United States, 2004 and 2008. Morbidity and Mortality Weekly Report (MMWR), 60, 90-93.
Board on Population Health and Public Health Practice, Institute of Medicine. (2011). A national surveillance system for cardiovascular and select chronic diseases. Retrieved July 7, 2011, from
http://iom.edu/Activities/Disease/SurveilCardioChronicDiseases.aspx
Burrows, N. R., Li, Y., & Geiss, L. S. (2010). Incidence of treatment for end-stage renal disease among individuals with diabetes in the U.S. continues to decline. Diabetes Care, 33(1), 73-77.
doi:10.2337/dc09-0343
CDC's Division of Diabetes Translation. Centers for disease control and prevention: National diabetes surveillance system. Retrieved June 23, 2011, from http://apps.nccd.cdc.gov/DDTSTRS/default.aspx
Centers for Disease Control and Prevention (CDC).National diabetes surveillance system. Retrieved June 22, 2011, from http://apps.nccd.cdc.gov/DDTSTRS/default.aspx
Centers for Disease Control and Prevention (CDC). (2011). Behavioral risk factor surveillance system survey data. Atlanta, Georgia: U.S. Department of Health and Human Services, Centers for Disease
31
Centers for Disease Control and Prevention (CDC), & National Center for Health Statistics, Division of Vital Statistics. (May 2010). Deaths: Final data for 2007. National Vital Statistics Report, 58(19), 101.
Cheng, Y. J., Gregg, E. W., Geiss, L. S., Imperatore, G., Williams, D. E., Zhang, X., . . . Saaddine, J. B. (2009). Association of A1c and fasting plasma glucose levels with diabetic retinopathy prevalence in the U.S. population. Diabetes Care, 32(11), 2027-2032. doi:10.2337/dc09-0440
Committee on Understanding and Eliminating Racial and Ethnic Disparities in Health Care, Institute of Medicine. (2002). Unequal treatment: Confronting racial and ethnic disparities in health care. Washington, DC: The National Academies Press.
Diabetes and Women’s health across the life stages: A public health perspective (2001). Beckles GLA,
&Thompson-Reid PE (Eds.). Atlanta, GA: U.S. Department of Health and Human Services, Centers for Disease Control and Prevention, National Center for Chronic Disease Prevention and Health Promotion, Division of Diabetes Translation.
Dorsey, R., Eberhardt, M., Gregg, E., & Geiss, L. (2009). Control of risk factors among people with diagnosed diabetes, by lower extremity disease status. Preventing Chronic Disease, 6(4)
Evans, W. D., Christoffel, K. K., Necheles, J. W., & Becker, A. B. (2010). Social marketing as a childhood obesity prevention strategy. Obesity, 18(1)
32
Grigsby-Toussaint, D. S., Lipton, R., Chavez, N., Handler, A., Johnson, T. P., & Kubo, J. (2010). Neighborhood socioeconomic change and diabetes risk. Diabetes Care, 33(5), 1065-1068. doi:10.2337/dc09-1894
Hanberger, L., Samuelsson, U., Lindblad, B., & Ludvigsson, J. (May 2008). A1c in children and adolescents with diabetes in relation to certain clinical parameters. Diabetes Care, 31(5), 927-929. doi:10.2337/dc07-1863
Hu, F. B., Manson, J. E., Stampfer, M. J., Colditz, G., Liu, S., Solomon, C. G., & Willett, W. C. (2001). Diet, lifestyle, and the risk of type 2 diabetes mellitus in women. New England Journal of Medicine, 345(11), 790-797. Retrieved from http://dx.doi.org/10.1056/NEJMoa010492
Lee, J. M., Herman, W. H., McPheeters, M. L., & Gurney, J. G. (February 2006). An epidemiologic profile of children with diabetes in the U.S. Diabetes Care, 29(2), 420-421.
doi:10.2337/diacare.29.02.06.dc05-2182
Mokdad, A. (2010). BRFSS powerpoint presentation. Institute of Medicine: Meeting 2. Committee on a National Surveillance System for Cardiovascular and Select Chronic Diseases, Washington, DC.
Mokdad, A. H., Ford, E. S., Bowman, B. A., Dietz, W. H., Vinicor, F., Bales, V. S., & Marks, J. S. (2003). Prevalence of obesity, diabetes, and obesity-related health risk factors, 2001. JAMA: The Journal of the American Medical Association, 289(1), 76-79. doi:10.1001/jama.289.1.76
33
Nelson, D. E., Powell-Griner, E., Town, M., & Kovar, M. G. (2003). A comparison of national estimates from the national health interview survey and the behavioral risk factor surveillance system. American Journal of Public Health, 93(8), 1335-1341. doi:10.2105/AJPH.93.8.1335
Peterson, K. A., Radosevich, D. M., O'Connor, P. J., Nyman, J. A., Prineas, R. J., Smith, S. A., . . . Hannan, P. J. (December 2008). Improving diabetes care in practice. Diabetes Care, 31(12), 2238-2243. doi:10.2337/dc08-2034
Pinhas-Hamiel, O., & Zeitler, P. (2007). Acute and chronic complications of type 2 diabetes mellitus in children and adolescents. The Lancet, 369(9575), 1823-1831.
Resnick, H. E., Valsania, P., Halter, J. B., & Lin, X. (2000). Relation of weight gain and weight loss on subsequent diabetes risk in overweight adults. Journal of Epidemiology and Community Health (1979-), 54(8), pp. 596-602. Retrieved from http://www.jstor.org/stable/25569249
Rosenbloom, A. L., Joe, J. R., Young, R. S., & Winter, W. E. (1999). Emerging epidemic of type 2 diabetes in youth. Diabetes Care, 22(2), 345-354. doi:10.2337/diacare.22.2.345
Schillinger, D., Grumbach, K., Piette, J., Wang, F., Osmond, D., Daher, C., . . . Bindman, A. B. (July 24/31, 2002). Association of health literacy with diabetes outcomes. JAMA: The Journal of the American Medical Association, 288(4), 475-482. doi:10.1001/jama.288.4.475
Scientific Advisory Committee. (2010). America's health rankings. United Health Foundation.
34
Srebotnjak, T., Mokdad, A., & Murray, C. (2010). A novel framework for validating and applying standardized small area measurement strategies. Population Health Metrics, 8(26)
The ACCORD Study Group and ACCORD Eye Study Group. (2010). Effects of medical therapies on retinopathy progression in type 2 diabetes. New England Journal of Medicine, 363(3), 233-244. Retrieved from http://dx.doi.org/10.1056/NEJMoa1001288
The Dartmouth Institute for Health Policy and Clinical Practice. (2011). The dartmouth atlas of health care. Retrieved June 7, 2011, from http://www.dartmouthatlas.org/
The Emerging Risk Factors Collaboration. (2011). Diabetes mellitus, fasting glucose, and risk of cause-specific death. New England Journal of Medicine, 364(9), 829-841. Retrieved from
http://dx.doi.org/10.1056/NEJMoa1008862
The Eye Diseases Prevalence Research Group,. (2004). Causes and prevalence of visual impairment among adults in the United States. Archives of Ophthalmology, 122(4), 477-485.
doi:10.1001/archopht.122.4.477
The Eye Diseases Prevalence Research Group,. (2004). The prevalence of diabetic retinopathy among adults in the United States. Archives of Ophthalmology, 122(4), 552-563.
doi:10.1001/archopht.122.4.552
The National Institute of Diabetes and Digestive and Kidney Diseases (NIDDK). (2010). Chronic kidney disease and kidney failure. Bethesda, MD: National Institutes of Health, U.S. Department of Health
35
The Writing Group for the SEARCH for Diabetes in Youth Study Group. (2007). Incidence of diabetes in youth in the United States. JAMA: The Journal of the American Medical Association, 297(24), 2716-2724. doi:10.1001/jama.297.24.2716
U.S. Census Bureau. (2011). State and county QuickFacts. Retrieved 6/22, 2011, from http://quickfacts.census.gov/qfd/states/
U.S. Department of Health & Human Services, & Centers for Medicare & Medicaid Services (CMS).Chronic condition data warehouse (retrieved data from health indicators warehouse, September 2010). Retrieved July 12, 2011, from http://ccwdata.org
U.S. Department of Health and Human Services. (2011). Healthy people 2020. Retrieved July 12, 2011, from http://healthypeople.gov/2020/
Wise, P. H. (2009). Confronting social disparities in child health: A critical appraisal of life-course science and research. Pediatrics, 124(3), S203-S211.
World Health Organization. (2011). Noncommunicable disease surveillance. Retrieved July 12, 2011, from http://www.who.int/ncd_surveillance/en/