Planning
to
Protect
Water
and
Natural
Areas
Worldwide, thereisa
growing
recognitionfortheneed
tobalance developmentwith watershedprotectionand
waterbasinmanagement.
Any
sustainableeffortmust
recognize theinterdependence of landuse,spatialdevelopment, natural areas
and
water resources. TheChesapeake
Bay Program
providesanexample
of comprehensive,integrated
and
innovativewaterbasinmanagement.
Although notflawless,itcanserve asa
model
forthedevelopment ofotherregionalwatershedprotectionand
management
programs
intheUnitedStatesand around
theworld.Erica
Shingara
INTRODUCTION
Overview
of
water and
naturalarea
management
Urban
sprawl,fragmented
natural areas,and
pollutedair. soil,and
water challenge urbanand
regionalplannersthroughouttheworld.Water
and
naturemanagement
isexceedinglydifficultbecause
these resourceshave
multiple uses, areimpacted by
numerous
pollutionsources,and
intersectjurisdictionalboundaries.
The
traditionalenvironmental planning
approach
totheseproblems
is basedon
the separationof
urban,rural,
and
environmental functionsand
tendstoprimarilyfocus
on
theprotectionof
naturalareas.
However,
this isnot a sustainablemethod
of planning
because
"islandsof naturewillnot survive in asea ofdestructive practices inagriculture
and
urbandevelopmenf
"(Tjallingii.1996, p. 18). Therefore,planning
must
seektoachieve a better balance
between ecosystem and
watershed
integrityand
theprovisionof
human,
social,
and
economic
services. In ordertoaccomplish
this,planningmust
recognizethatproblems
with waterand
natural areas(e.g.,pollution,the
abundance
orshortageof
water, waterquality, impactsof sprawland poor
habitat qualityand
quantity) areinterrelated.Therefore, in orderto balance the need for grovNthwhile
promoting watershed
protection, water basinmanagement
must
recognize the interdependenceof
land use.spatialdevelopment,
natural areasand
waterresources. Forthisreason, aholisticapproach
toplanningisneeded
thatintegrates ecological,spatial.environmental,
economic and
watermanagement
principlesintoplanninginorderto
minimize
the adverse impactsof
development and
land use.There
arenumerous
strategies fornon-point sourceabatement,mitigationof
waterqualityimpacts,
and
the protectionofnaturalareas (Lundqvist.Lohm.
andM.
Falkenmark. 1985):• Regiilalury
approaches
—
nutrient caps, pollution pemiits,crosscompliance,and
riverbasin organizations.
•
Econoinic
iiisfriinienls—
landevaluation, taxes, fees,subsidies,cost
recoverv',
economic
incentives,investmentpolicies,
and
pennittrading.• Analytical tools
—
research, predictive modeling, monitoring,and
project evaluation.•
Management
plans
—
that assess thesocial,educational,legal,administrative, technical,
and
financial factorstocreate arealisticplanfortheoptimal integratedmanaaement
oflandand
waterErica Shingara.
a graduate of
theUniversity
of North
Carolina'sDepartment of
Cityand
Regional
Planning,was awarded
the prize for best masters projectof
the classof
2001.
The
fullprojectcompares
theChesapeake
Bay
Program
with similarwater
and
naturalarea
management
strategiesused
resources(e.g..riverbasin planning
and
tributar\ strategies).
• Spatial
ami
land
management
techniques
—
critical area programs, transferof development
rights(TDRs)
from
sensitiveareasto areas identified forgrowth,riparian stream buffer restorationprograms,transportation planningtodecrease emissionsand
atmosphericdeposition,land acquisition programs, urbangrowth
boundaries,and
subdivisionand
zoningregulations.• Best
management
practicesiBMPs)
—
to decrease runoff
from
agriculture(e.g..nutrientbalance,low-input farming,
economic
incentives, costshare programs,and
education), urban areas(e.g.. separated
sewage
and
stonn water collection systemsand
designsthatdecrease
permeable
ser\icesand
filterpollutants),
and
constructionareas(e.g.. erosioncontroltechniques).•
Education
and
training—
to achieve coordinationof
landand
watermanagement
and
conservation.Combinations of
these strategies areutilizedin
programs
throughoutthew
orldtopromote
integrated land,water,and
environmentalconsenation
and
management.
Cases
illustratingthecomplexity
of watershed
management
and
theuseof
innovativemanagement
strategiesare evidentinEurope
and
the United States, bothof which
facegrowing watershed
management
challenges.This article
examines
the interstatewatershed
management
framev\orkof
theChesapeake
Bay
Program, which
consistsof
federal,regional,state,
and
local initiatives.The
followingsectionprovides anoverview
of
theChesapeake
Bay
Program and
identifiesthe three
main
common
threats towaterresources
and
natural areas: !) excessnutrients; 2)poor
habitat qualityand
quantity:and
3)development
pressures.Next, the paperidentifiesthethree
main
environmental planningthemes
thatguide planningand
management
efforts inthe
Chesapeake
Bay: 1)pollutionreduction: 2) naturalareaprotection
and
restoration:
and
3) sustainable development.For
eachof
these themes,the strategies used topromote
thesethemes
are described and.when
permissible, the effectivenessofthe strategies is
alsodescribed.
The
finalsection evaluatestheChesapeake
Bay
Program and
identifiesstrengths
and weaknesses of
its strategies, as well as the strategies thatmay
be transferable to otherv\atersheds in the United Statesand
around
theworld.This
examination
of waterbasinmanagement
programs implementing
comprehensive
(i.e..encompassing
variouspollutant sources), integrated(i.e..across jurisdictionalboundaries
and
policyfields),and
innovative
management
strategiesisimportantfor the future
advancement
in watermanagement.
The
analysispresented heredoes
notpro\ideacomprehensive
blueprint forwatershed
management;
conditionsvary toomuch
from watershed
towatershed
forthis tobe possible,and
therefore policiesand
programs
must
betailoredtothe specificenvironmental, geographic,hydrologic.economic,and
politicalcircumstances of anarea. Thisanalysis only attemptstoprovidean over\ iew
of
available toolsand
a generalframework
foreffective water basinmanagement.
Overview
of
theChesapeake
Bay
The
Chesapeake
Bay
exemplifies a largescale,innovative,highprofile
program
withmulti-jurisdictional
commitment.
The
Chesapeake
Bay
is located alongthe central eastcoast
of
the United Statesand
isthe U.S.'s largest estuary with aw
atershedthat coversmore
than64,000
square milesand
extendsoversix states—
Mary
land.Virginia.Pennsylvania.New
York.West
Virginia,and Delaware
—
and
the Districtof
Columbia.
The
main
body
ofthebay
isroughly
200
mileslong,with anirregularshorelineapproximately 4.400 milesin length
and
a surface areaexceeding
23.000 square miles(Moreau.
1997).Land
use withintheapproximately
50 major
tributaries:themain
tributarybasinsincludetheSusquehanna,
Potomac,
James,Rappahonnock. and
York
Rivers(NASDA.
1997). Inaddition,it includes1.650local
communities
consistingofapproximately 15.1 millionpeople
(CBR
1999).Inreactionto
emerging
environmental problems, theChesapeake
Bay
Program
was
formed
in 1983 topromote
interstatecooperationbetween Maryland.
Pennsylvania.Virginia,and
the District
of
Columbia.
The
Chesapeake
Bay
Program
hasevolved
intoanationallyrenowned
regional
program
thatworks
inconjunctionw
ithfederal regulations, the
Chesapeake
Bay
Agreement,
stateprograms,and
individuallocalgovernments.
Threats
towater
resourcesand
natural areasThe
Chesapeake
Bay
faces anumber
of
threats to water resourcesand
natural areas thatpresentchallengesto spatial,environmental
and
waterplanning.The
threemain
threats towater resourcesand
nature areas are pollutionand
eutrophication.poorhabitatqualityand
quantity,and
development
pressures.Excessnutrients
The
excessof
phosphorus
and
nitrogennutrientsareacriticalpollution
problem
forboth theChesapeake
Bay
region.Excess
nutrients contributetoeutrophication.which
isthe increasein algae growth, followedby reduced
oxygenation,lower
watercolumn
transparency,and
decreased waterquality that result inadverse ecological consequences.
Excess
nutrientsoften resultfrom
theovertlow of
combined sewage
systems, urbanrunoff, industry. sIuha'and
silageseepage,and
runofffrom
agricultural areas.Studies
of
thebay
demonstratethat atmospheric depositionand
diffuseland discharges are the largest sourcesof
nutrient pollutantsaffectingwaterquality(CBP.
1999b: Correll.Jordan,and
Weller. 1992).For
example,
in
1996
diffusesources contributed66
percentof
thephosphorus
loadand
57 percentof
the nitrogen loadtothe bay.Whereas,
atmospheric depositioncontributestoapproximately 9 percent ofphosphorus
and
21 percentof
nitrogenenteringthebay
(CBP.
1999). Importantnonpoint sources include runofffrom
agriculture,construction sites,
and
urban areas. Therefore, effectivelanduseand environmental
planning controls arerequired toreducenutrient lossestotheenvironment.
Poor
habitatqualityand
quantityPoor
habitat qualityand
quantitypresent another important challengetoplannersintheChesapeake
Bay
basin.The
Chesapeake
Bay
isfacingthe lossof important
woodlands
and
wetlandswhich
function ascriticalhabitatand
alsopreventpollutantsand sediment from
enteringtributariesand
reachingthe bay.Approximately
59 percentof
thebay
basin isforested:
however,
forestsare lost ata rateof
about 100
acres perday
due
tosuburban
development and
populationgrowth (Chesapeake
Bay. 1998). In addition, the
Chesapeake
Bay
regionhasmore
than 1.5 millionacresof
wetlands;however,
populationgrowth and
development
pressures threaten these wetlands.For example, between 1982
and
1989, 5 acres peryearof
estuarinewetlandsand
3.000acres per yearoffreshwaterwetlandswere
lost. Therefore,futureprotectionandrestorationofexistingand degraded wetlands andforestsareessential.
Development
pressuresPopulation
growth
and
development
pressure are significant threats to theChesapeake
Bay. Populationgrowth
triggersthedemand
fordevelopment which
resultsin the lossof
wetlands,forests,and
agricultural lands.Unmanaged
development
also resultsinincreased impervious surfaces
and runoff
sprawlingdevelopment
patterns,and
inefficienttraffic
pattems
that increase vehicle milestraveled
and
airpollution(USGS.
1999).The
Chesapeake
Bay
region willexperiencesignificantpopulation
growth
withinthenexttwo
decades
and
thereforeofficialsmust
conscientiouslyplan for thesustainable
development
ofthe area.The
Chesapeake
Bay
is experiencingrapid populationgrowth
that threatens natural areasand
water resources. Forexample,
between
watershed
grew
by 28
percentto 15.1 millionand
isexpectedtogrow
to 18 million b\2020
(CBP.
1988).This populationincrease isexpectedtospurtheconstruction
of
1.7millionnew
homes
in the region,which
under
currentdevelopment
patterns willconsume more
than636.000
acresofforestand farmland and
thus significantlyimpacttheba\"snatural resources(CBP.
1999b). Furthermore, vehicle milestra\eled has increased 117 percent
between
1970
and 1997
and
isexpected
tofurther increasewithintensifieddevelopment (CBP.
1999b). Therefore,theregionmust
strive topromote
etficientgrowthpatternsand
transportations\stemstoreducelandconsumption.
\ehiclemilestraveled,andpollution.
Finally,theloss
of
wetlands, forests,and
agricultural landstosprawl impactsthe healthof
ecosystems
(USGS.
1999).Because
each land usechange
generatesnumerous
en\ironmental repercussions, thechoicesof development
t\pe.location,density,constructionmethods, design
and
way
of
conducting day-to-da\ acti\iiies are fundamentalinachievingsustainabledevelopment
(Rogers. 1992).Although
incrementallandusedecisions, likedraininga smallwetland,encroaching
on
a stream,and
clearing a forestappeartohave
limited impacts, the cumulative impactof
thesechanges
canpose
severeenvironmentalconsequences
on
a largerscale.
Moreover,
sincetheeconomy
of
theChesapeake
Bay
regionrelies hea\ilyupon
the healthand
vitality oftheenvironment, itis\er\ importanttoplanforsustainabledevelopment
in orderto protect, preserveand
restore the water resourcesand
natural areas.THE
CHESAPEAKE BAY
PROGRAM
Overview
of themanagement program
Between
1950
and
1970.downward
trendsinwaterquality
and
fisheriesattractednational attention totheChesapeake
Bay. In 1965. the U.S.Army
Corp
of
Engineersbegan
acomprehensive
studyof
thebay
that focusedon
navigation,fisheries,flood control,noxious weeds, waterpollution, waterqualit>. beach erosion,and
recreation(Moreau.
1999). Subsequently, theChesapeake
Bay Program
(CBP) was
authorized in 1975.Under
theCBR
the U.S.Environmental
ProtectionAgency was
giventhe authority toadministera tlve-year.$27
millionstudyof
thebay
toexamine
waterqualityproblems
and
thenrecommend
amanagement
plan forrestoration.
In 1980.the legislatures
of Maryland.
Pennsylvania.Virginia,
and
the DistrictofColumbia
established theChesapeake
Bay
Commission
(CBC)
topromote
interstatecooperation.
The
CBC
established theChesapeake
ExecutiveCouncil
to assessand
manage
theimplementationof
coordinatedplans, establishedanimplementationcommittee
tocoordinatetechnicalmatters
and
planpreparation,
and
created a liaison office forBay
activities. Responsibilities
of
theCBC
include: 1)identityingconcernsrequiringinterstateaction; 2)
recommending
legislativeand
administrative actionsneeded
to respond tothose concerns: 3) keepingthe legislaturesproperlyinformed
about the regionand
itsresources; 4)representingthecommon
interestofthe statesinactivitiesinvolvingthe federal
government; and
5)
prov iding a
forum
fortheresolutionof
interstateconflicts
(Moreau.
1999).The
firstChesapeake
Bay Agreement was
signedin 1983.initiatinga regional partnershiptorestorethe bav
(Chesapeake Bav
Implementation
Committee.
1988).The
major
participants intheprogram
includethestatesof
Mar\
land.Pennsylvaniaand
Virginia; the Districtof
Columbia;
theChesapeake
Bay
Commission
(a tri-stategoverning body);the U.S.
Environmental
ProtectionAgencv (EPA)
(representing the federalgovernment);
and
citizenparticipation. Inaddition,asecond
Chesapeake
Bay Agreement was
adopted
in1987 and
amended
in 1992. Thisagreement
establishedanoverallvisionforprotectingand
restoringthe bay.includingthemain
goalof
reducing nitrogenand
phosphorus
loadingsby 40
percentby
thevear2000. Finally, inJuneof
2000
theChesapeake
Bay
Program
signed thenew Chesapeake 2000 Agreement
to guide restoration effortsthroughoutthe next decade.county,
and
localgovernments
withintheChesapeake
Bay
watershedhave
initiatedeffortsto protect the bay.
One
ofthe importantaspects ofthe
program
isthe increasedeffortby
local
governments and
watershed organizationstoreducepollution,monitor
neighborhood
waterquality,
and
restore habitattoimprove
the bay.Local
governments
alsoplayavitalrolein addressingthe effectsof land useand poor
spatial
development
patterns (e.g..congested
roads, costly public services, thedecline
of open
space, destructive land usesand
the deteriorationof
thelocal environment). Localgovernments
contributetothe success
of
restoration,and
therefore theprogram
continuestofocuson
theirparticipation asthe
key
tothemanagement
of land usein thewatershed.Since its
commencement,
theChesapeake
Bay
Program
has creatednumerous
environmental
and
landuse policies toencourage
sustainabledevelopment and
bayrestoration. Forexample,
in 1995 theLocal Governnieni
Parfiiership luitialivewas
established to coordinatethe restorationeffortsof1.650 localgovernments
withintheBay
watershed. Also, in1996
theLocal
Govenvnent
Participation ActionPlan
and
the Priorities forAction
for Land.Growth
and
Stewardship
in theChesapeake
Bay
Region were adopted
to address land usemanagement, growth and
development,
streamcorridor protection,and
infrastructureimprovements.
These
programs
have
identified three basicmanagement
themes
that local
governments
can use toprotectthebay
(Allen
and
Hall. 1999):/.
Land management and
stewardsliipinvolvesreducing resource
consumption
and
costlysprawldevelopment
patterns by encouragingthe revitalizationof
existingcommunities,theprotectionof agriculturaland
forested lands,and
sustainabledevelopment
patternsin ordertoprotectimportantenvironmental areasand
waterquality.2.
Stream
corridor protectionand
restoration involvescoordinating
and
supportingeffortsto protect,enhance.and
restore wetlandand
forest buffers importantfor filteringsedimentand
nutrientsbefore reachingthe bay.
i. Infrastructure
improvements
involve upgrading,maintainingand
inspectingsewage
treatmentplantfacilities,stonnwater
management
infrastructureand
septic systems.The
CBP
isconstantly seekingways
toimprove
existingprograms and
dealw
ithemerging
challenges.The
CBP
continues tomonitorthe effectiveness
of
policies, researchand develop
new
policies aswellasimprove
existingpolicies,and
convey
theprogram's
goals,policies,
and
restoration statustothe citizensof
the region.Strategies for
water
resource
and
naturalarea
protectionThe
followingsection highlights several importantstrategies utilizedby
theChesapeake
Bay
Program
topromote
threemain
environmental planning themes: 1)nutrient
reduction; 2) natural areaprotection
and
restoration:and
3) sustainabledevelopment.
.\ulrientReduction
To
achievethe40
percentnutrientreduction goal, theChesapeake
Bay
Program's
overall strategyistodesignand implement
acomprehensive
systemof
controlsand
BestManagement
Practices(BMPs)
with considerationofthetypeof
pollutants,theirsources,
and
otherenvironmental,physical,and
socialconditionsthataffectwaterquality'. This broadstrategy balancesregulations with incentive-based
programs and
delegatesimplementationtothestatestoallowflexibilityto
tailor
programs
tomeet
state-specific needsand
conditions.
Under
thisframework,
theBay
Program
focuses on reducingnutrientsfrom
both agricultureand
urbanareas.Agriculture
Agriculturecovers
approximately
30
percentof
the total surface areaof
theChesapeake
Bay
the nutrientsentering the ba\.
The
nutrientsare aresuhof excess chemical fertilizers, animalmanure, sewage
sludgeusedon
tlelds.and
animal wastesthat run offfeedlotsand
pastures.Some
ofthemain
strategiesused toreduce nutrientsfrom
agriculturesources includethepromotion
ofsustainablefanningpractices, nutrientmanagement
programs,incentive programs,and
tributary strategies.Sustainable
farming
practices:There
are variousprograms promoting
bestmanagement
practices(BMPs)
and
bestmanagement
systems
(BMSs)
to resolve waterqualityproblems
inthebay watershed
and
promote
sustainable agriculture.BMPs
are awide
variety of techniques designedtomore
eftlcientKand
effectively practiceagricultureand
toreduce runoff(NASDA.
1997). Forexample.
BMPs
includevegetatedbufferstrips,conservation tillage,streambank
fencing,stripcropping, alternativelivestockwatering systems,and
animalwastehandling, storage, transportation,and
useasfertilizer. Additionally,resourcespecialistsadvocatethe
combination
of
variousBMPs
and
nutrientmanagement
plansfora bestmanagement
systemsapproach
tomore
effectivelyreducenutrients
and improve
production.For
example,thismay
includecombining
conservationtillagepracticeswith grasswaterways,strip-cropping,diversions,streamsidebuffersandanutrient
management
plan.E.xamples
of
stateprograms
promoting
sustainable agriculture areseen inMaryland
and
Virginia.Mar\
landencouragestheadoptionand
implementationof
BMPs
by
offering arangeof
financialand
technical resourcesto fanners throughtheMaryland
AgriculturalWater
Quality Cost-ShareProgram
(MACS)
(NASDA.
1997).MACS
provides fanners with educationand up
to 87.5 percent
of
thecostto install arangeof
eligible
BMPs
toprotectwaterquality, suchasanimalwastestoragefacilities,gradestabilization structures
and
grassedwaterways.
In addition, there aremore
than850,000
acresmanaged
under
certifiednutrientmanagement
plansand
more
than400
individualscertifiedtoprovidemanagement
services to fanners.Virginia's AgriculturalStewardship
Act
(ASA)
created aprogram
inwhich
theDepartment
ofAgriculturaland
Consumer
Ser\ices(DACS)
works
with fannersand
'ocal Soiland Water
Conservation Districts(SWCDs)
toresolvewaterqualityproblems caused by
sediment,nutrients,and
pesticidesfrom
agriculturaloperations
(NASDA.
1997).Under
theprogram, the
DAC
receivescomplaints alleging specific agriculturalactivitiesarecausing waterpollutionand
theninvestigatesand
overseesmitigation.
The
program
provides awide
varietyof
means
and
BMPs
forfarmers tocorrectwaterquality
problems
beforeenforcement
action isdeemed
necessary. Forexample,
afarmermust
create a planwith "stewardshipmeasures" and
an implementation scheduletoprevent waterpollution.The
planmust
include a tractmap.
affected water feature designation,soilmaps,
and
astatementof
pollutionproblems. Thisprogram
allowsthe opportunity forcitizensto identify waterquality problemsandthenprovidestechnical, financial,andlegalsupporttofannerstoresolve theproblems.
Nutrient
Management
Programs:
Because
ofthehigh levelsof
nutrientsfrom
agricultural lands.CBP
and
stateshave
placedsignificantemphasis on
nutrientmanagement
programs.The
purpose ofnutrientmanagement
programs
istobalancenutrientinputs
and
outputsby
determiningtheamount
of
fertilizerrequired basedon
factorssuch assoilcondition,croprotation,
and
BMPs
in use. Thismaximizes
thebenefitsoffertilizers
and
minimizes
theimpactson
waterquality.With
a goalof
placing3 million acresof farmlandunder
nutrientmanagement
programs
by 2000.theCBP's
nutrientmanagement
strategy hasbeen
regarded asone
of
themost
successful in thenation(CBP.
1997).Different states within the
Chesapeake
Bay
regionhave developed
theirown
nutrientmanagement
programs.For
example.
Pennsylvaniacreated the Nutrient
Management
Law
in 1993
tostrengthenmanure management
standards in ordertoreduce loads
from
livestock. Also, in 1998Maryland
passedtheWater
QualityImprovement
Act,which
isregardedas the
most comprehensive
nutrient1997).
The
Act
requireslandowners
with nutrient application greaterthan 10 acres,farm operations grossing$2,500
ormore
annually,or livestockoperations withmore
thaneightanimalunits' toprepare nutrient
management
plans.Maryland
providesfinancialassistance,technical assistanceand
softwarepackages
to aid fanners(MD
Department of
Agriculture, undated). Inaddition.Virginia offersstate tax credits as incentivesto farmersto
develop
nutrientmanagement
plansand
topurchasenutrient applicationequipment (CBP. October
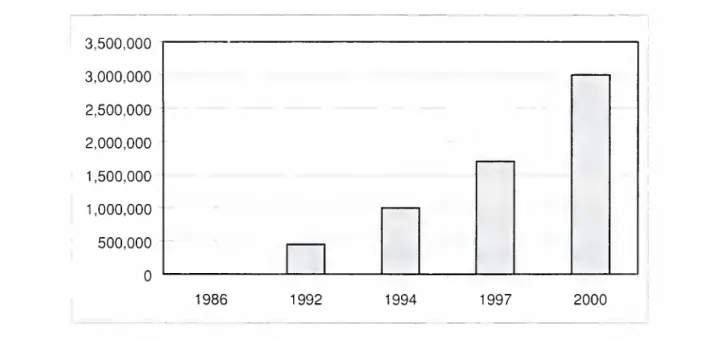
1997).The
number
of
acresunder
nutrientmanagement
plans isan indicatorof
the progress ofnutrientmanagement
programs. Figure 1illustratesthatsince
program
inception in 1986.more
than 3 millionacresare projectedtobe undernutrientmanagement
by
2000.Incentive
Programs:
Sustainable agriculture practicesand
nutrientmanagement
programs
often present high upfront coststofanners. Therefore, there are
numerous
incentive-basedstrategies, in particularcost-share
programs
for agriculturalBMPs,
toencourage
farmers toimplement
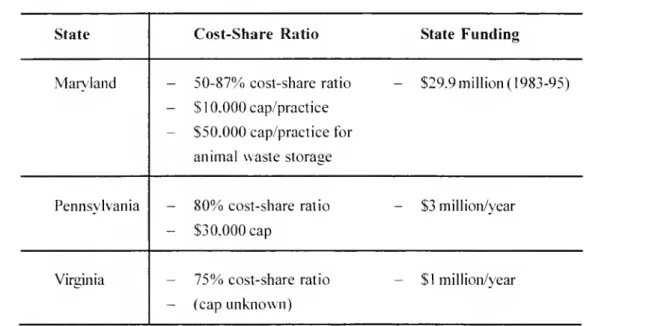
better agricultural practices.Funding
forcost-shareprograms
comes
from
federal agenciesas wellasstate appropriations. State
and
federalcost-share
programs
assistfarmers withthe costs ofinstallationasanincentivefor participation, usually
inratiosrangingfrom80:20. 75:25. orin
some
cases such asPennsylvania's streambank fencing program, 100percent
(CBP.
October 1997). Figure 2 illustratesthecostshareratiosand funding allocationsfor statecost shareprograms.Trihiitary Strategies:
Many
strategieswere
too general to effectivelymeet
the40
percent reduction goals. Therefore, in1992
theChesapeake
ExecutiveCouncil
created theframework
fortributary strategies inorderto address theneed
foramore
areaand
source specific approach. Tributary strategies are basin-specific nutrientreduction plansdesigned foreach ofthe tenmajor
tributaries inthe bay.They
aredesigned totakeintoaccount the watershed's unique physiographicfeatures(e.g.. hydrology,soil,and
landuse), politicalclimateand
institutional structures.The
strategieswere
specificallycreatedtodeal withthe variation in loadingsbyjurisdiction.
and
they alloweach jurisdictiontoestablishtailored,comprehensive
nutrientreduction strategies thatbalance regulatorycontrolswith incentive-based programs. Tributary strategies address three primaryareasfornutrientreduction: 1)wastewater
treatment plants upgradestoincorporate the
BNR
3,500,000
3,000,000
2,500,000
2,000,000
1,500,000
1,000,000
500,000
1986
1992
1994
1997
2000
State
Cost-Share
Ratio
StateFunding
Maryland
-
50-87%
cost-share ratio-
$10,000
cap/practice-
$50,000
cap/practice for animalwaste
storage-
$29.9million(1983-95)Pennsylvania
-
80%
cost-share ratio-
$30,000
cap-
$3million/yearVirginia
-
75%
cost-share ratio-
(capunknown)
-
$1 million/yearFigure2: Cost-Share
Program
Allocations(Source: CBP. October 199 b).process:2) agricultural
BMPs:
and
3)urban stonn waterBMPs
(CBP.
1994).Another key
component
of
alltributary strategies ispublicinvolvement
to increaselocalcommitment
tothe bay's restoration. Inparticular, thereis
emphasis
on consensus
building
among
major
stakeholders,suchas farmersand
the larger agriculturalcommunity,
as away
toincreaseownership of
theplanamong
constituencies
and encourage
participationduring implementation stages.However,
lackof
authorityand
resourcesand
unclearrolesand
missions presentsome
weaknesses of
thisapproach (CBP. October
1997). Nevertheless,the statescontinueto support this
framework
withthe beliefthat localsupport, locally tailored
strategies,andcollaborationwillsignificantly
enhance
the long-term effectivenessand
sustainabilityof
watershedbased
nutrient reductions(CBP, October
1997).Another
important aspectof
the tributary strategiesprogram
istheintroductionofnutrient trading inorderto address differences inthe cost-effectivenessof
nutrientreduction strategiesamong
varioustributaries.Because
some
tributaries, liketheSusquehanna
Tributar}'Strategy,fall shortof
meeting
therequired40
percentnutrientreductions, nutrienttrading
was
introducedtocompensate
forthisshortfallby
recognizingtheincreasedreductionsin othertributaries
(CBP.
October
1994). Therefore,a1
992
Agreement
allows for reallocationsof
the40
percent goaltoother tributariesoutsideof
theSusquehanna
basin(CBP.
1994). All statesare consideringeffluenttradingprograms
buthave
not yetformallyinstitutionalizedthenecessaryframework.
Lrban
waterNutrients
from
urbanareas originatefrom
municipalwastewater
treatment plants,sewer
overflowsand
runofffrom
urban areas (e.g..lawns,
roadwavs.
and
otherdeveloped
areas)(NASDA.
1997).Urban
bestmanagement
practices
and wastewater
treatment plant upgrades are strategies used to decrease nutrientsfrom
urban areas.Urban
bestmanagement
practices includeerosionand
sedimentcontrolson areasunder development
and stormwater
controls indeveloped
areas.These
practicesareappliedby
industrial,commercial,
and
residentialfacilitiestomanage
stormwater management, and
septicsystem
maintenance.Wastewater
treatmentplantupgrades
are another primar\ control strategytoreducenutrients.For example. BiologicalNutrient
Removal
(BNR)
technology,anadvanced
nutrient
removal
system, hasbeen
installed in43major wastewater
treatment plants in theChesapeake
Bay
basin. Currently.48
percentof
the flow is treatedby
BNR
and 64
percentof
theflow will betreatedusingBNR
afterthe full impleinentationof
TributaryStrategies. Thiswillleadtoaconsiderable decrease in nutrient loads
from
municipalwastewater
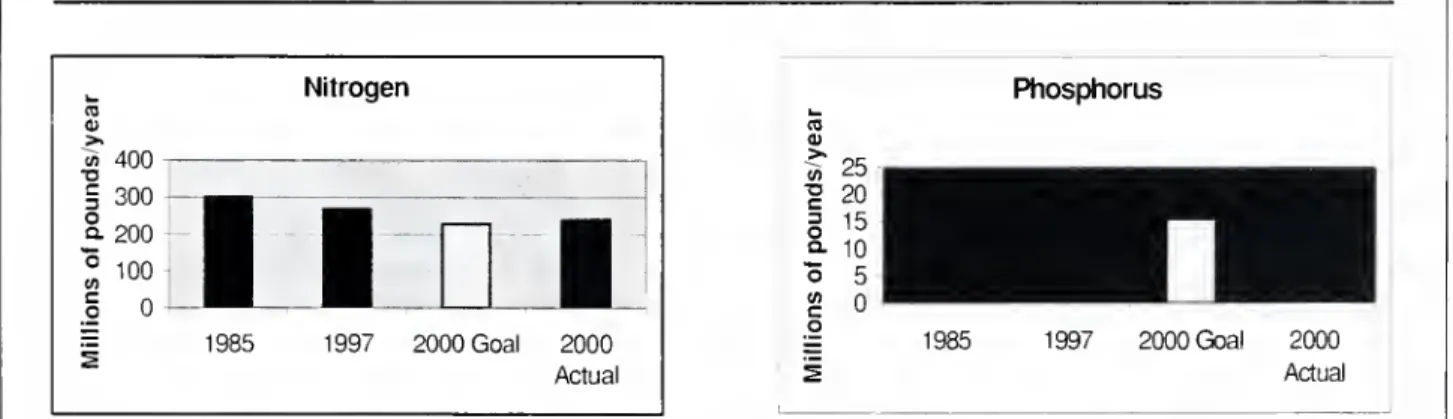
treatment plants.Effectivenessofnutrientreductionstrategies
In 1997. the
CBP
completed
acomprehensive
waterqualityassessment
toevaluateprogress
toward
the40
percentreductiongoal. Figure3 illustratesthereductions innitrogen
and
phosphorus
between
1985and
2000.Phosphorus
loadsdeclinedby
6 millionIbs./yr
between
1985and 1998
(mostlydue
toaban
on
phosphates indetergents)and
the40
percent reduction goalwas
satisfied.However,
nitrogen loadsdeclinedby 42
millionIbs./yrand
the40
percent reduction goalwas
fwtsatisfied.Therefore greater
emphasis
must
be placedon
reducingnitrogen loads.Natural area
protectionand
restorationThe
Chesapeake
Bay
relieson
coordinated publicand
private actionstoprotect forestsand
wetlands in the bay"s watershed. Strategiesused to protect
and
restore natural areas are the Riparian Forest BufferInitiative, preservation programs,and
theWetlands
Initiative.Riparian Forest Buffers Initiative
Protectingriparian forestbuffersthrough
acquisition,easements,and
development
regulationsisimportant forwater resourceand natural areaprotection. Nearly 50percentofthe bay'sriparian- forestshave been converted to
other landuses ordegraded. Itisimportantto
protect andrestore riparian forest buffersbecause theyfilterpollutantssuchasnutrients,sediment, andpesticidesinsurfaceand groundwater, and reduce
downstream
impacts forfloods(CBP.
March
1999). Nutrientand sedimentreductionsof 30 to90
percentcan occurwhen
runoft'andgroundwater
passthrough riparian forest buffers.Inaddition,riparianbuffersarerecognizedasan effectivecontrol
measure
tomaintainstreambank stability,enhance
andrestorestreamhabitat,providecorridorsfor wildlife,and providecooler watertemperatures,leaflitter,
and
coverforaquatic species.
With
over 111,000milesof
perennialand
intermittent streams in the
Chesapeake
Bay
watershed, protecting riparian forestbuffers is achallenge. In 1996. a Riparian Forest Buffers
Initiative
was
adoptedtoincrease riparianbuffers'
on
2,010 milesof
streamand
shorelinein the
watershed
by theyear2010
(CBP,
1999a).Inordertoreachthis goal.
Maryland and
Pennsylvaniawillrestore600
miles.Virginiawillrestore
610
miles,and
D.C.and
federal landsPhosphorus
1985 1997 2000Goal 2000
Actual
willrestore
200
milesof
riparian forest buffers.As
partofthis initiative, theChesapeake
Bay
Program and
signatory jurisdictionsre\iseor adoptlocalzoningand
subdivision ordinances,comprehensive
landuseplans,and
regionalor watershedstonnwater
management
plans torestore riparian buffers. Additionalrestoration
effortsinvolvesmallgrantprograms,
federal-statepartnershipssupportingConservation
Reserve
Enhancement
Programs,
cost-share programs.ta,\ breaks,easements,and
acquisition.
The
resultsof
restoration effortsare promising.Between
1996
and
2000.appro.ximately711 milesofriparianforestbuffers
were
restored,which
is35 percentof
the2010
restoration goal.
Preservation
programs
The
Chesapeake
Bay Program
seeks topermanently
preservecriticalenvironmental areasand
relieson
public-privatepartnershipstoachievethisgoal.
The 2000
Chesapeake Bav
Agreement
guidesthe nextdecade of
restorationin the
Chesapeake
Bay
watershed. Thisnew
agreement
hascommitted
members
to"...permanently preserve
from development 20
percent ofthe landarea inthewatershed by
2010" (CBP.
December
2000). This goal translatesintopermanently
preserving 7.783.856 acresfrom development.
The
CBP
plans topermanentK'
protectthislandthroughperpetual conservation oropen
spaceeasement
or fee ownership, heldby
a federal, state,or localgovernment
or non-profit organization.It isestimated that6.688.757 acresare currentlypreserved
by
allsignatory jurisdictions.Of
thistotalamount,
approximately2.116.305acres are
owned
by
the federalgovernment.
4.209.227 acres areowned
oreased b\ the stategovernments.
282.29
1 acresareowned
by
thelocal
government, and
80.934 acresareowned
oreasedbv'nonprofit or otherprivate sources. Subtracting
from
theacresof
landalready preserved, there areanadditional 1.095.099acres remainingtopreserve inorder to
meet
the20
10goal.The
Wetlands InitiativeNearly 1.5million acres
of
wetlandsoccupy
the
Chesapeake
Bay
watershed, but increasing populationand
development
pressuresare degradingand
destroying bothtidaland
nontidal wetlandsin all oftheChesapeake
Bay
states(CBP. undated
a).The Chesapeake Bay
Program
has recognizedthe importantrole that wetlands playinthe overall healthof
thebay
and
itslivingresources
and
hascommitted
itselftoprotecting
and
restoringwetlands. In 1988.theChesapeake
Bay
Program developed
theWetlands
PolicyImplementation
Planwhich
established a
"no
net loss"goal forthe watershed.The
plancalled forfosteringthe protectionof
wetlands through fourstrategies: 1)theinventory
and
mapping
of
wetlands; 2) the protectionof
existingwetlands:3) therehabilitation
and
restorationofdegraded
wetlands:and
4)educationand
research. Inaddition,in 1
997
theCBP
developed
strategiestoidentify
and
trackwetlands intheChesapeake
Ba\ watershed
toachieve a netgain in wetlands acreageand
to assist localgovernments and
watershed groups
inwetland
management.
Mar\
land.Virginia,and
Pennsylvaniahave
tidal
and
nontidalwetlandsprograms
tohelpdevelop
policiesand
regulationstoward
wetland protection. In addition,the stateshave
taken stepstoprotectwetlandsbeyond
theregulatory programs. For example, in1996
Maryland
established a60.000-acrewetlandsnet-gain goal,and
Pennsylvania hasstrictermitigationrequirements
under
theirregulatory wetlands program. In orderto assist the stateswith wetlandsprotection, the1997
Chesapeake
E.xecutiveCouncil adopted anadditionalwetlands policy designedtospeedthe restoration
and
protectionof
wetlands in theChesapeake
Bay
basin.Under
Directive 97-2.Wetlands
Protectionand
RestorationGoals,theCBP
focusesefforts forachievingno-net-lossof
wetlandsand
tomove
toward
a netgain in theChesapeake
Bay
watershed.Under
Directive 97-2, theCBP
and
itspartners arecommitted
tocomplete
and
publishwetlandsstatus-and-trends reportseverv five vears.todevelop
statepreservation
and
restoration,and
todevelop
qiiantitlabiewetland restoration goals. Despite
these efforts to protect
and
restorewetlands,however,
wetland lossstillcontinues.Effectivenessofnaturalarea protection
and
restoration
With
more
than90.000
acres(150 squaremiles) of
open
landconsumed
annuallyby
growth
in theChesapeake
Bay
States, the protectionand
restorationof
natural areasisincreasingly importantaswellas challenging. Public andprivateinstitutions
have
unitedtoprotect
and
restore riparian forest buffers, preserxe important environmental areas,and
stop wetland degradation.The
resultsofcurrent efforts arepromising,butcontinuedfuture supportisrequired. In ordertomeet
itsgoals, theprogram
must
restore 1.299 acresof
riparianforests,preserve over 1 million
more
acres ofland,
and
continuetostriveforanetgain in wetlands. Thiswillrequire significantcooperation
and
commitment
from
national, state,and
localgovernments and
nonprofits.Sustainable
Development
To
promote
sustainabledevelopment,
theChesapeake
Bay
primarilyrelieson voluntarycounty and
localgovernmental
actions, likedevelopment
management
tools, tocontrol land-useplanning,waterand sewer
planning,construction,
and
other growth-relatedmanagement
processes (Allenand
Hall. 1999).Bay
restorationand
protectionprograms
concentrateon
coordinatinglocal initiativesinvolvinglanduse
management,
streamcorridor protection,and
infrastructureimprovements.
The
follow ing highlightssome
oftheimportantdevelopment and
land usemanagement
strategiesutilized
by
state,county,and
localgovernments
within theChesapeake
Bay
watershed. Tools describedand
assessed includecriticalarearegulations,urbangrowth
boundaries, infill/communityredevelopment, transferofdevelopment
rights,subdivision requirementsand
clusterzoning, andpotential fundingstrategies forwater resourceand
natural area protection.State criticalarea regulations
Both
VirginiaandMaryland
utilize criticalarea regulationstoprotectimportant lands adjacentto the bay. Criticalareas are t\pically identified
on
a stateand
regional basisbecause naturalareascrosspoliticaljurisdictionsand
therefore require thecooperation of multiple jurisdictions. Criticalarea regulationsprovidemulti-jurisdictional
commitment
and
longrange planningfor significant natural resources.Programs
require abroad range ofskillsand
resourcesforplanning, legal justification,and
financing,inadditiontoincorporating variousdevelopment
management
toolstobalancedevelopment and
conservation.For
example.
IVIar\'landadoptedtheChesapeake
Bay
CriticalArea
ProtectionLaw
in1984.declaringthatthestate hasacritical
and
substantial interestinfostering
more
sensitivedevelopment
activityalong
theChesapeake
Bay
shorelineinorderto
minimize
damage
towater qualityand
naturalhabitats(Malone.
1990;Godschalk.
1987).The
Act
definesthecriticalarea as "lands beneaththe
Bay
and
all uplands within 1,000feetoftidalwater
ortidal wetlands"and
classifiesexistingdevelopment
withinthecriticalareas as:
1. intensely
developed
areas—
existingdeveloped
areaswhere
new
growth
should occurand improvements
towaterquality
and
water conservationare stressed:2. limited
developed
areas—
development
is
allowed
as longasit does notchange
the establisheddensity
and
pre\ailing land useand
itmust
improve
waterquality
and
conserveexisting natural habitat;and3. resource
conservation
areas—
development cannot
e.xceedanoverall densityofonedevelopment
unit(du)/acre.Inaddition, local
governments
arerequiredtodeveloplocal zoning
and development
plansthatinclude limiting
commercial
and
industrialprotectingshoreerosion,
and
describing landscaping requirements.Man,
land's CriticalArea
ProtectionLaw
has been consideredtobeone of
themost
e\tensi\eand
inno\ ati\e coastal area protectionprograms
inthecountn,; however, thereare
some
criticismsofthe regulation.
For
example,
some
criticizethatthestandard,
uniform
specifications areover-simplistic in thatthey disregardthe differencesbetween
shore locationsand
failtorecognizethe potential use
of
performance
standardstomitigateenvironmental impacts. Inaddition,therestrictionslimitingresidential
development on
landabuttingtheba\ hasaffected
housing
prices. Critical arearestrictionsincrease
housing
pricesbecause they limitthe suppl\ oflanda\ailableforhousing
constructionand
increase the \alueofthe shorelinedevelopment
asan amenity,which
iscapitalizedintothe\alueof land
and housing
prices (Parsons. 1992).A
studyof housing
price increases resultingfrom
Mar}
land'scriticalarearestrictionsestimatedthat
housing
prices forareas with water frontage increased
between 46
and
62 percent, prices forhousing
w
ithout frontage increasedbetween
14and
27
percent,and
prices forhousing nearbut not inthecriticalarea increased
between
13and
21 percent (Parsons. 1992).Urban
growth boundariesAn
urbangrowth boundary
isaplanningtoolthatguidesfuture
development by
delineatingan arbitrarylinearound
a geo-politicalregionin ordertodistinguishareasappropriate forurban expansionfrom
areasappropriatefor agriculture,rural,
and
resourceprotection(Frankel,2000).The
boLmdar\
shouldalsocoordinate withastrategy that pro\ ides the necessar} urban
servicestoensureefficient
and
timeK
development.
Urban
growth
boundariesnotonly servethelocalcommunity
by encouraging
more
cost-efficientde\elopment. thev alsocan
improve
the healthof
thebay
b\promoting
compact
urbandevelopment and
preserving importantnaturalareasfrom
development (CBP.
1997a). Forexample,
urbangrowth
boundariescan limitthe
number
of
vehicle milestraveled,protectimportantenvironmentalareas,
and
reduceimpervious surfaces.
An
example of
acommunit}
usingurbangrowth
boundariesas ade\elopment
management
toolw
ithintheChesapeake
Bay
watershed isthe Isleof
Wight
Count}.VA. The
Isle
of Wight
County
createdDevelopment
Ser\ice Districtsthatcoincide
w
ithmajor
transportation corridorsand
futuresewer
serv iceexpansion plans inordertoprotectimportant
rural lands
from
development (CBP,
1997a).Withinthedistricts,the
county
assumes
theresponsibilit}
of
providinginfrastructure,therefore decreasing
development
costsand
encouraging
de\elopment
w
ithinthedistricts. Inaddition,the count}-revisedlanduse
management
ordinancestoestablishperformance
standardsforlandscaping,controlof
access,lotcoverage,and
buffering inorderto bettermanage
development and
protect sensitive environmentaland
agricultural areas.Infill/communityredevelopment
Promoting
infillde\elopment
allowsacommunit}
torevitalize existingurbanareas.pro\ideadequate
and
affordablehousing,utilizeexisting infrastructure
and
reducetheconsumption of
ruraland
environmentallysensitivelands. Infill
development
benefitsthe regionby
reducingthenumber
of
vehiclemiles traveled, reducingtheneed
forseptic systems inrural areas
which
contributetoexcess nutrientswithinthe ba}.
and encouraging
thecleanup of
contaminated sites for futureusewhich
reduce theamount
oftoxicpollutantsenteringthe bay.An
example of
acommunit}
w
ithintheChesapeake
Bay
thatactivelypromotes
infilldevelopment
is LititzBorough.
PA
(CBP.
1997a).Lititz
Borough
islocatedin LancasterCounty
and
haspoliciestosustainavibrantdowntown
center, preservethe
town's
historicdistrict,and
preserv erural lands. Inorderto
promote
infilldevelopment
indowntown.
LititzBorough
hasaseven-}ear tax
abatement program
forcommercial and
industrialbusinessesthatlocate withinthedowntown.
Inaddition, thetown
alsoutilizesan urban
growth boundan*
topromote
growth
in designatedareasand
todiscourage sprawIoutsideof
thetown'slimits. Lititzcoordinatesdifferent
development
management
techniquestoencourage economic development,
compact
urban form,and
environmentalsustainabilitN.
The
utilizationofdifferentdevelopment
management
techniquestopromote
infill
and
preventpollutioncontributedto LititzBorough's
designationasaGold
Chesapeake
Bay
PartnerCommunity
for effortsto protect its land, rivers,and
the bay.Transferof developmentrights
(TDR)
The
Transferof
Development
Rights(TDR)
isa tool that allows forthe transfer
of
development
rightsof one
parcel inexchange
for the right todevelop
anotherparcelmore
intensely(Smith, 2000).
TDR
serves as a market-driven, incentive-baseddevelopment
management
tool thatprovidescompensation
toa
landowner
withouttheneed
forexpensive public acquisition(CBR
1997a). Benefitstothe bay includepemianently
preservingenvironmentallysensitiveareas, forests,
and
agricultural lands thatserveas natural pollution buffersand
filtration areas forwaterquality. Inaddition,it
minimizes
thenumber
of
septicsystems,
amount
of
impervioussurface,and
thenumber
of
vehiclemilestraveled.Montgomer\'
County,MD
maintainsa careful landmanagement
program
withmore
acres preserved
under
legal protection thanany
otherurbancounty
inthe nation. In 1997. over93,000
acres, nearlyone-thirdof
thecounty,was
preserved underlegalprotection (Allenand
Hall,1999).
The County
designated90,000
acres within thesendingareas,and
hasdownzoned
the areafrom
1 du/ 5 acresto 1 du/ 25 acresand
has
allowed one
creditper fiveacresto sending areaowners
(Smith, 2000). In addition, the county has designated receiving areaswhere
public facilitiesand
public servicescan support higherdensitydevelopment.
The
program
has beenrelativelysuccessful;approximately 6,629development
rightsfrom
over400
properties havebeen
severedby easements
for a land area of43,993
acres.Of
these,only 5,123have been
transferredto receivingzones.The
successof
Montgomery
County's
program
isattributedtoa landmarket
thatpromotes
TDR
salesfrom
the sending areastothe receivingareas,theappropriatedetermination
of
thevalueof
TDR's
tobuyersand
sellers,and
a clearprogram
thathas
been
properlymarketed
tolandowners, developers, realtors,bankersand
attorneys(CBP,
1997a).However, one
drawback
of
theTDR
program
isthatfrom
a regionalprospective,
Montgomery County
cannot preventdevelopment from
areasoutside itsborders.Subdivisionrequirements
and
zoningSubdivisionregulationscan play an important role inthe protection of importantnaturalareas.
For
example,
clusterzoning
allowsforthe protectionof
rural characterand minimizes
the impactson
resource landsby
focusinggrowth
into smaller areasofa parcel
and
preservingtheremainder
asopen
space or farmland.Clustering
can
improve
storm watermanagement
by
allowingstormwater
to bechanneled
and
detained indetentionponds
locatedwithintheopen
space. In addition,specified vegetated bufferrequirementswithinsubdivisionregulations areimportanttofiltersediments
and
pollutants,reduce Hooding,and
protectwater qualitywithinthewatershed.Howard
County,MD,
locatedbetween
Washington
D.C. and BaltimoreMD,
hasadopted
subdivisioncontrolsand
clusterzoningtomitigate the effectsofrapid
growth
thatthreatenrural areas. For example,
Howard
County'sSubdivision
and
Land
Development
Regulations requirewetlandstobe placed inopen
spacewhen
it is created, a bufferof
25 feetaround
nontidal wetlands, abufferof
75 feetalong perennial streamsinresidentialzoningdistricts,and
a bufferof 50
feetalong intemiittent streamsand along
perennialstreamsin nonresidentialzoning
districts(Howard
County, 1999).Furthermore, becausethe county'sthree acre lot
minimum
was
notadequatetohandlegrowth
pressure, in
1992
thecounty
adopted
threeruralclusterdistrictswithspecificguidelinestoaid developersinsubdivisiondesign
(CBP,
1996):/.
Rural Conservation
(RC)
allocatespriority toagricultural uses
and
permits residential useata densityof
1 dwellingacres:
2.
Rural
Residential(RR)
applies to areaswhere
themost
extensive subdi\isionhasalread} taken place
and
is intended toaccommodate
most of
thedemand
for ruralresidentialdevelopment
as infill:and
3. Density-
Exchange
Option
(DEO)
is anoverlaydistrictthatcoversall lands withinthe
RC
and
RR
districts. Densitymay
beexchanged between
qualified sendingand
receivingareas.The
intentistogivefanners considerableflexibility
intransferring density
away
from
the bestfarms
tothose locations thathave
theleast long-term\iabilits foragriculture.
Howard
County's
subdivisionregulationsand
cluster
zoning
hasbeen
relatively successful,and
therehasbeen
a strongdemand
forclustered lotsubdivisions. Inaddition,an assessment
of
Howard
County's General
Plan cites ruralclustering
and
densityexchange
as de\ icestohelp achieve itsgoal
of 30,000
acresunder
protectionfrom
futuredevelopment
(Howard
County, 1999).However,
thecounty did not achieve greateruse of shared septic systems tocreate tighterrural clusters because costs
and
the agencN approval processdiscouraged implementation.Potential
funding
strategiesforprotecting water resourcesand
natural areasThere
are \ariousfunding strategies used inthe
Chesapeake
Bay
region to support sustainabledevelopment.
First,a special assessmentdistrict can be used toprotectorimprove
a special geographic feature.A
special assessmentdistrict isan independentgovernment
entitv'
formed
to financegovernmental
services for a specific geographic area, such as a stream, small watersheddistrict,ornaturalresourcemanagement
district. Residentsof
the specialdistrictpay taxestofinance specific
improvements
that willbenefitthem
orresolve acommunity
problem,likeexcessiverunoffinthedistrict. For
example,
residents interestedinreclaiming a
wetland
orimproving
awaterway
can use a special assessmentdistrict tomanage
and
financethe project.Second, a
stormwater
management
utilityisan enterprisethat can charge
landowners
a fee basedon
parcel sizeand
the degreeof
development.
The
revenuefrom
this feecan be dedicated tostormwater
management
activities,suchasretrofittingexistingsystems or providing
sediment
and
erosioncontrol. Third,wetland orforest
banking
canbe usedto replace awetland
orforestdestroyed
by development.
Mitigationbanks
facilitatetheadministrationof
asystemwhere
appropriate areas for wetlands or forests arematched
with developers inneed of
satisfyingoff-sitemitigationrequirements. Fourth, local
governments
can utilizeaStateRevolving
Fund
where
thestateprovides funds to financeboth publicand
privatesector projectsthat
enhance
orprotect waterquality. Projectsmay
include septicsystem
repairorreplacement, erosion control,upgradingwastewater
treatment facilities,orthe constructionof
animal waste storagefacilities. Finally,anendowment
fundfrom
a publicor privateorganizationcan beused for a varietyof
projects, such aswetlandsand
habitatcreation/restoration,treeplantingand
streambank
stabilization.Effectiveness
of
developmentstrategiesThe
effects ofdevelopment
management
arediftlculttodetermineempirically;however,
recent
modeling
effortsindicatethe potential effectsof
differentdevelopment
scenarios.An
analysis presented in Integrating Build-Out Analysisand
Water
QualityModeling
toPredict the
Environmental Impacts of
AlternativeDevelopment
Scenarios (1998)indicatesthe potentialresults
from
different buildoutswithinMaryland's Patuxent River watershed.The Mary
landOfficeof
Planning(MDOP)
modeled
landand
water resourceimpacts
of
three differentdevelopment
alternatives(CBR
March
1998):/.
2010
Base
Zoning
("worst casesubdivisionand environmental ordinances
and
withoutBMPs
for nutrientmanagement;
2.
2010
CurrentPrograms,
portrayingnew
development under
currentzoning, subdivision,and environmentalregulations, as wellasimplementation
of
agriculturalnonpoint sourcepollution
control;
and
3.
2010
DirectedGrowth,
portrayingenhanced
levelsof
growth
management,
landconservation,andpollutioncontrol practicesincludedin
Mary
land's Tributary Strategies, such as forest conservation,streambuffer protection,ruralclustering,increased
development
potential in
growth
areas,transferof
development
rights,extendingsewer
servicein designated
growth
areas, protective agriculturalzoning,and
the purchaseof
development
rights.The
resultsof modeling
the three scenariossuggestthatimplementation
of
bothgrowth
management
and
pollution control optionsare essentialinmaintainingnutrient loadcapsbeyond
theyear2000. Intheyear20
10.modeling
resultssuggestthatpollutionlevels will be
much
lowerif
growth and
new
development
iswell directed. Inaddition,growth
management
appliedinconjunction withothermanagement
tools,suchas
BMPs,
will beone
ofthemost
importantfactorsdeterminingfuture pollution
levels. For
example.
MDOP
estimatesthatintheyear2010.nitrogen pollutant loads to the Patuxent River watershed could be about
1.141.000
pounds
lowerif "DirectedGrowth."
"Resource
Protection,"and
BMP
optionswere
used tomanage
growth. In addition, by theyear 2010, streamqualitywould
degradein nearly halfof
the Patuxent watershed under theCurrent
Programs,
while underthe DirectedGrowth
scenariostreamqualitywould
limitdegradationtoabout
one
quarterofthe watershed.The
modeling
resultssuggesttheimportanceforstate, county,
and
localgovernments
tocontinuetopursuesustainable
development
strategies.EVALUATION OF
THE CHESAPEAKE
BAY
PROGRAM
The
water resourceand
natural areamanagement
approach
of
theChesapeake
Bay
exemplifiesacomprehensive,
integrated,and
innovativemanagement
program
that can serve asamodel
forthedevelopment of
future programs.The
followingsectionevaluatestheprogram
to protect water resourcesand
natural areas. It identifiesthe strengthsand
weaknesses
of
theChesapeake
Bay Program
and
some
of
the strategiesthatcan be appliedmore
broadly inthiscountry
and
abroad.Although
millionsof
dollarshave been spenton bay
restorationprograms
since theProgram
originatedin 1983.measuring
the effectivenessof any
program
isdifficultbecauseof
the indistinctlinkbetween programs and
improvements
towaterqualityand
naturalareas.However,
a general assessment ofthe strategies utilizedby
theChesapeake
Bay
Program
demonstrates anumber
of
significant strengths. Overall, theChesapeake
Bay
Program
displaysgood
interstateand
intrastatecooperationandcommunity
involvement.The
program
goestogreat lengthsto
promote
community
outreachand
providesmany
opportunitiesforcitizeninvolvement. Inaddition, the
program
isimproving
itsmonitoring systemsand
includesan integrated goalsand
indicatorssystemthatclearlyillustratesthestatus
of
restoration efforts.The
Chesapeake
Bay
Program
has also createdinnovativenutrientreduction strategies.For instance.Tributaries Strategies are a flexible
and
area-specificapproach
to nutrientreduction.In addition, the
Chesapeake
Bay
hasadvanced
cost-shareprograms
thatencourage
farmerstoimplement
BMPs.
In addition,governments and
non-profitswithintheBay
have
successfully collaboratedtoprotectmillionsofacresof naturalareasand hundreds of
milesof
riparianforest buffers. Furthemiore. the