1 An Assessment of the Role of Optimal Foraging Theory on Herd Management Decisions among
Turkana Pastoralists Using Agent-based Modeling
By David Warner
Honors Essay Anthropology
University of North Carolina
April 25, 2014
2
Acknowledgements
I would like to first thank Dr. Colin West for his support and guidance throughout the process of creating the model and writing the thesis. My experience with computer programming was non-existent coming into the project and Dr. West helped me to navigate the world of agent-based modeling and ultimately develop the model. Particularly, Dr. West provided substantial guidance when I was trying to figure out how to get the agents in the model to die and how to stop the model after a certain number of tics. Without his support and guidance, this project would not have happened.
I next want to thank Dr. Paul Leslie and Dr. Catherine Lohmann for their willingness to serve on my thesis committee, offer suggestions for the project, and provide edits on the thesis. I am very blessed to have their support on this project.
I also want to thank my professors within the Anthropology Department who have led me to develop an interest in anthropology and inspired me to take on this project. Particularly, I would like to thank Dr. Towns Middleton for his guidance on refining my research question and planning the structure of the thesis.
3
Introduction
Optimal Foraging Theory and Applications of the Theory to Turkana Pastoralists
Optimal foraging theory is the ecological prediction that natural selection in an energy-limited system favors individuals who are able to maximize their energy intake per unit time. MacArthur and Pianka (1966:603) established the theory and explained that there were two factors influencing the “optimal allocation of time and energy expenditure,” prey choice and patch utilization. These factors would be used to create the diet-breadth and patch-choice models of optimal foraging theory.
The diet-breadth model serves to provide an understanding of the choice of prey that enables the highest amount of energy per unit time. The variables affecting prey choice have been modeled by ecologists with the following equation:
.
In the equation, E/T represents energy intake over time, Nei represents the population of the prey,
Ei represents energy obtained from the prey of type i, Cs represents search cost, and Hi represents
handling cost (O’Connell and Hawkes, 1981).
The patch-choice model is specifically applicable to ecosystems where resources are dispersed in patches rather than homogeneously across an area. The model relies on the assumption that foragers do not return to a patch until resources are rejuvenated and that traveling time between patches is non-productive. The primary variables influencing patch choice include time spent traveling to the patch, search time, and gathering and processing time (O’Connell and Hawkes, 1981).
4 Particularly, optimal foraging theory was applied in the 1970’s and 1980’s by several behavioral ecologists including Bruce Winterhalder, James O’Connell, and Kristen Hawkes who suggested that the foraging decisions in hunter-gatherer societies were designed to maximize the amount of energy human foragers could obtain from their environment. However, optimal foraging theory has not been used to analyze herd management decisions in pastoral societies. This study investigates the relevance of optimal foraging theory to pastoral societies by exploring the applicability of the theory to the Turkana in northern Kenya.
In general, pastoralism is a flexible subsistence strategy that utilizes a combination of opportunistic food production, foraging, and exploitation of livestock for milk and meat to obtain energy from the environment. The environmental conditions in which pastoral societies exist include unpredictable climates, extreme seasonality, and variable organic matter production and therefore pastoral societies are in disequilibrium and are often energy-limited. The Turkana live in a scrub savanna with dispersed biomass production and an unpredictable climate that often yields high daytime temperatures and low precipitation, which is characteristic of a pastoral environment.
5 herding of sheep, camels, and goats ensures that the disease will not wipe out the entire herd if all of the cattle in the herd are affected. The size of the herd requires the consideration of two environmental factors. On the one hand, in times of extreme drought many animals die of starvation or disease and therefore a smaller herd size yields a higher probability that most of a herder’s livestock will perish. On the other hand, the size of a herd cannot exceed the capacity of foraging opportunities available to livestock within the region. Finally, the separation of
livestock can be advantageous in sustaining herd populations because different types of livestock may have variable foraging and water requirements. For example, goats and cattle have
significantly greater water requirements when compared to camels. Thus, when herding camels, goats, and cattle, it might make sense to find foraging opportunities for cattle and goats that are closer to watering points and to separate camels from the herd if there are better foraging opportunities that are further from watering locations.
Terrence McCabe studied the herd management decisions of four Turkana pastoralists in his book, Cattle Bring Us to Our Enemies (2004). Among the four herders studied by McCabe, forage availability was the most common determinant of herd movement. For example, one herder named Angorot expressed that 72% of his movements to a new area were driven by foraging (McCabe, 2004:163).
6 more risk averse and would often be one of the last herders to reach foraging grounds to avoid contact with raiding groups.
The study by McCabe demonstrates the limitations of applying optimal foraging to the Turkana. However, this does not diminish the importance of optimal foraging strategies to the Turkana. In many cases, foraging is intertwined with security. For instance, McCabe (2004) discusses one particular instance in which Angorot stated that he was leaving Komokuny due to Pokot raids, but said that he was moving to Kakulit from Komokuny for foraging purposes. The conflated reasoning of Angorot demonstrates that he feels the need to adopt strategies that optimize foraging opportunities along with security.
7
Literature Review
The Foundations of Ecological Anthropology
Ben Orlove defined ecological anthropology as “the study of the relations among the population dynamics, social organization, and culture of human populations and the
environments in which they live” (1980:235). The origin of the field of ecological anthropology can be traced back to Julian Steward’s “method of multilinear evolution” (Steward, 1955). Through his theory of cultural ecology, Steward explained that culture is a product of the behavioral adaptations that humans implement in response to their environment.
Steward was succeeded by the school of neofunctionalism, which was established by Marvin Harris and Roy Rappaport. Contrary to Steward, the neofunctionalists asserted that human behaviors can be explained as functional adaptations designed to enable humans to exploit their environment and maximize their carrying capacity (Orlove, 1980).
During the 1980’s, the field of human behavioral ecology coalesced, which applied evolutionary theory and optimization models to better understand the relationship between human foragers and their environment. While early ecological anthropologists focused on the relationship between groups of people and the environments in which they lived, behavioral ecologists were more interested in understanding how ecology shaped individual
decision-making and behavior. For example, one area within behavioral ecology investigated how optimal foraging theory could be applied to foraging economies to understand individual behaviors in hunter-gatherer societies.
Criticisms of “Old Ecological Anthropology” and Recent Directions in Ecological Anthropology
8 anthropology.” The four criticisms of “old ecological anthropology,” which can also be
extended to include early behavioral ecology, include (1) the narrow spatial and temporal focus of early studies in ecological anthropology, (2) the fixation on Panglossian functionalism, (3) the view of human ecosystems as stable and unchanging, and (4) the failure to take into account the political aspects of the interactions between humans and their environment.
The first criticism remains a concern for ecological anthropologists today. Due to funding constraints and the limitations of research methodologies currently available to anthropologists, projects providing an extensive spatial and temporal analysis are difficult to execute.
Additionally, when addressing the limited spatial analysis conducted in the field of “old ecological anthropology,” Kottak (1999) criticized the tendency of cultural ecologists and neofunctionalists to ignore the interaction between state-level societies and the environment and focus more on the relationship between local bands and tribes and their environment.
9 analyzing the efficiency of energy utilization does not provide a full picture of the challenges faced by individuals living in ecological systems.
In fact, Vayda and McCay (1975) provided criticisms of two research studies where the limiting factor for an anthropological system was not energy availability. The first study criticized by Vayda and McCay was the research conducted by Richard Lee on the !Kung Bushmen, which failed to account for the shortage of water, which presented a greater challenge to the population than energy availability, which was the focus of Lee’s study. Additionally, Vayda and McCay criticized the research on the Tsembaga Marings conducted by Rappaport, which failed to provide an understanding of how the Marings addressed the challenges associated with the transmission of malaria by anopheles mosquitoes. However, this is not to minimize the role that optimal foraging theory may play in the migration decisions and food choices of hunter-gatherers. In some cases, energy availability may in fact serve as the primary factor governing foraging behaviors in hunter-gatherer societies. Nevertheless, other factors may influence the foraging decisions of hunter-gatherers, including water shortages, disease, and warfare and thus ecological anthropologists must be careful to avoid making Panglossian functionalist assumptions when conducting research.
10 recently produced a paper centered on the relationship between response diversity and ecological resilience in social-ecological systems.
In the final criticism of “old ecological anthropology,” Kottak addressed the removal of ecological anthropology from the political sphere and environmental policy. The “new ecological anthropology” has confronted this concern through the emergence of new subfields, including political ecology and applied environmental ecology. However, the development of political ecology has received backlash for its failure to implement ecology into the discipline. In a critique on political ecology, Vayda and Walters (1999:168) directly state “overreaction to the ‘ecology without politics’ of three decades ago is resulting now in a ‘politics without ecology,’ which in violation of truth in labeling, is still billing itself ‘political ecology.’"
This critique is not to minimize the importance of political ecology when researching the relationship between humans and their environment. For instance, raiding pressure is a
significant factor that influences the migration patterns of Turkana pastoralists. Migration is an essential adaptation for survival in the non-equilibrium ecosystem in which the Turkana live (McCabe, 2004). Thus, it is important to understand how raids may influence the migration decisions of Turkana and explore the environmental consequences that may arise as a result of the avoidance of raids. However, the prevalence and causes of raiding cannot be investigated without analyzing the political nature of the Turkana District.
Optimal Foraging Theory: Conditions under Which the Theory Applies to Human Populations,
Criticisms within Anthropology, and Relevance of the Theory to the Turkana
11 (1) available food energy is in short supply (fitness is energy-limited); (2) specific
nutrients are in short supply (fitness is nutrient-limited); (3) time for adaptive
nonforaging activities is scarce; or (4) foraging necessarily exposes the forager to greater risks (fitness costs due to predation, accident, climatic stress, etc.)
Turkana pastoralists meet all four of the conditions outlined by Smith. Due to the extreme climate, biomass resources required by livestock are limited and therefore the Turkana meet the first two conditions outlined by Smith. Furthermore, the Turkana have been known to walk for several days without food or water in an effort to search for foraging grounds for their herds and recover lost livestock. Turkana warriors sometimes walk sixty-five miles over the course of a day (Dyson-Hudson, R., 1999:31). As a result, the assumption can be made that the time Turkana herders spend on non-foraging activities is limited, adhering to the third condition outlined by Smith. Finally, the prevalence of Pokot raiding indicates that foraging exposes herders to greater risks and thus the Turkana also meet the fourth condition. Consequently, based on Smith’s criteria for the application of optimal foraging theory to anthropological systems, optimal foraging models can be utilized to understand the herd management decisions of Turkana pastoralists.
However, in his review Smith also provides criticisms on the application of the theory to anthropology and caution is required when applying optimal foraging theory to Turkana
12 A second criticism is that the model provides a simplistic view of the complexities
associated with foraging decisions. Human foraging requires complex cognitive processes, which optimal foraging models fail to take into account. For example, the differences in herd
management strategies employed by Lorimet and Angorot can be explained by their differing priorities when making herd management decisions (McCabe, 2004).
This leads into the next criticism, which is the failure of the model to account for
uncertainty and risk. Optimal foraging theory implies that foragers have a perfect knowledge of the ecological processes surrounding them, which is certainly not the case. As a result, Smith argues that in times of uncertainty, humans may opt to minimize their risks instead of
maximizing the efficiency of energy intake. This is certainly prevalent in the case of Lorimet who sacrificed migrating to the best foraging grounds because of his fear of encountering a Pokot raid.
Finally, Smith argues that reductionism is a significant problem when applying optimal foraging theory to anthropology. He states, “Many criticisms of the application of foraging theory to humans focus on the dangers of borrowing a theory developed in biology to explain phenomena in the domain of social science” (Smith, 1983:637). Thus, when applying ecological principles, such as optimal foraging theory, to social systems, it is important to consider the limitations of the theory that might arise due to the social or political nature of human systems.
Current Research on the Human Ecology of Turkana Pastoralism
Between 1980 and 1996, the multi-disciplinary South Turkana Ecosystem Project (STEP) was conducted, which was one of the most extensive studies ever conducted on a pastoral
13 stressful environment, the impact of the exploitation of resources on the ecosystem, and the effects of environment on the health and adaptability of the Turkana (Little, et al., 1999). The study yielded a plethora of articles, several book chapters, and a few books, including Terrence McCabe’s work Cattle Bring Us to Our Enemies (2004).
McCabe’s (2004) study explored the cultural adaptations required to subsist in the non-equilibrium ecosystem of the Turkana District. To conduct his research, McCabe lived among four Turkana herders over the course of ten years to analyze their migration patterns, responses to drought, disease, and security issues, and their use of opportunism to cope with the harsh environment. Overall, McCabe found that extensive migration and opportunism were essential for the survival and maintenance of herds.
The multitude of responses to the harsh Turkana environment has led to the study of response diversity among Turkana herders. Response diversity is the idea that in fluctuating ecosystems, humans may adapt a variety of responses to adjust to changes in the ecosystem. Turkana herders have utilized differing herd management strategies to adapt to the
disequilibrium ecosystem of the Turkana district, and thus the study of response diversity among Turkana herders is relevant. Leslie and McCabe (2013) have further opened the discussion of response diversity among Turkana herders by addressing the need to assess the consequences that response diversity may have on the resilience of Turkana pastoralists to the non-equilibrium ecosystem.
Current Applications of Agent-Based Modeling to Anthropological Systems
14 theoretically occur. Although agent-based modeling has not been used extensively to understand the behaviors of humans in an ecological or environmental context, agent-based modeling has been utilized to address anthropological questions.
Steve Lansing (1991) used agent-based modeling to better understand the ecological basis of the subak irrigation system for the Balinese paddy fields, which has existed for over 1,000 years. The subak irrigation system was undermined by Dutch colonials, who collected taxes from the Balinese and developed a new irrigation system that was controlled by the state. The new system permitted continuous rice cropping, which yielded significant social and ecological consequences, including the unequal distribution of water and the explosion of pest populations. Lansing (1991) utilized an agent-based model that incorporated a variety of factors, including rainfall, the relationship between rainfall and runoff, the time required to harvest rice, water stress, pest growth rate, and different management scenarios to discover that a
management scenario entailing a single cropping pattern was ecologically favorable to a management scenario entailing 172 isolated subaks.
15
Materials and Methods
Overview of the Model
Agent-based models are a class of computational models designed to simulate the behaviors and interactions of individual agents acting within a system. Agent-based modeling can also be applied to understand the impact that the collection of individual behaviors and interactions can have on the system as a whole. This specific project utilized the agent-based modeling program NetLogo (version 5.0.4), which was designed by Uri Wilensky from the Center for Connected Learning and Computer-Based Modeling at Northwestern University (Tisue and Wilensky, 2004). The programming language for NetLogo uses agents in the form of turtles, patches, and the observer to model individual behaviors and interactions.
NetLogo contains an extensive library of sample models from a variety of disciplines, including art, biology, chemistry, mathematics, Earth science, social science, and system dynamics. The sample models can be expanded upon through the modification of coding procedures and the addition of buttons, switches, sliders, monitors, and plots to the user interface. This particular model expanded upon the “Wolf Sheep Predation” model to simulate the migration of sheep, goats, camels, and cattle within the Turkana ecosystem.
16 In addition to gaining energy from patches of grass, livestock also lose energy when moving. The amount of energy that livestock lose while moving is related to the distance traveled by different species of livestock as recorded by McCabe. According to the data presented by McCabe (2004), among the types of livestock herded by the Turkana, camels typically travel the longest distance per day, followed by cattle and then small livestock (sheep and goats). Consequently, in the model camels were deemed to lose the greatest amount of energy while moving and sheep and goats were deemed to lose the least amount of energy while moving. Both the amount of energy that animals gain from patches and the amount of energy that animals lose from moving can be adjusted by the sliders shown on the user interface in Figure 1. When the total energy of an individual animal decreases to 20, which arbitrarily represents the starvation of the animal, the animal is programmed to die.
17 Figure 1: Overview of the NetLogo user interface for the modification of the model “Wolf Sheep Predation” used in the project
Overall, the control of herd populations in the model is mostly based on the availability and use of energy. As mentioned, the energy gained by animals from patch resources is a significant source of energy in the system. The major determinants of the energy owned by patches at a given time include grass regrowth time, the energy that animals gain from food, and intra-specific and inter-specific competition. As mentioned, the grass regrowth time is regulated by a slider on the user interface, and represents the fluctuating availability of water in the Turkana environment. A higher grass regrowth time represents a dry season while a lower grass regrowth time represents a wet season because the time required for grass to grow back is much higher during a dry season as opposed to a wet season.
18 were estimated to gain the lowest amount of energy from food and livestock with the lowest reliance on grass consumption were estimated to gain the highest amount of energy. This association was grounded in the assumption that livestock that consumed higher amounts of grass required higher grass consumption for subsistence. In order to simulate variations in grass consumption across the different livestock in the model, various types of livestock obtained differing amounts of energy from grass. Animals who gain the least amount of energy from food in the model are required to consume more grass to meet their energy requirements while
animals that gain the highest amount of energy from food do not have to consume as much grass for subsistence in the model ecosystem. Consequently, camels in the model gain the highest amount of energy from food while cattle in the model gain the least amount of energy from food.
The third factor affecting the amount of energy that livestock are able to obtain from their environment is competition within and between species. As livestock in the model consume patches of grass, the amount of energy available from each patch decreases. As a result, the amount of energy available in the environment decreases, leading to competition for resources among the different livestock. This phenomenon also led to the development of population cycles, which were observed in some of the experiments with the model. In these experiments, as patches of grass were consumed, the amount of energy available from the grass led to a decrease in livestock populations because animals were unable to meet their energy requirements.
However, the decrease in livestock populations led to a decrease in the consumption of grass, resulting in an increase in the number of patches containing grass. The increase in the number of patches with grass then contributed to an increase in livestock populations.
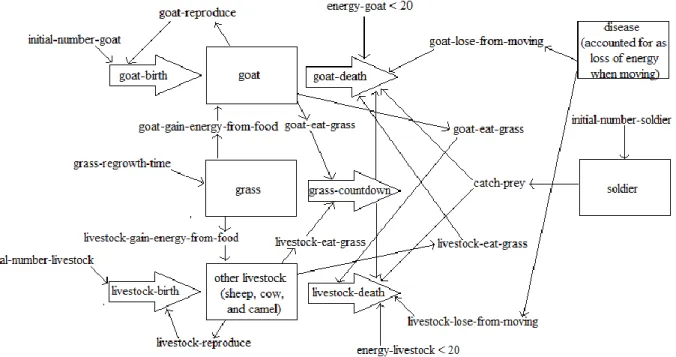
19 decrease in the herd population, which can be observed by increasing the initial number of soldiers in the model. With regard to livestock reproduction, McCabe (2004) collected data on the fertility of the different livestock by analyzing the number of years between births of the different livestock. Based on the data, camels produce offspring every two to three years while cattle produce offspring every one to two years. Goats and sheep generally produce offspring either once or twice per year. In the model, goats and sheep were estimated to have the highest reproduction rate and camels and cattle were estimated to have lower reproduction rates. The overall summary of the factors affecting dynamics in the ecosystem simulated using the model is depicted in Figure 2 below.
20
Parameters of the Model
Patches
Grass
Grass-regrowth-time
1980-1981 Drought 90
1982 Wet Season 60
Agents
Sheep
sheep-gain-from-food 27
sheep-reproduce 2.00%
sheep-lose-from-moving
Due to movement 15
Due to movement and disease 26 initial-number-sheep
Angorot 1980-1981 90
Angorot 1982 37
Lorimet 1980-1981 12
Lorimet 1982 5
Atot 1980-1981 23
Atot 1982 15
Lopericho 1980-1981 17
Lopericho 1982 9
Goats
goat-gain-from-food 30
goat-reproduce 2.00%
goat-lose-from-moving
Due to movement 18
Due to movement and disease 26 initial-number-goat
Angorot 1980-1981 241
Angorot 1982 99
Lorimet 1980-1981 77
Lorimet 1982 32
Atot 1980-1981 68
Atot 1982 64
Lopericho 1980-1981 17
21
Cattle
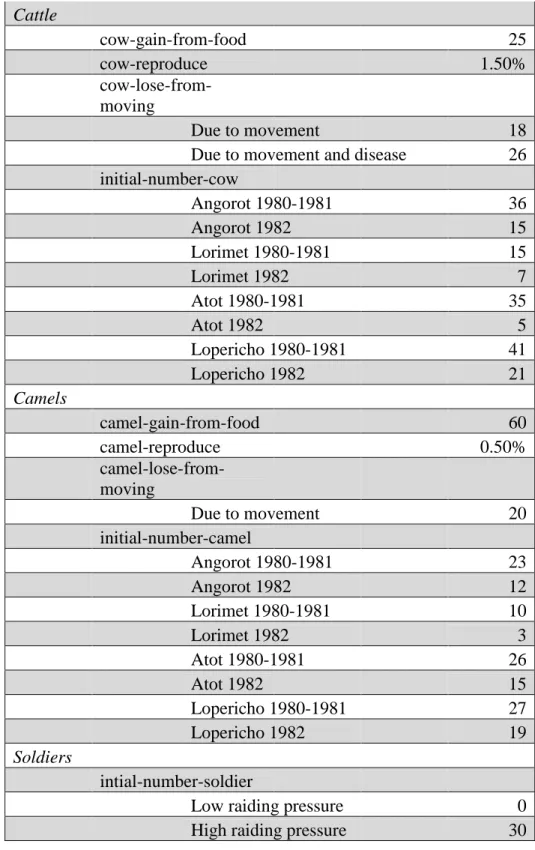
cow-gain-from-food 25
cow-reproduce 1.50%
cow-lose-from-moving
Due to movement 18
Due to movement and disease 26 initial-number-cow
Angorot 1980-1981 36
Angorot 1982 15
Lorimet 1980-1981 15
Lorimet 1982 7
Atot 1980-1981 35
Atot 1982 5
Lopericho 1980-1981 41
Lopericho 1982 21
Camels
camel-gain-from-food 60
camel-reproduce 0.50%
camel-lose-from-moving
Due to movement 20
initial-number-camel
Angorot 1980-1981 23
Angorot 1982 12
Lorimet 1980-1981 10
Lorimet 1982 3
Atot 1980-1981 26
Atot 1982 15
Lopericho 1980-1981 27
Lopericho 1982 19
Soldiers
intial-number-soldier
Low raiding pressure 0
High raiding pressure 30
22
Overview of the Experiments Conducted
23
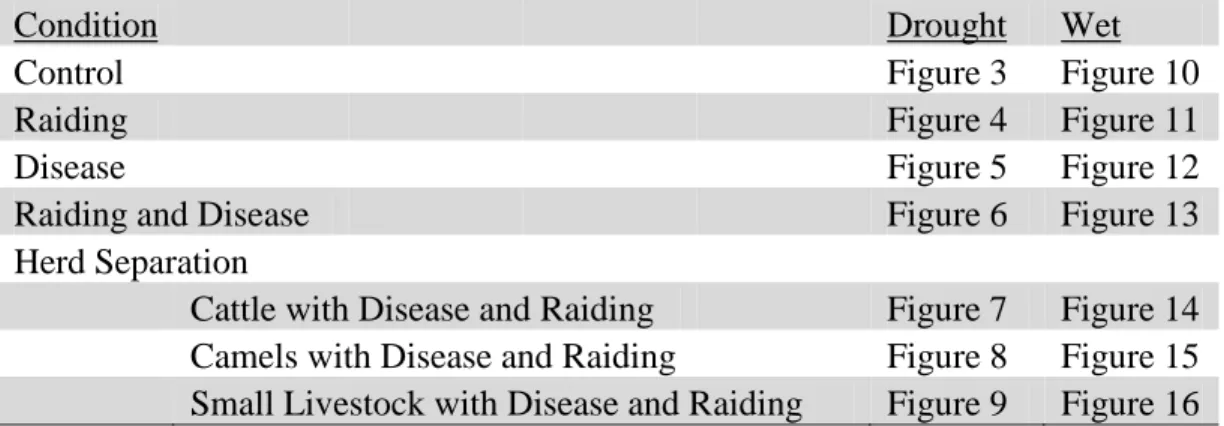
Condition Drought Wet
Control Figure 3 Figure 10
Raiding Figure 4 Figure 11
Disease Figure 5 Figure 12
Raiding and Disease Figure 6 Figure 13
Herd Separation
Cattle with Disease and Raiding Figure 7 Figure 14 Camels with Disease and Raiding Figure 8 Figure 15 Small Livestock with Disease and Raiding Figure 9 Figure 16
24
Results
Figures 3 to 16 contain a series of plots defining the herd population dynamics of the model ecosystem for each of the experiments conducted for the project. Each figure contains a total of four plots, representing the population dynamics observed based on the initial
25 Figure 3: Herd population dynamics for the 1980-1981 drought as observed through the model without consideration of raiding pressure or disease. Figure 3A, B, C, and D represent the population dynamics observed based on the initial populations of the herds of Angorot, Lorimet, Atot, and Lopericho, respectively, in 1980.
0 100 200 300 400 500
0 100 200 300
Pop u lation Time Sheep Cattle Goats Camels
Grass 0
100 200 300 400 500
0 100 200 300
Pop u lation Time sheep cattle goats camels grass 0 100 200 300 400 500
0 100 200 300
Pop u lation Time sheep cattle goats camels
grass 0
100 200 300 400 500 600 700
0 100 200 300
Pop u lation Time sheep cattle goats camels grass
A B
26 Figure 4: Herd population dynamics for the 1980-1981 drought as observed through the model with high raiding pressure and without factoring the presence of disease. Figure 4A, B, C, and D represent the population dynamics observed based on the initial populations of the herds of Angorot, Lorimet, Atot, and Lopericho, respectively, in 1980.
0 100 200 300 400 500
0 100 200 300
Pop u lation Time Sheep Cattle Goats Camels
Grass 0
100 200 300 400 500
0 100 200 300
Pop u lation Time sheep cattle goats camels grass 0 100 200 300 400 500
0 100 200 300
Pop u lation Time sheep cattle goats camels
grass 0
100 200 300 400 500 600
0 100 200 300
Pop u lation Time sheep cattle goats camels grass
A B
27 Figure 5: Herd population dynamics for the 1980-1981 drought as observed through the model with prevalence of contagious bovine pleuropneumonia factored in, but without consideration of raiding pressure. Figure 5A, B, C, and D represent the population dynamics observed based on the initial populations of the herds of Angorot, Lorimet, Atot, and Lopericho, respectively, in 1980. 0 100 200 300 400 500
0 100 200 300
Pop u lation Time sheep cattle goats camels
grass 0
100 200 300 400 500
0 100 200 300
Pop u lation Time sheep cattle goats camels grass 0 100 200 300 400 500
0 100 200 300
Pop u lation Time sheep cattle goats camels grass 0 100 200 300 400 500
0 100 200 300
Pop u lation Time sheep cattle goats camels grass
A B
28 Figure 6: Herd population dynamics for the 1980-1981 drought as observed through the model with prevalence of contagious bovine pleuropneumonia and high raiding pressure implemented into the model. Figure 6A, B, C, and D represent the population dynamics observed based on the initial populations of the herds of Angorot, Lorimet, Atot, and Lopericho, respectively, in 1980.
0 100 200 300 400 500
0 100 200 300
Pop u lation Time sheep cattle goats camels
grass 0
100 200 300 400 500
0 100 200 300
Pop u lation Time sheep cattle goats camels grass 0 100 200 300 400 500
0 100 200 300
Pop u lation Time sheep cattle goats camels
grass 0
100 200 300 400 500 600
0 100 200 300
Pop u lation Time sheep cattle goats camels grass
A B
29 Figure 7: Herd population dynamics for the 1980-1981 drought as observed through the model with prevalence of contagious bovine pleuropneumonia and high raiding pressure implemented into the model. In this simulation, only cattle were incorporated into the experiment in an effort to analyze the effects of the separation of cattle on herd population dynamics. Figure 7A, B, C, and D represent the population dynamics observed based on the initial number of cattle owned by Angorot, Lorimet, Atot, and Lopericho, respectively, in 1980.
0 200 400 600 800 1000
0 100 200 300
Pop u lation Time Cattle Grass 0 200 400 600 800 1000
0 100 200 300
Pop u lation Time cattle grass 0 200 400 600 800 1000
0 100 200 300
Pop u lation Time cattle grass 0 200 400 600 800
0 100 200 300
Pop u lation Time cattle grass
A B
30 Figure 8: Herd population dynamics for the 1980-1981 drought as observed through the model with high raiding pressure implemented into the model. In this simulation, only camels were incorporated into the experiment in an effort to analyze the effects of the separation of camels on herd population dynamics. Figure 8A, B, C, and D represent the population dynamics observed based on the initial number of camels owned by Angorot, Lorimet, Atot, and Lopericho, respectively, in 1980.
0 200 400 600 800 1000
0 100 200 300
Pop u lation Time Camels Grass 0 200 400 600 800 1000
0 100 200 300
Pop u lation Time camels sheep 0 200 400 600 800 1000
0 100 200 300
Pop u lation Time camels grass 0 200 400 600 800 1000
0 100 200 300
Pop u lation Time camels grass
A B
C D
31 Figure 9: Herd population dynamics for the 1980-1981 drought as observed through the model with high raiding pressure implemented into the model. In this simulation, only goats and sheep were incorporated into the experiment in an effort to analyze the effects of the separation of caprines on herd population dynamics. Figure 9A, B, C, and D represent the population
dynamics observed based on the initial number of sheep and goats owned by Angorot, Lorimet, Atot, and Lopericho, respectively, in 1980.
0 100 200 300 400 500
0 100 200 300
Pop u lation Time Grass Goats Sheep 0 100 200 300 400 500 600
0 100 200 300
Pop u lation Time sheep goats grass 0 100 200 300 400 500 600
0 100 200 300
Pop u lation Time sheep goats grass 0 200 400 600 800
0 100 200 300
Pop u lation Time sheep goats grass C
A B
32 Figure 10: Herd population dynamics for the 1982 wet season as observed through the model without consideration of raiding pressure or disease. Figure 10A, B, C, and D represent the population dynamics observed based on the initial number of livestock owned by Angorot, Lorimet, Atot, and Lopericho, respectively, in by the end of the 1980-1981 drought.
0 100 200 300 400 500
0 100 200 300
Pop u lation Time sheep cattle goats camels
grass 0
100 200 300 400 500 600 700
0 100 200 300
Pop u lation Time sheep cattle goats camels grass 0 100 200 300 400 500 600
0 100 200 300
Pop u lation Time sheep cattle goats camels
grass 0
200 400 600 800
0 100 200 300
Pop u lation Time sheep cattle goats camels grass C
A B
33 Figure 11: Herd population dynamics for the 1982 wet season as observed through the model with high raiding pressure and without factoring in prevalence of disease. Figure 11A, B, C, and D represent the population dynamics observed based on the initial number of livestock owned by Angorot, Lorimet, Atot, and Lopericho, respectively, by the end of the 1980-1981 drought.
0 100 200 300 400 500
0 100 200 300
Pop u lation Time sheep cattle goats camels grass 0 200 400 600 800
0 100 200 300
Pop u lation Time sheep cattle goats camels grass 0 200 400 600 800
0 100 200 300
Pop u lation Time sheep cattle goats camels grass 0 200 400 600 800
0 100 200 300
34
Figure 12: Herd population dynamics for the 1982 wet season as observed through the model with prevalence of contagious caprine pleuropneumonia factored in, but without consideration of raiding pressure. Figure 12A, B, C, and D represent the population dynamics observed based on the initial populations of the herds of Angorot, Lorimet, Atot, and Lopericho, respectively, by the end of the 1980-1981 drought.
0 100 200 300 400 500 600
0 100 200 300
Pop u lation Time sheep cattle goats camels grass 0 200 400 600 800
0 100 200 300
Pop u lation Time sheep cattle goats camels grass 0 200 400 600 800
0 100 200 300
Pop u lation Time sheep cattle goats camels grass 0 200 400 600 800
0 100 200 300
Pop u lation Time sheep cattle goats camels grass C
A B
35 Figure 13: Herd population dynamics for the 1982 wet season as observed through the model with high raiding pressure and prevalence of contagious caprine pleuropneumonia factored in to the model. Figure 13A, B, C, and D represent the population dynamics observed based on the initial populations of the herds of Angorot, Lorimet, Atot, and Lopericho, respectively, by the end of the 1980-1981 drought.
0 100 200 300 400 500 600
0 100 200 300
Pop u lation Time sheep cattle goats camels grass 0 200 400 600 800 1000
0 100 200 300
Pop u lation Time sheep cattle goats camels grass 0 200 400 600 800
0 100 200 300
Pop u lation Time sheep cattle goats camels grass 0 200 400 600 800
0 100 200 300
Pop u lation Time sheep cattle goats camels grass C
A B
36 Figure 14: Herd population dynamics for the 1982 wet season as observed through the model with high raiding pressure implemented into the model. In this simulation, only cattle were incorporated into the experiment in an effort to analyze the effects of the separation of cattle on herd population dynamics. Figure 14A, B, C, and D represent the population dynamics observed based on the initial number of cattle owned by Angorot, Lorimet, Atot, and Lopericho,
respectively, by the end of the 1980-1981 drought.
0 200 400 600 800 1000
0 100 200 300
Pop u lation Time cattle grass 0 200 400 600 800 1000
0 100 200 300
Pop u lation Time cattle grass 0 200 400 600 800 1000
0 100 200 300
Pop u lation Time cattle grass 0 200 400 600 800 1000
0 100 200 300
Pop u lation Time cattle grass
C D
A C
37 Figure 15: Herd population dynamics for the 1982 wet season as observed through the model with high raiding pressure implemented into the model. In this simulation, only camels were incorporated into the experiment in an effort to analyze the effects of the separation of camels on herd population dynamics. Figure 15A, B, C, and D represent the population dynamics observed based on the initial number of camels owned by Angorot, Lorimet, Atot, and Lopericho,
respectively, by the end of the 1980-1981 drought.
0 200 400 600 800 1000
0 100 200 300
Pop u lation Time camels grass 0 200 400 600 800 1000
0 100 200 300
Pop u lation Time camel grass 0 200 400 600 800 1000
0 100 200 300
Pop u lation Time camels grass 0 200 400 600 800 1000
0 100 200 300
Pop u lation Time camels grass
A B
38 Figure 16: Herd population dynamics for the 1982 wet season as observed through the model with high raiding pressure and the prevalence of contagious caprine pleuropneumonia
implemented into the model. In this simulation, only goats and sheep were incorporated into the experiment in an effort to analyze the effects of the separation of caprines on herd population dynamics. Figure 16A, B, C, and D represent the population dynamics observed based on the initial number of sheep and goats owned by Angorot, Lorimet, Atot, and Lopericho, respectively, by the end of the 1980-1981 drought.
0 100 200 300 400 500 600 700
0 100 200 300
Pop u lation Time sheep goats grass 0 200 400 600 800 1000
0 100 200 300
Pop u lation Time sheep goats grass 0 200 400 600 800
0 100 200 300
Pop u lation Time sheep goats grass 0 200 400 600 800 1000
0 100 200 300
Pop u lation Time sheep goats grass A
C D
39
Summary of Results
Figure Number Results
3: Drought conditions without consideration of raiding pressure or disease
In three of the four herds, drought conditions led to population cycling between goats and the grass. In the fourth herd, which was dominated with cattle, population cycling was not observed and there was a gradual rise in livestock populations.
4: Drought conditions with high raiding pressure, no consideration of disease
In all four herds, increased raiding pressure led to a decrease in the number of livestock in the model ecosystem. A weak population cycle between goats and grass was still seen in the first herder. In all four herds, the grass available in the model ecosystem increased with increasing raiding pressure.
5: Drought conditions with disease, no consideration of raiding pressure
In the fourth herd, the introduction of contagious bovine pleuropneumonia led to a significant reduction in cattle populations. The significant reduction in cattle population in the fourth herd led to the introduction of a population cycle between the goats and grass, which was not observed in Figure 3. The livestock populations of the other herders were not significantly affected.
6: Drought conditions with high raiding pressure and disease
40 7: Drought conditions with high
raiding pressure and disease, only cattle analyzed
In two of the four herders, the
separation of cattle led to an increase in the population growth rate of cattle. In all four herders, the separation of cattle led to an increase in the availability of grass in the model ecosystem.
8: Drought conditions with high raiding pressure and disase, only camels analyzed
In all four herds, the separation of camels led to an increase in the availability of grass in the model ecosystem. Observable increases in camel populations were not observed in any of the four herds.
9: Drought conditions with high raiding pressure and disease, only sheep and goats analyzed
In all four herds, separation of small livestock led to an increase in the availability of grass in the model ecosystem. Significant increases in small livestock populations were not observed in any of the four herders with the separation of livestock. 10: Wet season conditions without
consideration of raiding pressure or disease
In all four herds, the population growth rate of livestock increased during wet season conditions when compared to Figure 3. Population cycles were not observed in any of the four herders during wet season conditions. As seen in Figure 3, the fourth herd, which was dominated by cattle and had a lower initial livestock population than the other herds, exhibited a slower
population growth rate when compared to the other three herds.
11: Wet season conditions with high raiding pressure, no consideration of disease
In all four herds, the introduction of raiding pressure to the model
ecosystem under wet season conditions led to reductions in livestock
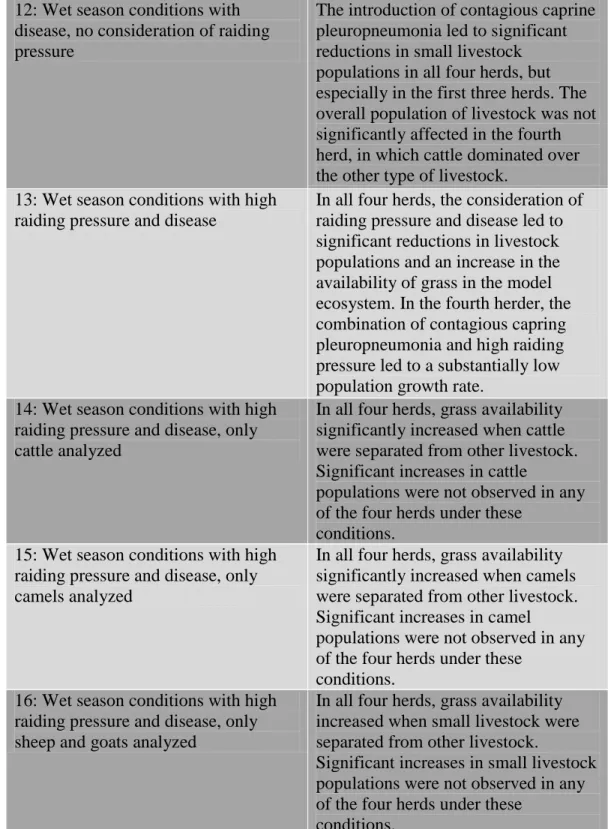
41 12: Wet season conditions with
disease, no consideration of raiding pressure
The introduction of contagious caprine pleuropneumonia led to significant reductions in small livestock populations in all four herds, but especially in the first three herds. The overall population of livestock was not significantly affected in the fourth herd, in which cattle dominated over the other type of livestock.
13: Wet season conditions with high raiding pressure and disease
In all four herds, the consideration of raiding pressure and disease led to significant reductions in livestock populations and an increase in the availability of grass in the model ecosystem. In the fourth herder, the combination of contagious capring pleuropneumonia and high raiding pressure led to a substantially low population growth rate.
14: Wet season conditions with high raiding pressure and disease, only cattle analyzed
In all four herds, grass availability significantly increased when cattle were separated from other livestock. Significant increases in cattle
populations were not observed in any of the four herds under these
conditions. 15: Wet season conditions with high
raiding pressure and disease, only camels analyzed
In all four herds, grass availability significantly increased when camels were separated from other livestock. Significant increases in camel
populations were not observed in any of the four herds under these
conditions. 16: Wet season conditions with high
raiding pressure and disease, only sheep and goats analyzed
In all four herds, grass availability increased when small livestock were separated from other livestock.
Significant increases in small livestock populations were not observed in any of the four herds under these
42
Discussion
Raiding
The comparison between Figures 3 and 4, as well as Figures 10 and 11 provides a glimpse into the effects of raiding on ecological processes. As expected, an increase in raiding pressure led to an overall reduction in herd populations in the model ecosystem. Furthermore, an increase in raiding pressure led to an increase in the amount of grass available within the model ecosystem for both the 1980-1981 drought and the 1982 wet season. This makes sense because the decrease in herd population would lead to an overall decrease in grass consumption, leading to an increase in the amount of grass available in the model ecosystem.
The positive correlation between raiding pressure and the amount of grass available within the model ecosystem brings to light a conclusion reached by McCabe (2004): foraging is intertwined with security in the Turkana ecosystem. The reduction in herd populations has disastrous consequences for Turkana herders and due to the significant reduction in herd populations that results from raiding, it would make sense for Turkana herders to avoid raids if possible. However, as seen in the model, locations with high raiding pressure may provide better foraging opportunities for livestock. Thus, in an effort to sustain the herd population, Turkana herders must consider the trade-off between seeking better foraging opportunities for livestock and ensuring the safety of the herd. Consequently, the necessity of herders to consider raiding pressure when making migration decisions presents a significant limitation to the application of optimal foraging theory to the Turkana ecosystem.
43 population of goats also increased and similarly, when the amount of grass available decreased, the population of goats also decreased, leading to a dynamic population cycle. However, when raiders were introduced to the model ecosystem, the population dynamic was less apparent. Weak population cycles were also observed in Figures 3b and 3c, but when raiders were
introduced to the system, the grass and goat populations became mostly constant after the model ran for 150 tics.
Disease
An insight into the impact of disease on the model ecosystem can be obtained by comparing Figures 3 and 5, as well as Figures 10 and 12. During the drought in the Turkana District between 1980 and 1981, the cattle populations within herds were negatively impacted by the spread of contagious bovine pleuropneumonia. The reduction in cattle populations due to the disease was observed in the model, particularly in the comparison of Figures 3d and 5d, which represented the simulation with the number of livestock owned by Lopericho in 1980 as the initial number of livestock in the model. Although grass and other livestock populations in the model ecosystem were not significantly impacted by the introduction of contagious bovine pleuropneumonia, a weak population cycle did arise between goats and the grass in Figure 5d. This population cycle was not observed in the control experiment in Figure 3d.
44 reduction in sheep and goat populations led to an increase in the amount of grass available within the model ecosystem.
Although the prevalence of contagious caprine pleuropneumonia did contribute to a decrease in the populations of sheep and goats in the simulation in Figure 12d, which was based on the number of livestock owned by Lopericho by the end of 1981, the amount of grass
available in the model ecosystem was not significantly affected. This is because Lopericho adopted a herd management strategy that focused on raising cattle and camel over sheep and goats. Consequently, when contagious caprine pleuropneumonia spread in 1982, Lopericho was able to rely on herding cattle and camel more than the other herders studied by McCabe.
However, when the Turkana District was plagued with contagious bovine pleuropneumonia, the Lopericho’s herd was significantly impacted because of the prevalence of the disease, which was observed in the model. Atot’s herd was also impacted by the spread of contagious bovine
pleuropneumonia and in fact, he lost 86% of his cattle during the 1980-1981 drought (McCabe, 2004). The unpredictability of the appearance of diseases that target a specific type of livestock demonstrates the importance of maintaining a variety of types of livestock.
Separation of Livestock
45 During the 1981 drought simulated using the agent-based model, the populations of sheep, goats, and camel were not significantly altered when each type of livestock was
individually analyzed. However, the cattle population was observed to increase in Figures 7c and d when compared to Figure 6c and d. This increase in cattle population suggests that the
separation of cattle may be favorable during drought conditions, and particularly during the 1980-1981 drought when cattle populations were significantly reduced due to the spread of contagious bovine pleuropneumonia.
During the 1982 wet season, no substantial alterations in camel, cattle, or small stock populations were observed when each type of livestock was explored individually using the model. This is consistent with the data presented by McCabe (2004). In 1982, McCabe found that the four herd owners did not separate cattle, camels, or small stock over the course of the year, with the exception of Lopericho who separated his cattle throughout the entire year.
However, from 1980-1981, all herders separated their cattle and small stock at some point in the year and Angorot even separated his camel for 27 weeks over the two year period (McCabe, 2004).
As previously mentioned, separating livestock in the model led to an increase in the amount of grass available within the ecosystem. However, separating livestock requires additional assistance and labor to maintain the herds and may not always be ecologically
favorable. For instance, during the wet season when there are greater foraging opportunities, the separation of livestock may not be necessary to maintain the size of a herd and in fact, during the 1982 wet season, the four herders studied by McCabe did not separate their livestock.
46 model, the separation of livestock led to an increase in the availability of grass in the model ecosystem. During times of drought the biomass production decreases, which increases the stress of finding foraging opportunities for livestock. As an ecological response to this stress, herders may separate livestock in drought conditions to optimize foraging opportunities when biomass resources are limited. The second factor that may play a role in the separation of livestock during drought conditions is the location of watering points and the water requirements of the different livestock. Although water constraints were not factored into the model, the location of watering points does play a significant role in the migration decisions of Turkana herders. Cattle have the greatest water requirements among the four types of livestock herded by the Turkana and require frequent access to watering points. However, watering points may not be located in areas with high biomass productivity. Therefore, it would not make ecological sense to direct animals with lower water requirements, such as camel to watering points if biomass resources in a region are limited, particularly during a drought. It is likely that both factors contribute to the reasoning behind separating livestock by Turkana herders.
Type of Livestock
The four primary livestock herded by Turkana pastoralists each have different food requirements, reproductive rates, susceptibilities to certain diseases, and labor costs. The
importance of maintaining a variety of livestock was supported in the previous discussion on the impact of disease on herd populations. Additionally, maintaining a variety of livestock may serve as a mechanism of ecological resilience utilized by Turkana herders in their disequilibrium environment.
47 livestock populations. This pattern can be explained by the high reproductive rate of goats when compared to the other livestock.
During times of stress when Turkana herders lose large numbers of livestock due to raiding, famine, or disease, herders may take advantage of the high reproductive rate of goats in an effort to optimize the size of their herd (McCabe, 2004). When the overall herd population is significantly reduced, a herder may trade cattle or camels in exchange for goats. The herders will then allow their goat to reproduce and after a certain time, many pastoralists will exchange their goats for either camels or cattle. Camels are favored over goats because of their high milk production. Over the course of a year, the typical camel produces between 552-1668 mL of milk per day, as compared to goats, which produce only 63-177 mL of milk per day (McCabe,
2004:79). Cattle are also favored over goats because of their low labor costs and because of the role that cattle ownership plays in the social status among the Turkana (McCabe, 2004).
Size of Herds
48 in goat population. However, Lopericho, who owned the fewest number of small livestock in 1980, experienced the slowest goat population growth based on the model.
A second consequence of small herd size is that there is a greater chance that all animals will die off if the herd experiences a drought, disease, or raid. For example, if five animals die in a herd containing one hundred animals, the ecological impact will be minimal. However, if five animals die in a herd containing ten animals, there will be much greater ecological consequences. This conclusion is also supported by the model, particularly in Figure 6, which demonstrates the impact of raiding and contagious bovine pleuropneumonia on cattle populations. After 300 tics, Lopericho was found to have a higher cattle population than the other herders as seen in Figure 6d, which makes sense because Lopericho started off with a higher cattle population than the other herders in the simulation.
Limitations of the Model
As with any model that attempts to simulate conditions as they appear in the natural world, there are limitations to the model that must be addressed. There are two specific factors affecting the population of herds that the model does not address, including the exchange of bridewealth camel and the consumption of livestock by the herders themselves. Between 1971 and 1994, Terrence McCabe (2004:192) calculated that 91 camels, 131 cattle, and 403 sheep and goats were given out in bridewealth to bring wives into Angorot’s family. Specifically, in 1981 three camel and three cattle left the herd to bring in Angorot’s brother Aki’s first wife, Nangiro
49 two options are unfavorable, the sacrificing of animals does occur and bears significant
ecological consequences, which the model does not account for.
Furthermore, the model does not account for the influence of the decisions of other pastoralists on an individual’s herd management strategy. However, the migration patterns of other herders may significantly impact the migration patterns of other individuals. As a
theoretical case, if there were a patch with high biomass productivity, it may not be favorable if every herder migrated towards the location because the effects of competition might diminish the quality of foraging in the patch.
On a similar note, the model fails to account for the amount of work required to raise livestock. Currently, the maximum population of a herd in the model is regulated by the carrying capacity of the model ecosystem. However, the maximum population of a herd is also regulated by the capabilities of a herder because a large herd size could cause problems in the management of the herd. McCabe (2004) estimated that the maximize size of a herd that the average herder can manage is around 150 animals. However, this number can be adjusted based on the amount of help that a herder has with maintaining the herd.
Finally, the model does not provide a full assessment of the nutritional requirements of livestock. Specifically, camels require a diet with a high salt content. Without a sufficient intake of salt, camels may become sick (Smith, 1992). Additionally, the model does not account for the presence of non-herbaceous plants that livestock can feed on. For example, camels do not need to consume large quantities of herbaceous plants because they are physiologically adapted to meet their water needs through dry desert vegetation. Moreover, sheep and goats are able to obtain food from shrubs and other browse, which are not included in the model.
50 Admittedly, there are several limitations to the agent-based model designed for this project, including the failure to account for the exchange of cattle through bridewealth practices, the slaughtering of livestock, the impact of decisions by other herders on an individual’s herd management strategy, the labor costs associated with raising different livestock, the variety of plant types consumed by livestock in the Turkana District, and the salt requirements of camels. However, there were also significant conclusions that could be drawn from the model that provide a better understanding of the relationship between the Turkana and their disequilibrium ecosystem.
The goal of the project at the onset was to analyze how optimal foraging theory relates to the Turkana and to advocate for the use of agent-based modeling within the field of ecological anthropology. It is now time to discuss whether these initial goals were achieved.
51 result, the separation of livestock seems to be governed by optimal foraging theory during times of ecological stress.
However, the project also demonstrated that security during periods of high predation pressure may undermine the importance of optimal foraging theory in making herd management decisions. The model showed that increased raiding pressure led to an increase in the amount of grass available within the ecosystem. However, raids can significantly decrease the population of herds and generate disastrous consequences for the herd. As a result, even though locations with high predation pressure may have high biomass productivity, it may be unfavorable to migrate to the location if there are other safe locations that provide foraging opportunities for livestock. Thus, while optimal foraging theory may sometimes play a role in the herd management decisions of the Turkana, there are other factors that contribute to herd management strategies.
52
Appendix A
Coding Procedure Utilized to Create the Agent-Based Model
globals [grass water] ;; keep track of how much grass and water there is ;; Sheep, cow, camel, goat, and soldier are breeds of turtles.
breed [sheep a-sheep] ;; sheep is its own plural, so we use "a-sheep" as the singular. breed [cow a-cow]
breed [camel a-camel] breed [goat a-goat] breed [soldier a-soldier]
turtles-own [energy] ;; both soldier and sheep have energy
patches-own [countdown] ;; number of patches decreases as patches are consumed to setup
clear-all
ask patches [ set pcolor green ] ;; sets patch color to green for grass ask patches [ set pcolor blue ] ;; sets patch color to blue for water ;; check GRASS? switch.
;;if it is true, then grass grows and the sheep eat it ;;if it is false, then the sheep don't need to eat if grass? [
ask patches [
set countdown random grass-regrowth-time ;; initialize grass grow clocks randomly set pcolor one-of [green brown]
] ]
if water? [ ask patches [
set countdown random water-regrowth-time set pcolor one-of [blue white]
] ]
set-default-shape sheep "sheep"
create-sheep initial-number-sheep ;; create the sheep, then initialize their variables [
set color white
set size 1.5 ;; easier to see set label-color blue - 2
set energy random (2 * sheep-gain-from-food) ;; energy possessed by sheep setxy random-xcor random-ycor ;; defines random movement of sheep ]
set-default-shape cow "cow" create-cow initial-number-cow [
53 set size 2.0
set label-color green - 2
set energy random (2 * cow-gain-from-food) setxy random-xcor random-ycor
]
set-default-shape camel "camel" create-camel initial-number-camel [
set color yellow set size 2.0
set label-color green - 2
set energy random (2 * camel-gain-from-food) setxy random-xcor random-ycor
]
set-default-shape goat "goat" create-goat initial-number-goat [
set color grey set size 2.0
set label-color green - 2
set energy random (2 * goat-gain-from-food) setxy random-xcor random-ycor
]
set-default-shape soldier "soldier"
create-soldier initial-number-soldier ;; create the soldier, then initialize their variables [
set color black
set size 2 ;; easier to see
set energy random (2 * soldier-gain-from-food) setxy random-xcor random-ycor
]
display-labels
set grass count patches with [pcolor = green] set water count patches with [pcolor = blue ] reset-ticks
end
to go ;; turtle procedure if not any? turtles [ stop ] ask sheep [
move-sheep if grass? [
set energy energy - 1 ;; deduct energy for sheep only if grass? switch is on eat-grass ;; sheep consumes grass
]
54 set energy energy - 1
eat-water ]
check-death reproduce-sheep ]
ask cow [ move-cow if grass? [
set energy energy - 1 eat-grass
]
if water? [
set energy energy - 1 eat-water
]
check-death reproduce-cow ]
ask camel [ move-camel if grass? [
set energy energy - 1 eat-grass
]
if water? [
set energy energy - 1 eat-water
]
check-death reproduce-camel ]
ask goat [ move-goat if grass? [
set energy energy - 1 eat-grass
]
if water? [
set energy energy - 1 eat-water
]
check-death reproduce-goat ]
55 catch-sheep ;; soldier eats sheep
catch-cow catch-camel catch-goat ]
if grass? [ ask patches [ grow-grass ] ] ;; patches grow when grass? switch is on set grass count patches with [pcolor = green]
if water? [ ask patches [ grow-water ] ] set water count patches with [pcolor = blue ] tick
if ticks = 1000 [ stop ] ;; simulation stops after 1000 ticks display-labels
end
to move-sheep ;; turtle procedure
rt random 50 ;; sheep move randomly around the system lt random 50
fd 1
set energy energy - sheep-lose-from-moving ;; sheep lose energy from moving end
to move-cow rt random 50 lt random 50 fd 1
set energy energy - cow-lose-from-moving end
to move-camel rt random 50 lt random 50 fd 1
set energy energy - camel-lose-from-moving end
to move-goat ;; turtle procedure rt random 50
lt random 50 fd 1
set energy energy - goat-lose-from-moving end
56 ;;end
to eat-grass ;; sheep procedure
;; sheep eat grass, turn the patch brown if pcolor = green [
set pcolor brown
set energy energy + sheep-gain-from-food ;; sheep gain energy by eating set energy energy + cow-gain-from-food
set energy energy + camel-gain-from-food set energy energy + goat-gain-from-food ]
end
to eat-water ;; turtle procedure if pcolor = blue [
set pcolor white
set energy energy + sheep-gain-from-water ;; sheep gain energy by consuming water set energy energy + cow-gain-from-water
set energy energy + camel-gain-from-water set energy energy + goat-gain-from-water ]
end
to reproduce-sheep ;; turtle procedure
if random-float 100 < sheep-reproduce [ ;; throw "dice" to see if you will reproduce set energy (energy / 2) ;; divide energy between parent and offspring hatch 1 [ rt random-float 360 fd 1 ] ;; hatch an offspring and move it forward 1 step ]
end
to reproduce-cow
if random-float 100 < cow-reproduce [ ;; throw dice to see if you will reproduce set energy (energy / 2)
hatch 1 [ rt random-float 360 fd 1 ] ]
end
to reproduce-camel
if random-float 100 < camel-reproduce [ set energy (energy / 2)
hatch 1 [ rt random-float 360 fd 1 ] ]
end
to reproduce-goat
57 set energy (energy / 2)
hatch 1 [ rt random-float 360 fd 1 ] ]
end
to catch-sheep ;; a-soldier procedure
let prey one-of sheep-here ;; grab a random sheep if prey != nobody ;; did we get one? if so, [ ask prey [ die ] ;; kill it
set energy energy + soldier-gain-from-food ] ;; get energy from eating end
to catch-cow
let prey one-of cow-here if prey != nobody
[ ask prey [ die ]
set energy energy + soldier-gain-from-food ] end
to catch-camel
let prey one-of camel-here if prey != nobody
[ ask prey [die]
set energy energy + soldier-gain-from-food ] end
to catch-goat
let prey one-of goat-here if prey != nobody
[ ask prey [die]
set energy energy + soldier-gain-from-food ] end
to check-death ;; turtle procedure ask sheep [
if energy < 20 [die] ;; sheep die if energy is less than 25 ]
ask cow [
if energy < 20 [die] ]
ask camel [
if energy < 20 [die] ]
ask goat [
58 end
to grow-grass ;; patch procedure
;; countdown on brown patches: if reach 0, grow some grass if pcolor = brown [
ifelse countdown <= 0 [ set pcolor green
set countdown grass-regrowth-time ] [ set countdown countdown - 1 ] ]
end
to grow-water ;; patch procedure if pcolor = white [
ifelse countdown <= 0 [ set pcolor blue
set countdown water-regrowth-time ] [ set countdown countdown - 1 ] ]
end
to display-labels ;; used to label turtles and patches on monitor ask turtles [ set label "" ]
if show-energy? [
ask soldier [ set label round energy ]
if grass? [ ask sheep [ set label round energy ] ] if grass? [ ask cow [ set label round energy ] ] if grass? [ ask camel [set label round energy ] ] if grass? [ ask goat [set label round energy ] ] if water? [ ask sheep [ set label round energy ] ] if water? [ ask cow [ set label round energy ] ] if water? [ ask camel [ set label round energy ] ] if water? [ ask goat [ set label round energy ] ] ]