ARTICLES
A second generation human haplotype
map of over 3.1 million SNPs
The International HapMap Consortium*
We describe the Phase II HapMap, which characterizes over 3.1 million human single nucleotide polymorphisms (SNPs) genotyped in 270 individuals from four geographically diverse populations and includes 25–35% of common SNP variation in the populations surveyed. The map is estimated to capture untyped common variation with an average maximumr2of between 0.9 and 0.96 depending on population. We demonstrate that the current generation of commercial genome-wide genotyping products captures common Phase II SNPs with an average maximumr2of up to 0.8 in African and up to 0.95 in non-African populations, and that potential gains in power in association studies can be obtained through imputation. These data also reveal novel aspects of the structure of linkage disequilibrium. We show that 10–30% of pairs of individuals within a population share at least one region of extended genetic identity arising from recent ancestry and that up to 1% of all common variants are untaggable, primarily because they lie within recombination hotspots. We show that recombination rates vary systematically around genes and between genes of different function. Finally, we demonstrate increased differentiation at non-synonymous, compared to synonymous, SNPs, resulting from systematic differences in the strength or efficacy of natural selection between populations.
Advances made possible by the Phase I haplotype map
The International HapMap Project was launched in 2002 with the aim of providing a public resource to accelerate medical genetic research. The objective was to genotype at least one common SNP every 5 kilobases (kb) across the euchromatic portion of the genome in 270 individuals from four geographically diverse populations1,2: 30 mother–father–adult child trios from the Yoruba in Ibadan, Nigeria (abbreviated YRI); 30 trios of northern and western European ances-try living in Utah from the Centre d’Etude du Polymorphisme Humain (CEPH) collection (CEU); 45 unrelated Han Chinese indi-viduals in Beijing, China (CHB); and 45 unrelated Japanese indivi-duals in Tokyo, Japan (JPT). The YRI samples and the CEU samples each form an analysis panel; the CHB and JPT samples together form an analysis panel. Approximately 1.3 million SNPs were genotyped in Phase I of the project, and a description of this resource was pub-lished in 2005 (ref. 3).
The initial HapMap Project data had a central role in the develop-ment of methods for the design and analysis of genome-wide asso-ciation studies. These advances, alongside the release of commercial platforms for performing economically viable genome-wide geno-typing, have led to a new phase in human medical genetics. Already, large-scale studies have identified novel loci involved in multiple complex diseases4,5. In addition, the HapMap data have led to novel insights into the distribution and causes of recombination hot-spots3,6, the prevalence of structural variation7,8and the identity of genes that have experienced recent adaptive evolution3,9. Because the HapMap cell lines are publicly available, many groups have been able to integrate their own experimental data with the genome-wide SNP data to gain new insight into copy-number variation10, the relation-ship between classical human leukocyte antigen (HLA) types and SNP variation11, and heritable influences on gene expression12–14. The ability to combine genome-wide data on such diverse aspects of genetic variation with molecular phenotypes collected in the same samples provides a powerful framework to study the connection of DNA sequence to function.
In Phase II of the HapMap Project, a further 2.1 million SNPs were successfully genotyped on the same individuals. The resulting HapMap has an SNP density of approximately one per kilobase and is estimated to contain approximately 25–35% of all the 9–10 million common SNPs (minor allele frequency (MAF)$0.05) in the assembled human genome (that is, excluding gaps in the reference sequence alignment; see Supplementary Text 1), although this num-ber shows extensive local variation. This paper describes the Phase II resource, its implications for genome-wide association studies and additional insights into the fine-scale structure of linkage disequilib-rium, recombination and natural selection.
Construction of the Phase II HapMap
Most of the additional genotype data for the Phase II HapMap were obtained using the Perlegen amplicon-based platform15. Briefly, this platform uses custom oligonucleotide arrays to type SNPs in DNA segmentally amplified via long-range polymerase chain reaction (PCR). Genotyping was attempted at 4,373,926 distinct SNPs, which corresponds, with exceptions (see Methods), to nearly all SNPs in dbSNP release 122 for which an assay could be designed. Additional submissions were included from the Affymetrix GeneChip Mapping Array 500K set, the Illumina HumanHap100 and HumanHap300 SNP assays, a set of,11,000 non-synonymous SNPs genotyped by Affymetrix (ParAllele) and a set of,4,500 SNPs within the extended major histocompatibility complex (MHC)11. Genotype submissions were subjected to the same quality control (QC) filters as described previously (see Methods) and mapped to NCBI build 35 (University of California at Santa Cruz (UCSC) hg17) of the human genome. The re-mapping of SNPs from Phase I of the project identified 21,177 SNPs that had an ambiguous position or some other feature indi-cative of low reliability; these are not included in the filtered Phase II data release. All genotype data are available from the HapMap Data Coordination Center (http://www.hapmap.org) and dbSNP (http:// www.ncbi.nlm.nih.gov/SNP); analyses described in this paper refer to release 21a. Three data sets are available: ‘redundant unfiltered’ *Lists of participants and affiliations appear at the end of the paper.
contains all genotype submissions, ‘redundant filtered’ contains all submissions that pass QC, and ‘non-redundant filtered’ contains a single QC1submission for each SNP in each analysis panel.
The QC filters remove SNPs showing gross errors. However, it is also important to understand the magnitude and structure of more subtle genotyping errors among SNPs that pass QC. We therefore carried out a series of analyses to assess the influence of the long-range PCR amplicon structure on genotyping error, the concordance rates between genotype calls from different genotyping platforms and between those platforms and re-sequencing assays, as well as the rates of false monomorphism and mis-mapping of SNPs (see Supplemen-tary Text 2, SupplemenSupplemen-tary Figs 1–3 and SupplemenSupplemen-tary Tables 1–4). We estimate that the average per genotype accuracy is at least 99.5%. However, there are higher rates of missing data and genotype discre-pancies at non-reference alleles, with some clustering of errors result-ing from the amplicon design and a few incorrectly mapped SNPs.
Table 1 shows the numbers of SNPs attempted and converted to QC1SNPs in each analysis panel (Supplementary Table 5 shows a breakdown by each major submission). Haplotypes and missing data were estimated for each analysis panel separately using both trio information and statistical methods based on the coalescent model (see Methods). To enable cross-population comparisons, a con-sensus data set was created consisting of 3,107,620 SNPs that were QC1in all analysis panels and polymorphic in at least one analysis panel. The equivalent figure from Phase I was 931,340 SNPs. Unless stated otherwise, all analyses have been carried out on the consensus data set. An additional set of haplotypes was created for those SNPs in the consensus where a putative ancestral state could be assigned by
comparison of the human alleles to the orthologous position in the chimpanzee and rhesus macaque genomes.
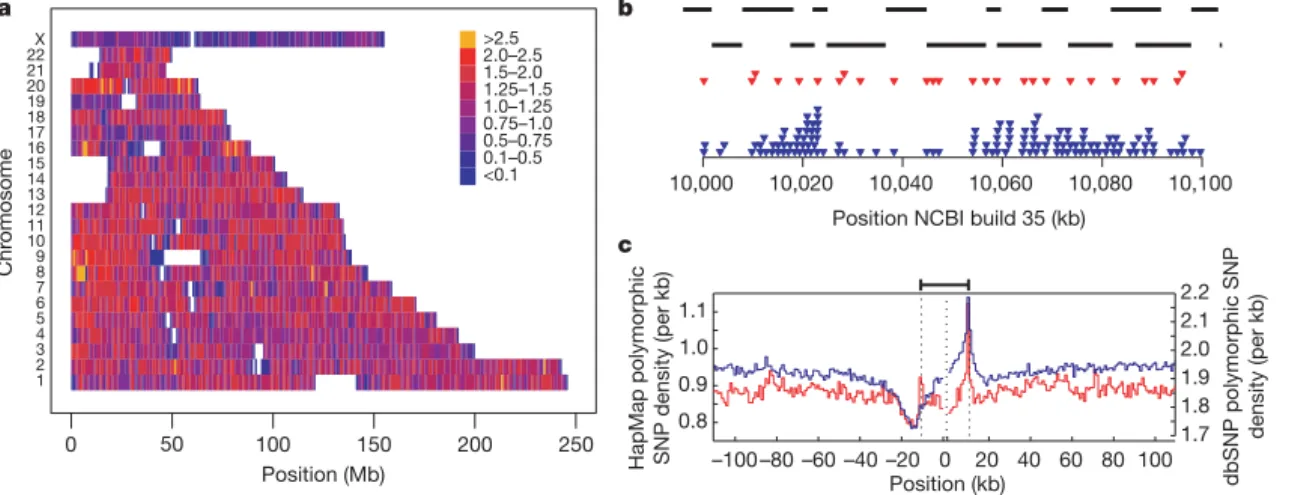
The variation in SNP density within the Phase II HapMap is shown in Fig. 1. On average there are 1.14 genotyped polymorphic SNPs per kilobase (average spacing is 875 base pairs (bp)) and 98.6% of the assembled genome is within 5 kb of the nearest polymorphic SNP. Still, there is heterogeneity in genotyped SNP density at both broad (Fig. 1a) and fine (Fig. 1b) scales. Furthermore, there are systematic changes in genotyped SNP density around genomic features includ-ing genes (Fig. 1c).
The Phase II HapMap differs from the Phase I HapMap not only in SNP spacing, but also in minor allele frequency distribution and patterns of linkage disequilibrium (Supplementary Fig. 4). Because the criteria for choosing additional SNPs did not include considera-tion of SNP spacing or preferential selecconsidera-tion for high MAF, the SNPs added in Phase II are, on average, more clustered and have lower MAF than the Phase I SNPs. Because MAF predictably influences the distribution of linkage disequilibrium statistics, the averager2at a given physical distance is typically lower in Phase II than in Phase I; conversely, thejD9jstatistic is typically higher (data not shown). One notable consequence is that the Phase II HapMap includes a better representation of rare variation than the Phase I HapMap.
The increased resolution provided by Phase II of the project is illustrated in Fig. 2. Broadly, an additional SNP added to a region shows one of three patterns. First, it may be very similar in distribution to SNPs present in Phase I. Second, it may provide detailed resolution of haplotype structure (for example, a group of chromosomes with identical local haplotypes in Phase I can be shown in Phase II to carry
Table 1|Summary of Phase II HapMap data (release 21)
Phase SNP categories Analysis panel
YRI CEU CHB1JPT
I Assays submitted 1,304,199 1,344,616 1,306,125
Passed QC 1,177,312(90%) 1,217,902(91%) 1,187,800(91%)
Did not pass QC 126,887(10%) 126,714(9%) 118,325(9%)
.20% missing 82,463(65%) 95,684(76%) 78,323(66%)
.1duplicate inconsistent 6,049(5%) 5,126(4%) 9,242(8%)
.1mendelian error 18,916(15%) 11,310(9%) N/A
,0.001Hardy–WeinbergP-value 10,265(8%) 8,922(7%) 13,722(12%)
Other failures 19,345(15%) 13,858(11%) 20,674(17%)
II Assays submitted 5,044,989 5,044,996 5,043,775
Passed QC 3,150,433(62%) 3,204,709(64%) 3,244,897(64%)
Did not pass QC 1,894,556(38%) 1,840,287(36%) 1,798,878(36%)
.20% missing 1,419,000(75%) 1,398,166(76%) 1,403,543(78%)
.1duplicate inconsistent 0(0%) 0(0%) 6,617(0%)
.1mendelian error 172,339(9%) 127,923(7%) N/A
,0.001Hardy–WeinbergP-value 96,231(5%) 82,268(4%) 108,880(6%)
Other failures 334,511(18%) 337,906(18%) 340,370(19%)
Overall Assays submitted 6,349,188 6,389,612 6,349,900
Passed QC 4,327,745(68%) 4,422,611(69%) 4,432,697(70%)
Did not pass QC 2,021,443(32%) 1,967,001(31%) 1,917,203(30%)
.20% missing 1,501,463(74%) 1,493,850(76%) 1,481,866(77%)
.1duplicate inconsistent 6,049(0%) 5,126(0%) 15,859(1%)
.1mendelian error 191,255(9%) 139,233(7%) N/A
,0.001Hardy–WeinbergP-value 106,496(5%) 91,190(5%) 122,602(6%)
Other failures 353,856(18%) 351,764(18%) 361,044(19%)
Non-redundant (unique) SNPs 3,796,934 3,868,157 3,890,416
Monomorphic 861,299(23%) 1,246,183(32%) 1,410,152(36%)
Polymorphic 2,935,635(77%) 2,621,974(68%) 2,480,264(64%)
SNP categories All analysis panels
Unique QC-passed SNPs 4,000,107
Passed in one analysis panel 88,140(2%)
Passed in two analysis panels 268,534(7%)
Passed in three analysis panels (QC13) 3,643,433(91%)
QC13and monomorphic across
three analysis panels
535,813
QC13and polymorphic in at least one analysis panel 3,107,620
QC13and polymorphic in all three analysis panels 2,006,352
QC13and MAF$0.05in at least
one of three analysis panels
multiple related haplotypes). Third, the novel SNP (or group of added SNPs) may reveal previously missed recombinant haplotypes. The extent to which each type of event occurs varies among populations and chromosomal regions. The greatest gains in resolution, in terms of identifying new recombinant haplotypes and haplotype groupings, occur in YRI. Consequently, the Phase II HapMap provides increased resolution in the estimated fine-scale genetic map and improved power to detect and localize recombination hotspots (Fig. 2b).
The use of the Phase II HapMap in association studies
The increased SNP density of the Phase II HapMap has already been extensively exploited in genome-wide studies of disease association.
In this section, we quantify the gain in resolution and outline how the HapMap data can be used to improve the power of association studies.
Improved coverage of common variation.We previously predicted that the vast majority of common SNPs would be correlated to Phase II HapMap SNPs by extrapolation from the ten HapMap ENCODE regions3. Using the actual Phase II marker spacing and frequency distributions (Table 2), we repeated the simulations and estimate that Phase II HapMap marker sets capture the overwhelming ma-jority of all common variants at high r2. For common variants (MAF$0.05) the mean maximumr2of any SNP to a typed one is 0.90 in YRI, 0.96 in CEU and 0.95 in CHB1JPT. The impact of the
10,000 10,020 10,040 10,060 10,080 10,100
Position NCBI build 35 (kb)
b
0 100
Position (Mb)
Chr
o
mosome
50 150
a
>2.5 2.0–2.5 1.5–2.0 1.25–1.5 1.0–1.25 0.75–1.0 0.5–0.75 0.1–0.5 <0.1
–100 –80 –60 –40 –20 0 20 40 60 80 100 0.8
0.9 1.0 1.1
Position (kb)
HapMap polymorphic SNP density (per kb)
1.7 1.8 1.9 2.0 2.1 2.2
dbSNP polymorphic SNP
density (per kb)
c
250 200
10 15 20
5 X
1 2 3 21 19 18 17 16 14 13 12 11 9 22
8 7 6 4
Figure 1|SNP density in the Phase II HapMap. a, SNP density across the genome. Colours indicate the number of polymorphic SNPs per kb in the consensus data set. Gaps in the assembly are shown as white.b, Example of the fine-scale structure of SNP density for a 100-kb region on chromosome 17 showing Perlegen amplicons (black bars), polymorphic Phase I SNPs in the consensus data set (red triangles) and polymorphic Phase II SNPs in the consensus data set (blue triangles). Note the relatively even spacing of Phase
I SNPs.c, The distribution of polymorphic SNPs in the consensus Phase II HapMap data (blue line and left-hand axis) around coding regions. Also shown is the density of SNPs in dbSNP release 125 around genes (red line and right-hand axis). Values were calculated separately 59from the coding start site (the left dotted line) and 39from the coding end site (right dotted line) and were joined at the median midpoint position of the coding unit (central dotted line).
cM Mb
–1
5160000 5180000 5200000
Position (NCBI build 35)
5220000 5240000
OR51V1 HBB HBE HBD HBG1 HBG2
0 20 40 60 80
a
b
Figure 2|Haplotype structure and recombination rate estimates from the Phase II HapMap. a, Haplotypes from YRI in a 100 kb region around the
b-globin (HBB) gene. SNPs typed in Phase I are shown in dark blue. Additional SNPs in the Phase II HapMap are shown in light blue. Only SNPs for which the derived allele can be unambiguously identified by parsimony (by comparison with an outgroup sequence) are shown (89% of SNPs in the
region); the derived allele is shown in colour.b, Recombination rates (lines) and the location of hotspots (horizontal blue bars) estimated for the same region from the Phase I (dark blue) and Phase II HapMap (light blue) data. Also shown are the location of genes within the region (grey bars) and the location of the experimentally verified recombination hotspot57,58at the 59
end of theHBBgene (black bar).
increased density of the Phase II HapMap is most notable in YRI (in the Phase I HapMap the mean maximumr2was 0.67). Similar results are found if a threshold ofr2$0.8 is used to determine whether an SNP is captured (Table 2). As expected, very common SNPs with MAF.0.25 are captured extremely well (mean maximumr2of 0.93 in YRI to 0.97 in CEU), whereas rarer SNPs with MAF,0.05 are less well covered (mean maximumr2of 0.74 in CHB1JPT to 0.76 in YRI). The latter figure is probably an overestimate because it is based on lower frequency SNPs discovered via re-sequencing 48 HapMap individuals, and does not include a much larger number of very rare SNPs. We also assessed the increase in coverage provided by using two-SNP haplotypes as proxies for SNPs that are poorly captured by single SNPs16(Table 2). These two-SNP haplotypes lead to a modest increase in mean maximumr2of 0.01 to 0.03 across all allele frequen-cies. However, in some regions, particularly where marker density is low, gains from multi-marker and imputation approaches in prac-tical situations can be substantial (see below).
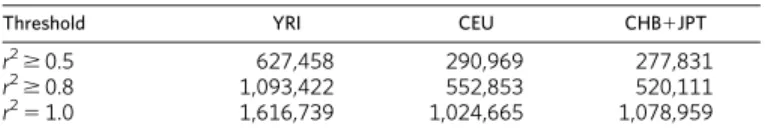
Currently, the Phase II HapMap provides the most complete avail-able resource for selecting tag SNPs genome-wide. Using a simple pairwise tagging approach, we find that 1.09 million SNPs are required to capture all common Phase II SNPs with r2$0.8 in YRI, with slightly more than 500,000 required in CEU and CHB1JPT (Table 3). These numbers are approximately twice those required to capture SNPs in the Phase I HapMap (which has one-third as many SNPs). The number of SNPs required to achieve per-fect tagging (r251.0) in each analysis panel is almost double that required to achieve ther2$0.8 threshold. It becomes increasingly
expensive to improve the coverage afforded by tags from the Phase I and, now, the Phase II HapMap, because additional tag SNPs are unlikely to capture large groups of additional SNPs.
Phase II HapMap and genome-wide association studies.Although the efficient choice of tag SNPs is one use of the Phase II HapMap, for most disease studies the tag SNPs genotyped will be primarily deter-mined by the choice of a commercial platform for the experiment17,18. Using Phase II data, we estimated the coverage of several available products on which genome-wide association studies are already underway (Table 4). Similar to earlier estimates17,18, these products typically perform well in CEU and CHB1JPT, and some also per-form well in YRI. For example, arrays of approximately 500,000 SNPs capture 68–88% (depending on selection method) of all HapMap Phase II variation withr2$0.8 in CEU. SNPs that are not included in the Phase II HapMap will be covered more poorly because most genotyping products were designed using HapMap data.
HapMap data have several additional roles in the analysis of dis-ease-association studies using fixed marker sets. For example, the high-quality haplotype information within the Phase II HapMap can be used to aid the phasing of genotype data from new samples because additional haplotypes are likely to be locally very similar to at least one haplotype in the Phase II data. By a similar argument, missing genotypes can potentially be inferred through comparison to the Phase II haplotypes. Genotypes may be missing either because of genotyping failure or because the SNP was not assayed within the experiment. Therefore, the HapMap haplotypes provide a way ofin silicogenotyping Phase II SNPs that were not included in the experiment.
Although there is no clear consensus yet about the role of SNP imputation in the analysis of genome-wide association studies, high imputation accuracy can be achieved using model-based meth-ods19–23and can lead to an increase in power23,24. To illustrate the possibilities, in the 500-kb HapMap ENCODE region on 8q24.11 (Supplementary Fig. 5) we evaluated imputation of Phase II SNPs from the Affymetrix GeneChip 500K array. To do this, we used a Table 2|Estimated coverage of the Phase II HapMap in the ten HapMap ENCODE regions
Panel MAF bin Phase I HapMap3
Phase II HapMap
Pairwise linkage disequilibrium Additional2-SNP tests
r2
$0.8(%) Mean maximumr2 r2$0.8(%) Mean maximumr2 r2$0.8(%) Mean maximumr2
YRI $0.05 45 0.67 82 0.90 87 0.93
,0.05 61 0.76 62 0.78
0.05–0.10 81 0.89 81 0.89
0.10–0.25 90 0.94 90 0.95
0.25–0.50 87 0.93 92 0.96
CEU $0.05 74 0.85 93 0.96 95 0.97
,0.05 70 0.79 72 0.81
0.05–0.10 87 0.92 88 0.93
0.10–0.25 94 0.96 95 0.97
0.25–0.50 95 0.97 97 0.98
CHB1JPT $0.05 72 0.83 92 0.95 95 0.97
,0.05 65 0.74 65 0.74
0.05–0.10 81 0.89 82 0.89
0.10–0.25 90 0.94 90 0.95
0.25–0.50 94 0.96 97 0.98
2-SNP tests, linkage disequilibrium to haplotypes formed from two nearby SNPs.
Table 4|Estimated coverage of commercially available fixed marker arrays
Platform* YRI CEU CHB1JPT
r2
$0.8(%) Mean maximumr2 r2$0.8(%) Mean maximumr2 r2$0.8(%) Mean maximumr2
Affymetrix GeneChip500K 46 0.66 68 0.81 67 0.80
Affymetrix SNP Array6.0 66 0.80 82 0.90 81 0.89
Illumina HumanHap300 33 0.56 77 0.86 63 0.78
Illumina HumanHap550 55 0.73 88 0.92 83 0.89
Illumina HumanHap650Y 66 0.80 89 0.93 84 0.90
Perlegen600K 47 0.68 92 0.94 84 0.90
* Assuming all SNPs on the product are informative and pass QC; in practice these numbers are overestimates. Table 3|Number of tag SNPs required to capture common (MAF$0.05)
Phase II SNPs
Threshold YRI CEU CHB1JPT
r2
$0.5 627,458 290,969 277,831
r2
$0.8 1,093,422 552,853 520,111
r2
leave-one-out procedure to assess the accuracy of genotype predic-tion in the YRI. For SNPs with MAF$0.2, the average maximumr2 to a typed SNP in the region is 0.59 compared to an average genotype predictionr2of 0.86. Furthermore, whereas 44% of such SNPs in the region have no single-marker proxy withr2$0.5, fewer than 6% of the SNPs have a genotype imputation accuracy ofr2,0.5, establish-ing that accurate imputation can be achieved even in the population where linkage disequilibrium is the weakest.
New insights into linkage disequilibrium structure
The paradigm underlying association studies is that linkage disequi-librium can be used to capture associations between markers and nearby untyped SNPs. However, the Phase II HapMap has revealed several properties of linkage disequilibrium that illustrate the full complexity of empirical patterns of genetic variation. Two striking features are the long-range similarity among haplotypes, and SNPs that show almost no linkage disequilibrium with any other SNP.
The extent of recent common ancestry and segmental sharing.A simplified view of linkage disequilibrium is that genetic variation is organized in relatively short stretches of strong linkage disequilib-rium (haplotype blocks), each containing only a few common hap-lotypes and separated by recombination hotspots across which little association remains25. Although this view has heuristic value, if chro-mosomes share a recent common ancestor then similarity between chromosomes can extend over considerable genetic distance and span multiple recombination hotspots26. The extent of such recent ancestry in the four populations surveyed here has not been characterized
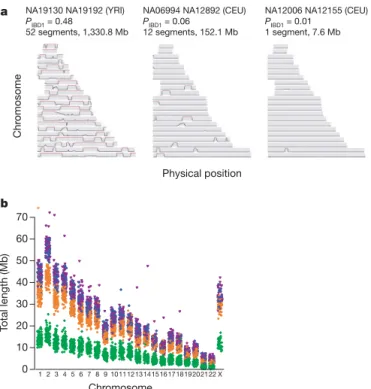
previously. Therefore we identified stretches of identity between pairs of chromosomes, both within and across individuals, reflecting auto-zygosity and identity-by-descent (IBD) (Fig. 3a). After first checking for stratification within each analysis panel (see Supplementary Text 3; none was found for YRI, CEU and JPT, and only small stratification was found for CHB), we calculated genome-wide probabilities of sharing 0, 1 or 2 chromosomes identical by descent for each pair of individuals (see Supplementary Text 4). In addition to identifying a few close relationships (as reported in HapMap Phase I3), we estimate that, on average, any two individuals from the same population share approximately 0.5% of their genome through recent IBD (Table 5). Using a hidden Markov model approach27(see Supplementary Text 5), we searched for such shared segments over 1-megabase (Mb) long and containing at least 50 SNPs, after first pruning the list of SNPs to remove local linkage disequilibrium. We find that 10–30% of pairs in each analysis panel share regions of extended identity resulting from sharing a common ancestor within 10–100 generations. These regions typically span hundreds of SNPs and can extend over tens of megabases (Table 5).
Similarly, extended stretches of homozygosity are indicative of recent inbreeding within populations28,29. Although short runs of homozygosity are commonplace, covering up to one-third of the genome and showing population differences reflective of ancient linkage disequilibrium patterns (Table 5 and Fig. 3b), very long homozygous runs exist that are clearly distinct from this process. Including two JPT individuals who have unusually high levels of homozygosity (NA18987 and NA18992) and one CEU individual (NA12874), we identified 79 homozygous regions over 3 Mb in 51 individuals, with many segments extending over 10 Mb (Supplemen-tary Tables 7 and 8). Segments intersecting with suspected deletions were first removed from the analysis (Supplementary Text 6).
In studies of rare mendelian diseases, the extended haplotype shar-ing surroundshar-ing recent mutations, usually with a frequency of much less than 1%, has been exploited to great advantage through homo-zygosity mapping30,31and haplotype sharing32methods. In studies of common disease, extended haplotype sharing among patients poten-tially offers a route for identifying rare variants (MAF in the range of 1–5%) of high penetrance33,34, which tend to be poorly captured through single-marker association with genome-wide arrays. To illustrate the idea, we identified SNPs where only two copies of the minor allele are present (referred to as ‘2-SNPs’), which have minor allele frequencies of 1–2%. We find that these are enriched approxi-mately sevenfold (Table 5) among regions of IBD identified by the hidden Markov model approach. Notably, identification of IBD re-gions can be performed with the same genome-wide SNP data being
T
otal length (Mb)
Chromosome
1 2 3 4 5 6 7 8 9 10111213141516171819202122 X
0 10 20 30 40 50 60 70
b a
*
Physical position
Chr
omosome
NA19130 NA19192 (YRI) PIBD1 = 0.48
52 segments, 1,330.8 Mb
NA06994 NA12892 (CEU) PIBD1 = 0.06
12 segments, 152.1 Mb
NA12006 NA12155 (CEU) PIBD1 = 0.01
1 segment, 7.6 Mb
Figure 3|The extent of recent co-ancestry among HapMap individuals. a, Three pairs of individuals with varying levels of identity-by-descent (IBD) sharing illustrate the continuum between very close and very distant relatedness and its relation to segmental sharing. The three pairs are: high sharing (NA19130 and NA19192 from YRI; previously identified as second-degree relatives3), moderate sharing (NA06994 and NA12892 from CEU)
and low sharing (NA12006 and NA12155 from CEU). Along each chromosome, the probability of sharing at least one chromosome IBD is plotted, based on the HMM method described in Supplementary Text 5. Red sections indicate regions called as segments: in general, the proportion of the genome in segments is similar to each pair’s estimated global relatedness.
b, The extent of homozygosity on each chromosome for each individual in each analysis panel. Excludes segments,106 kb and chromosome X in males. Asterisk, NA12874, length5107 Mb. YRI, green; CEU, orange; CHB, blue; JPT, magenta.
Table 5|Relatedness, extended segmental sharing and homozygosity
Property YRI CEU CHB JPT
Number of pairs included 1,767 1,708 990 861
Mean identity by state (IBS) (%) 81.9 83.7 85.0 85.1
Mean identity by descent (IBD) (%) 0.04 0.34 0.36 0.42
Number of pairs with.1% IBD (%) 8.8 20.4 21.1 29.7
Number of pairs with one or more segment (%)
195
(11.0) 350
(20.5) 135
(13.6) 216
(25.1)
Total number of segments 250 427 146 273
Total distance spanned (Mb) 1,416 2,336 704 1,301
Mean segment length (Mb) 5.7 5.5 4.8 4.8
Maximum segment length (Mb) 51.7 56.2 15.0 25.3
Maximum segment length (Mb) (including close relatives)
141.4 128.5 N/A N/A
Total number of2-SNPs 6,219 9,220 8,174 8,750
Number of2-SNPs in segments 109 162 116 132
2-SNP fold increase 6.7 7.3 7.6 7.0
Number of homozygous segments (310
3 )*
0.9 2.2 2.6 2.6
SNPs in homozygous segments (3105) 1.6 4.2 5.3 5.4
Total length of homozygous segments (Mb)
160 410 510 520
2-SNP, SNPs where only two copies of the minor allele are present. * Homozygous segments.106 kb.
collected in large-scale association studies, making haplotype-sharing approaches an attractive and complementary analysis to standard SNP association tests, with the potential to identify rare variants associated with complex disease.
The distribution and causes of untaggable SNPs.Despite the SNP density of the Phase II HapMap, there are high-frequency SNPs for which no tag can be identified. Among high-frequency SNPs (MAF$0.2), we marked as untaggable SNPs to which no other SNP within 100 kb has anr2value of at least 0.2. In Phase II, approxi-mately 0.5–1.0% of all high-frequency SNPs are untaggable and the proportion in YRI is approximately twice as high as in the other panels. Similar proportions are observed across the ten HapMap ENCODE regions.
To identify factors influencing the location of untaggable SNPs we considered their distribution relative to segmental duplications, repeat sequence, CpG dinucleotide density, regions of low SNP den-sity, unusual allele frequency distribution, linkage disequilibrium patterns and recombination hotspots. We find no evidence for an enrichment of untaggable SNPs in segmental duplications or repeat sequence, as would be expected from mis-mapping of SNPs (2% and 35% of common SNPs lie in segmental duplications and repeat sequence, respectively, compared to 1.8% and 29%, respectively, of untaggable SNPs). Untaggable SNPs are slightly enriched in CpG islands (0.37% of common SNPs are in CpG islands compared to 1.4% of untaggable SNPs) and have slightly reduced MAF (Fig. 4). Most notably, untaggable SNPs are strongly enriched in regions of low linkage disequilibrium, particularly in recombination hotspots. To test whether these untaggable SNPs are themselves responsible for the identification of recombination hotspots, we eliminated them from 100 randomly chosen recombination hotspots and reassessed the evidence for a local peak in recombination. In all cases we still find evidence for a considerable increase in local recombination rate.
Over 50% of all untaggable SNPs lie within 1 kb of the centre of a detected recombination hotspot and over 90% are within 5 kb. Because only 3–4% of all SNPs lie within 1 kb from the centre of a detected recombination hotspot (16% are within 5 kb), this consti-tutes a marked enrichment and implies that at least 10% of all SNPs
within 1 kb of hotspots are untaggable. The implication for asso-ciation mapping is that when a region of interest contains a known hotspot it may be prudent to perform additional sequencing within the hotspot. Many of the variants identified in this manner will be untaggable SNPs that should be genotyped directly in association studies. From a biological perspective, the proximity of untaggable SNPs to the centre of hotspots suggests that they may lie within gene conversion tracts associated with the repair of double-strand breaks. Double-strand breaks are thought to resolve as crossover events only 5–25% of the time35. Consequently, SNPs lying near the centre of a hotspot are liable to be included within gene conversion tracts and will experience much higher effective recombination rates than pre-dicted from crossover rates alone.
The distribution of recombination
In the Phase II HapMap we identified 32,996 recombination hot-spots3,6,36 (an increase of over 50% from Phase I) of which 68% localized to a region of#5 kb. The median map distance induced by a hotspot is 0.043 cM (or one crossover per 2,300 meioses) and the hottest identified, on chromosome 20, is 1.2 cM (one crossover per 80 meioses). Hotspots account for approximately 60% of re-combination in the human genome and about 6% of sequence (Supplementary Fig. 6). We do not find marked differences among chromosomes in the concentration of recombination in hotspots, which implies that obligate differences in recombination among chromosomes of different size result from differences in hotspot density and intensity6.
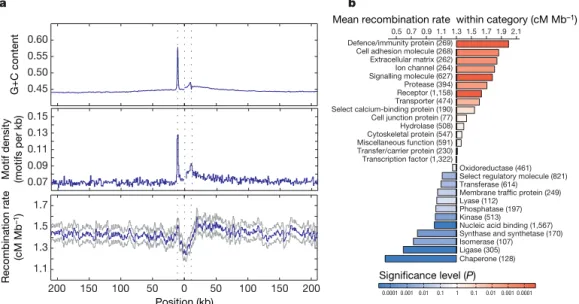
The increased number of well-defined hotspots allows us to under-stand better the influence of genomic features on the distribution of recombination. Previous work identified specific DNA motifs that influence hotspot location6,37as well as additional influences of local sequence context including the location of genes6and base composi-tion38. The Phase II HapMap provides the resolution to separate these influences. Figure 5a shows the distribution of recombination, hot-spot motifs and base composition around genes. Within the tran-scribed region of genes there is a marked decrease in the estimated recombination rate. However, 59of the transcription start site is a peak in recombination rate with a corresponding local increase in the density of hotspot motifs. This region also shows a marked increase in G1C content, reflecting the presence of CpG islands in promoter regions. There is also an asymmetry in recombination rate across genes, with recombination rates 39of transcribed regions being ele-vated (as are motif density and G1C content) compared to regions 59 of genes. Studies in yeast have previously suggested an association between promoter regions and recombination hotspots39. Our results suggest a significant, although weak, relationship between promoters and recombination in humans. Nevertheless, the vast majority of hotspots in the human genome are not in gene promoters. The asso-ciation may reflect a general assoasso-ciation between regions of accessible chromatin and crossover activity.
Systematic differences in recombination rate by gene class.
Previous work has demonstrated differences in the magnitude of linkage disequilibrium, as measured at a megabase scale, among genes associated with different functions3,40. Using the fine-scale gen-etic map estimated from the Phase II HapMap data we can quantify local increases in recombination rate associated with genes of differ-ent function using the Panther gene ontology annotation41. Average recombination rates vary more than sixfold among such gene classes (Fig. 5b), with defence and immunity genes showing the high-est rates (1.9 cM Mb21) and chaperones showing the lowest rates (0.3 cM Mb21). Gene functions associated with cell surfaces and external functions tend to show higher recombination rates (immun-ity, cell adhesion, extracellular matrix, ion channels, signalling) whereas those with lower recombination rates are typically internal to cells (chaperones, ligase, isomerase, synthase). Controlling for sys-tematic differences between gene classes in base composition and gene clustering, the differences between groups remain significant. Position (kb)
SNPs per kb
0.20
0.30
0.20
0.10
0 1.4
0.8
0.6
0.4
0.2
0 1.3
1.2
1.1
1.0
0.10
0
30
20
10
0
MAF
Max.
r
2
Hotspots per kb
cM Mb
–1
0–1
10–100
5–10
1–5
0–1
10–100
5–10 1–5
Position (kb)
0–1
10–100
5–10
1–5
0–1
10–100
5–10 1–5
Position (kb)
0–1
10–100
5–10
1–5
0–1
10–100
5–10 1–5
Position (kb)
0–1
10–100
5–10
1–5
0–1
10–100
5–10 1–5
Position (kb)
0–1
10–100
5–10
1–5
0–1
10–100
5–10 1–5
a b c
e d
SNP density Allele frequency Linkage disequilibrium
Recombination rate Hotspots
Figure 4|Properties of untaggable SNPs. a–e, Properties of the genomic regions surrounding untaggable SNPs in terms of:a, the density of polymorphic SNPs within the consensus data set;b, mean minor allele frequency of polymorphic SNPs;c, maximumr2of SNPs to any others in the
We also find that the density of hotspot-associated DNA motifs varies systematically among gene classes and that variation in motif density explains over 50% of the variance in recombination rate among gene functions (Supplementary Fig. 7).
These results pose interesting evolutionary questions. Because recombination involves DNA damage through double-strand breaks, hotspots may be selected against in some highly conserved parts of the genome. In regions exposed to recurrent selection (for example, from changes in environment or pathogen pressure) it is plausible that recombination may be selected for. However, because the fine-scale structure of recombination seems to evolve rapidly42,43it will be important to learn whether patterns of recombination rate hetero-geneity among molecular functions are conserved between species.
Natural selection
The Phase I HapMap data have been used to identify genomic regions that show evidence for the influence of adaptive evolution3,9, prim-arily through extended haplotype structure indicative of recent posi-tive selection. Using two established approaches9,44, we identified approximately 200 regions with evidence of recent positive selection from the Phase II HapMap (Supplementary Table 9). These regions include many established cases of selection, such as the genesHBB andLCT, the HLA region, and an inversion on chromosome 17. Many other regions have been previously identified in HapMap Phase I includingLARGE, SYT1and SULT1C2(previously called SULT1C1). A detailed description of the findings from the Phase II HapMap is published elsewhere45.
The Phase II HapMap also provides new insights into the forces acting on SNPs in coding regions. Effort was made to genotype as many known or putative non-synonymous SNPs as possible. Of the 56,789 non-synonymous SNPs identified in dbSNP release 125, attempts were made to genotype 36,777, which resulted in 17,427 that are QC1in all three analysis panels and polymorphic. We selected only those SNPs for which ancestral allele information was available (approximately 90%). For comparison, we used patterns of variation at synonymous SNPs. As previously reported46,47, non-synonymous SNPs show an increase in frequency of rare variants and
a slight decrease of common variants compared to synonymous SNPs, compatible with widespread purifying selection against non-synonymous mutations (Fig. 6a). In contrast, we find no excess of high-frequency derived non-synonymous mutations, as might be expected if positive selection were widespread.
Natural selection also influences the extent to which allele frequen-cies differ between populations, not only through local selective pres-sures that drive alleles to different frequencies48,49, but also through local variation in the strength of purifying selection. We compared the distribution of population differentiation (as measured byFST, the proportion of total variation in allele frequency that is due to differ-ences between populations) at non-synonymous SNPs and synonym-ous SNPs matched for allele frequency (Fig. 6b). We find a systematic bias for non-synonymous SNPs to show stronger differentiation than synonymous SNPs. Among SNPs showing high levels of differenti-ation there is a strong tendency for the derived allele to be at higher frequency in non-YRI populations. Among SNPs with FST.0.5 between CEU and YRI, in 79% and 75% of non-synonymous and synonymous variants, respectively, the derived allele is more common in CEU. Although this difference between non-synonymous and synonymous SNPs is not significant, among the eight exonic SNPs with FST.0.95, all are non-synonymous. We see no such bias towards increased MAF in CEU at high-differentiation SNPs, indi-cating that SNP ascertainment is unlikely to explain the difference. Rather, this effect can largely be explained by more genetic drift in the non-African populations, as confirmed by simulations (data not shown). In addition, reduced selection against deleterious muta-tions and local adaptation within non-African populamuta-tions will both act to increase the frequency of derived variants in non-African populations.
To assess the evidence for widespread local adaptation influencing non-synonymous mutations we considered the distribution of integrated extended haplotype homozygosity (iEHH) statistics9,44 (Fig. 6c). We find no evidence for systematic differences between non-synonymous and synonymous SNPs, suggesting that local adaptation does not explain their higher differentiation. Although hitch-hiking effects will tend to obscure differences between selected
1.3
1.1 2.1 0.7 0.9
0.0001 0.001 0.01 0.1 1 0.1 0.01 0.001 0.0001
Significance level (P)
0.5 1.5 1.71.9
Mean recombination rate within category (cM Mb–1)
Defence/immunity protein (269) Cell adhesion molecule (268) Extracellular matrix (262) Ion channel (264) Signalling molecule (627) Protease (394) Receptor (1,158) Transporter (474) Select calcium-binding protein (190) Cell junction protein (77) Hydrolase (508) Cytoskeletal protein (547) Miscellaneous function (591) Transfer/carrier protein (230) Transcription factor (1,322)
Oxidoreductase (461) Select regulatory molecule (821) Transferase (614) Membrane traffic protein (249) Lyase (112)
Phosphatase (197) Kinase (513)
Nucleic acid binding (1,567) Synthase and synthetase (170) Isomerase (107) Ligase (305) Chaperone (128)
0.07 0.09 0.11 0.13 0.15
200 150 100 50 0 50 100 150 200
Position (kb)
0.45 0.50 0.55 0.60
G+C content
Motif density (motifs per kb)
Recombination rate
(cM Mb
–1)
1.3 1.5 1.7
1.1
a b
Figure 5|Recombination rates around genes. a, The recombination rate, density of recombination-hotspot-associated motifs (all motifs with up to 1 bp different from the consensus CCTCCCTNNCCAC) and G1C content around genes. The blue line indicates the mean. For the recombination rate, grey lines indicate the quartiles of the distribution. Values were calculated separately 59from the transcription start site (the first dotted line) and 39
from the transcription end site (third dotted line) and were joined at the median midpoint position of the transcription unit (central dotted line). Note the sharp drop in recombination rate within the transcription unit, the
local increase around the transcription start site and the broad decrease away from the 39end of genes. These patterns only partly reflect the distribution of G1C content and the hotspot-associated motif, suggesting that additional factors influence recombination rates around genes.b, Recombination rates within genes of different molecular function41. The chart shows the increase
or decrease for each category compared to the genome average.Pvalues were estimated by permutation of category; numbers of genes are shown in parentheses.
and neutral SNPs, these results are consistent with a scenario in which the higher differentiation of non-synonymous SNPs is primarily dri-ven by a reduction in the strength or efficacy of purifying selection in non-African populations.
Discussion and prospects
The International HapMap Project has been instrumental in making well-powered, large-scale, genome-wide association studies a reality. It is now clear that the HapMap can be a useful resource for the design and analysis of disease association studies in populations across the world50–53. Furthermore, the decreasing costs and increasing SNP density of standard genotyping panels mean that the focus of atten-tion in disease associaatten-tion studies is shifting from candidate gene approaches towards genome-wide analyses. Alongside developments in technology, new statistical methodologies aimed at improving aspects of analysis, such as genotype calling21,54, the identification of and correction for population stratification and relatedness55,56, and imputation of untyped variants21–23, are increasing the accuracy and reliability of genome-wide association studies.
Within this context, it is important to consider the future of the HapMap Project. Currently, additional samples from the popula-tions used to develop the initial HapMap, as well as samples from seven additional populations (Luhya in Webuye, Kenya; Maasai in Kinyawa, Kenya; Tuscans in Italy; Gujarati Indian in Houston, Texas, USA; Denver (Colorado) metropolitan Chinese community; people of Mexican origin in Los Angeles, California, USA; and people with African ancestry in the southwestern United States; http://ccr.coriell. org/Sections/Collections/NHGRI/?SsId511) will be sequenced and
genotyped extensively to extend the HapMap, providing information on rarer variants and helping to enable genome-wide association studies in additional populations. There are also ongoing efforts by many groups to characterize additional forms of genetic variation, such as structural variation, and molecular phenotypes in the HapMap samples. Finally, in the future, whole-genome sequencing will provide a natural convergence of technologies to type both SNP and structural variation. Nevertheless, until that point, and even after, the HapMap Project data will provide an invaluable resource for understanding the structure of human genetic variation and its link to phenotype.
METHODS SUMMARY
Of approximately 6.9 million SNPs in dbSNP release 122 approximately 4.7 million were selected for genotyping by Perlegen. 2.5 million SNPs were excluded because no assay could be designed and a further 350,000 were excluded for other reasons (see Methods). Perlegen performed genotyping using custom high-density oligonucleotide arrays as previously described15. Additional genotype
submissions are described in the text. QC filters were applied as previously described3. Where multiple submissions met the QC criteria the submission with
the lowest missing data rate was chosen for inclusion in the non-redundant filtered data set. Haplotypes were estimated from genotype data as described previously3. Ancestral states at SNPs were inferred by parsimony by comparison
to orthologous bases in the chimpanzee (panTro2) and rhesus macaque (rheMac2) assemblies. Recombination rates and the location of recombination hotspots were estimated as described previously3. Additional details can be
found in the Methods section and the Supplementary Information. The data described in this paper are in release 21 of the International HapMap Project.
Full Methodsand any associated references are available in the online version of the paper at www.nature.com/nature.
Received 12 April; accepted 18 September 2007.
1. The International HapMap Consortium. Integrating ethics and science in the International HapMap Project.Nature Rev. Genet.5,467–475 (2004). 2. The International HapMap Consortium. The International HapMap Project.
Nature426,789–796 (2003).
3. The International HapMap Consortium. A haplotype map of the human genome.
Nature437,1299–1320 (2005).
4. Bowcock, A. M. Genomics: guilt by association.Nature447,645–646 (2007). 5. Altshuler, D. & Daly, M. Guilt beyond a reasonable doubt.Nature Genet.39,
813–815 (2007).
6. Myers, S., Bottolo, L., Freeman, C., McVean, G. & Donnelly, P. A fine-scale map of recombination rates and hotspots across the human genome.Science310,
321–324 (2005).
7. McCarroll, S. A.et al.Common deletion polymorphisms in the human genome.
Nature Genet.38,86–92 (2006).
8. Conrad, D. F., Andrews, T. D., Carter, N. P., Hurles, M. E. & Pritchard, J. K. A high-resolution survey of deletion polymorphism in the human genome.Nature Genet.
38,75–81 (2006).
9. Voight, B. F., Kudaravalli, S., Wen, X. & Pritchard, J. K. A map of recent positive selection in the human genome.PLoS Biol.4,e72 (2006).
10. Redon, R.et al.Global variation in copy number in the human genome.Nature444,
444–454 (2006).
11. de Bakker, P. I.et al.A high-resolution HLA and SNP haplotype map for disease association studies in the extended human MHC.Nature Genet.38,1166–1172 (2006).
12. Pastinen, T.et al.Mapping common regulatory variants to human haplotypes.
Hum. Mol. Genet.14,3963–3971 (2005).
13. Stranger, B. E.et al.Genome-wide associations of gene expression variation in humans.PLoS Genet.1,e78 (2005).
14. Cheung, V. G.et al.Mapping determinants of human gene expression by regional and genome-wide association.Nature437,1365–1369 (2005).
15. Hinds, D. A.et al.Whole-genome patterns of common DNA variation in three human populations.Science307,1072–1079 (2005).
16. de Bakker, P. I.et al.Efficiency and power in genetic association studies.Nature
Genet.37,1217–1223 (2005).
17. Pe’er, I.et al.Evaluating and improving power in whole-genome association studies using fixed marker sets.Nature Genet.38,663–667 (2006). 18. Barrett, J. C. & Cardon, L. R. Evaluating coverage of genome-wide association
studies.Nature Genet.38,659–662 (2006).
19. Burdick, J. T., Chen, W. M., Abecasis, G. R. & Cheung, V. G.In silico
method for inferring genotypes in pedigrees.Nature Genet.38,1002–1004 (2006).
20. Servin, B. R. & Stephens, M. Imputation-based analysis of association studies: candidate regions and quantitative traits.PLoS Genet.3,e114 (2007).
a
b c
CEU CHB+JPT
DAF YRI
DAF 0
0.10 0.20
0 0.10 0.20
0.08
1.0
0.8
0.6
0.4
0.2
0 0.04
0
0 0.10 0.20
Pr
oportion
0 0.2 0.4 0.60.81.0
0 0.2 0.4 0.6 0.81.0 0 0.2 0.4 0.60.81.0 0 0.2 0.4 0.60.81.0
DAF 0 0.2 0.4 0.60.81.0
Average DAF across panels
Pr
oportion of SNPs with FST
> 0.5
DAF
Pr
oportion of top 5% iEHH non-synonymous SNPs
* **
**
*
Figure 6|Properties of non-synonymous and synonymous SNPs. a, The derived allele frequency (DAF) spectrum in each analysis panel for all SNPs (black), synonymous SNPs (green) and non-synonymous SNPs (red). Note the excess of rare variants for coding sequence SNPs but no excess of high-frequency derived variants.b, Enrichment of non-synonymous SNPs among genic SNPs showing high differentiation. For each of ten classes of derived allele frequency (averaged across analysis panels) the fraction of non-synonymous (red) and non-synonymous (green) variants in that class that show
FST.0.5 is shown. Note the strong enrichment of non-synonymous SNPs
among SNPs of moderate to high derived-allele frequency (asterisk,
P,0.05; double asterisk,P,0.01).c, Lack of enrichment of non-synonymous SNPs among those showing long-range haplotype structure. The integrated extended haplotype homozygosity (iEHH) statistic9was
21. The Wellcome Trust Case Control Consortium. Genome-wide association study of 14,000 cases of seven common diseases and 3,000 shared controls.Nature
447,661–668 (2007).
22. Scott, L. J.et al.A genome-wide association study of type 2 diabetes in Finns detects multiple susceptibility variants.Science316,1341–1345 (2007). 23. Marchini, J., Howie, B., Myers, S., McVean, G. & Donnelly, P. A new multipoint
method for genome-wide association studies via imputation of genotypes.Nature
Genet.39,906–913 (2007).
24. Chapman, J. M., Cooper, J. D., Todd, J. A. & Clayton, D. G. Detecting disease associations due to linkage disequilibrium using haplotype tags: a class of tests and the determinants of statistical power.Hum. Hered.56,18–31 (2003). 25. Paabo, S. The mosaic that is our genome.Nature421,409–412 (2003). 26. McVean, G., Spencer, C. C. & Chaix, R. Perspectives on human genetic variation
from the HapMap Project.PLoS Genet.1,e54 (2005).
27. Purcell, S.et al.PLINK: a toolset for whole-genome association and population-based linkage analysis.Am. J. Hum. Genet.81,559–575 (2007).
28. Broman, K. W. & Weber, J. L. Long homozygous chromosomal segments in reference families from the centre d’Etude du polymorphisme humain.Am. J.
Hum. Genet.65,1493–1500 (1999).
29. Gibson, J., Morton, N. E. & Collins, A. Extended tracts of homozygosity in outbred human populations.Hum. Mol. Genet.15,789–795 (2006).
30. Lander, E. S. & Botstein, D. Homozygosity mapping: a way to map human recessive traits with the DNA of inbred children.Science236,1567–1570 (1987). 31. Leutenegger, A. L.et al.Using genomic inbreeding coefficient estimates for
homozygosity mapping of rare recessive traits: application to Taybi-Linder syndrome.Am. J. Hum. Genet.79,62–66 (2006).
32. Te Meerman, G. J., Van der Meulen, M. A. & Sandkuijl, L. A. Perspectives of identity by descent (IBD) mapping in founder populations.Clin. Exp. Allergy25
(Suppl 2), 97–102 (1995).
33. Houwen, R. H.et al.Genome screening by searching for shared segments: mapping a gene for benign recurrent intrahepatic cholestasis.Nature Genet.8,
380–386 (1994).
34. Durham, L. K. & Feingold, E. Genome scanning for segments shared identical by descent among distant relatives in isolated populations.Am. J. Hum. Genet.61,
830–842 (1997).
35. Jeffreys, A. J. & May, C. A. Intense and highly localized gene conversion activity in human meiotic crossover hot spots.Nature Genet.36,151–156 (2004). 36. McVean, G. A.et al.The fine-scale structure of recombination rate variation in the
human genome.Science304,581–584 (2004).
37. Myers, S.et al.The distribution and causes of meiotic recombination in the human genome.Biochem. Soc. Trans.34,526–530 (2006).
38. Spencer, C. C.et al.The influence of recombination on human genetic diversity.
PLoS Genet.2,e148 (2006).
39. Petes, T. D. Meiotic recombination hot spots and cold spots.Nature Rev. Genet.2,
360–369 (2001).
40. Smith, A. V., Thomas, D. J., Munro, H. M. & Abecasis, G. R. Sequence features in regions of weak and strong linkage disequilibrium.Genome Res.15,1519–1534 (2005).
41. Thomas, P. D.et al.PANTHER: a library of protein families and subfamilies indexed by function.Genome Res.13,2129–2141 (2003).
42. Winckler, W.et al.Comparison of fine-scale recombination rates in humans and chimpanzees.Science308,107–111 (2005).
43. Ptak, S. E.et al.Fine-scale recombination patterns differ between chimpanzees and humans.Nature Genet.37,429–434 (2005).
44. Sabeti, P. C.et al.Detecting recent positive selection in the human genome from haplotype structure.Nature419,832–837 (2002).
45. Sabeti, P. C.et al.Genome-wide detection and characterization of positive selection in human populations.Naturedoi:10.1038/nature06250 (this issue). 46. Bustamante, C. D.et al.Natural selection on protein-coding genes in the human
genome.Nature437,1153–1157 (2005).
47. Cargill, M.et al.Characterization of single-nucleotide polymorphisms in coding regions of human genes.Nature Genet.22,231–238 (1999).
48. Akey, J. M., Zhang, G., Zhang, K., Jin, L. & Shriver, M. D. Interrogating a high-density SNP map for signatures of natural selection.Genome Res.12,1805–1814 (2002).
49. Sabeti, P. C.et al.Positive natural selection in the human lineage.Science312,
1614–1620 (2006).
50. de Bakker, P. I.et al.Transferability of tag SNPs in genetic association studies in multiple populations.Nature Genet.38,1298–1303 (2006).
51. Conrad, D. F.et al.A worldwide survey of haplotype variation and linkage disequilibrium in the human genome.Nature Genet.38,1251–1260 (2006). 52. Service, S., Sabatti, C. & Freimer, N. Tag SNPs chosen from HapMap perform well
in several population isolates.Genet. Epidemiol.31,189–194 (2007). 53. Lim, J.et al.Comparative study of the linkage disequilibrium of an ENCODE
region, chromosome 7p15, in Korean, Japanese, and Han Chinese samples.
Genomics87,392–398 (2006).
54. Rabbee, N. & Speed, T. P. A genotype calling algorithm for affymetrix SNP arrays.
Bioinformatics22,7–12 (2006).
55. Purcell, S.et al.PLINK: a tool set for whole-genome association and population-based linkage analyses.Am. J. Hum. Genet.81,559–575 (2007).
56. Price, A. L.et al.Principal components analysis corrects for stratification in genome-wide association studies.Nature Genet.38,904–909 (2006).
57. Smith, R. A., Ho, P. J., Clegg, J. B., Kidd, J. R. & Thein, S. L. Recombination breakpoints in the humanb-globin gene cluster.Blood92,4415–4421 (1998).
58. Holloway, K., Lawson, V. E. & Jeffreys, A. J. Allelic recombination andde novo
deletions in sperm in the humanb-globin gene region.Hum. Mol. Genet.15,
1099–1111 (2006).
59. Weir, B. S. & Cockerham, C. C. Estimating F-statistics for the analysis of population structure.Evolution38,1358–1370 (1984).
Supplementary Informationis linked to the online version of the paper at www.nature.com/nature.
AcknowledgementsWe thank many people who contributed to this project: all members of the genotyping laboratory and the sample, primer, bioinformatics, data quality and IT groups at Perlegen Sciences for technical and infrastructural support; J. Beck, C. Beiswanger, D. Coppock, A. Leach, J. Mintzer and L. Toji for transforming the Yoruba, Japanese and Han Chinese samples, distributing the DNA and cell lines, storing the samples for use in future research, and producing the community newsletters and reports; J. Greenberg and R. Anderson for providing funding and support for cell line transformation and storage in the NIGMS Human Genetic Cell Repository at the Coriell Institute; T. Dibling, T. Ishikura, S. Kanazawa, S. Mizusawa and S. Saito for help with genotyping; C. Hind and A. Moghadam for technical support in genotyping and all members of the subcloning and sequencing teams at the Wellcome Trust Sanger Institute; X. Ke for help with data analysis; Oxford E-Science Centre for provision of high-performance computing resources; H. Chen, W. Chen, L. Deng, Y. Dong, C. Fu, L. Gao, H. Geng, J. Geng, M. He, H. Li, H. Li, S. Li, X. Li, B. Liu, Z. Liu, F. Lu, F. Lu, G. Lu, C. Luo, X. Wang, Z. Wang, C. Ye and X. Yu for help with genotyping and sample collection; X. Feng, Y. Li, J. Ren and X. Zhou for help with sample collection; J. Fan, W. Gu, W. Guan, S. Hu, H. Jiang, R. Lei, Y. Lin, Z. Niu, B. Wang, L. Yang, W. Yang, Y. Wang, Z. Wang, S. Xu, W. Yan, H. Yang, W. Yuan, C. Zhang, J. Zhang, K. Zhang and G. Zhao for help with genotyping; P. Fong, C. Lai, C. Lau, T. Leung, L. Luk and W. Tong for help with genotyping; C. Pang for help with genotyping; K. Ding, B. Qiang, J. Zhang, X. Zhang and K. Zhou for help with genotyping; Q. Fu, S. Ghose, X. Lu, D. Nelson, A. Perez, S. Poole, R. Vega and H. Yonath for help with genotyping; C. Bruckner, T. Brundage, S. Chow, O. Iartchouk, M. Jain, M. Moorhead and K. Tran for help with genotyping; N. Addleman, J. Atilano, T. Chan, C. Chu, C. Ha, T. Nguyen, M. Minton and A. Phong for help with genotyping, and D. Lind for help with quality control and experimental design; R. Donaldson and S. Duan for help with genotyping, and J. Rice and N. Saccone for help with experimental design; J. Wigginton for help with implementing and testing QA/QC software; A. Clark, B. Keats, R. Myers, D. Nickerson and A. Williamson for providing advice to NIH; C. Juenger, C. Bennet, C. Bird, J. Melone, P. Nailer, M. Weiss, J. Witonsky and E. DeHaut-Combs for help with project management; M. Gray for organizing phone calls and meetings; D. Leja for help with figures; the Yoruba people of Ibadan, Nigeria, the people of Tokyo, Japan, and the community at Beijing Normal University, who participated in public consultations and community engagements; the people in these communities who donated their blood samples; and the people in the Utah CEPH community who allowed the samples they donated earlier to be used for the Project. This work was supported by the Japanese Ministry of Education, Culture, Sports, Science and Technology, the Wellcome Trust, Nuffield Trust, Wolfson Foundation, UK EPSRC, Genome Canada, Ge´nome Que´bec, the Chinese Academy of Sciences, the Ministry of Science and Technology of the People’s Republic of China, the National Natural Science Foundation of China, the Hong Kong Innovation and Technology Commission, the University Grants Committee of Hong Kong, the SNP Consortium, the US National Institutes of Health (FIC, NCI, NCRR, NEI, NHGRI, NIA, NIAAA, NIAID, NIAMS, NIBIB, NIDA, NIDCD, NIDCR, NIDDK, NIEHS, NIGMS, NIMH, NINDS, NLM, OD), the W.M. Keck Foundation, and the Delores Dore Eccles Foundation. All SNPs genotyped within the HapMap Project are available from dbSNP (http://www.ncbi.nlm.nih.gov/SNP); all genotype information is available from dbSNP and the HapMap website (http://www.hapmap.org).
Author InformationReprints and permissions information is available at www.nature.com/reprints. The authors declare competing financial interests: details accompany the full-text HTML version of the paper at www.nature.com/ nature. Correspondence and requests for materials should be addressed to G.M. ([email protected]) or M.D. ([email protected]).
The International HapMap Consortium(Participants are arranged by institution and then alphabetically within institutions except for Principal Investigators and Project Leaders, as indicated.)
Genotyping centres: Perlegen SciencesKelly A. Frazer (Principal Investigator)1 , Dennis G. Ballinger2
, David R. Cox2
, David A. Hinds2
, Laura L. Stuve2
;Baylor College of Medicine and ParAllele BioScienceRichard A. Gibbs (Principal Investigator)3, John W. Belmont3
, Andrew Boudreau4
, Paul Hardenbol5
, Suzanne M. Leal3
, Shiran Pasternak6 , David A. Wheeler3
, Thomas D. Willis4 , Fuli Yu7
;Beijing Genomics InstituteHuanming Yang (Principal Investigator)8
, Changqing Zeng (Principal Investigator)8
, Yang Gao8 , Haoran Hu8, Weitao Hu8, Chaohua Li8, Wei Lin8, Siqi Liu8, Hao Pan8, Xiaoli Tang8, Jian Wang8
, Wei Wang8 , Jun Yu8
, Bo Zhang8
, Qingrun Zhang8
, Hongbin Zhao8 , Hui Zhao8
, Jun Zhou8