GEP Testing, Spring 2013
Contents
Overview ... 2
Summary of results & models page ... 3
Demographics ... 4
Proficiency levels ... 6
Appendix I: List of Institutions of comparison that have administered ETS PP………..10
Appendix II: Comparison of NCSU ETS PP test takers with other ETS PP test takers ……….. 14
Appendix III: Description of proportional weighting……….15
GEP Testing, Spring 2013
OVERVIEW
Assessment of general education proficiency took place in Spring 2013 semester at North Carolina State University. The
assessment, the ETS Proficiency Profile (ETS PP), was given to both first year freshmen and graduating seniors. The freshman
and seniors cohorts were selected for comparison in order to begin to understand the extent to which students have attained
general education competencies.
Methods:
ETS Proficiency Profile (36 questions, multiple choice, 40 minutes)
Supplemental questions added to measure effort/motivation. Used Student Opinion Survey (Sundre & Moore, 2002)
On campus, multiple dates/times. Administered by Office of Assessment staff
First year freshmen tested January 2013 (recruited through HES courses as a course requirement)
Graduating seniors assessed April 2013 (recruited through email, multiple venues; voluntary participation with incentives)
Exploratory Analysis:
Compared mean scores of NC State students to the mean scores provided by ETS of other institutions who have given
the ETS PP to similar student populations (see Appendix II).
Our samples were not, on their own, representative of population. As such, we created proportional weights post hoc to
accommodate for this (see Appendix III).
A matching process was used to identify similar freshman and seniors on the basis of race, gender, college, SAT verbal
and SAT math (e.g. a White, freshman male in Engineering with a 650 verbal SAT and 700 math SAT would be matched
with a White senior male in Engineering with a similar SAT score).
1
Compared the difference in mean scores between the
matched
freshmen and seniors.
GLM regression models were run for freshmen overall, freshmen scaled scores, senior overall, senior scaled scores, and
seniors and freshmen overall score combined.
Future Plans
Increase sample size for sufficient break down by college
Use truly longitudinal data when possible (2016 graduating seniors)
Add variable “years” (since matriculating/since completed GEP coursework) to attempt to account for AP credits, etc., in
senior group.
Key Findings:
The overall score difference between
freshman and seniors (weighted)
was
9
points,
unweighted 7
points.
Both
freshmen
and
seniors
have a majority not proficient in
critical thinking
The overall score difference between
freshman and seniors using matched
pairs was
10.8
(95% confidence interval,
6.6 to 15.0)
SAT and effort
were the predictors common to all three models.
GPA
was a significant predictor for freshman and the
combined model.
Gender
was only significant in the senior model (males performed better than females), but not in the combined model
Transfer student mean score was 456
compared to
non-transfer mean score 462
(weighted 464). However,
significant variation in transfer student population and small N should be considered.
1
It should be noted that in the models and matched pairs, there was often missing student demographic data from the year
2009 (the year that the SIS transition occurred).
SUMMARY OF RESULTS
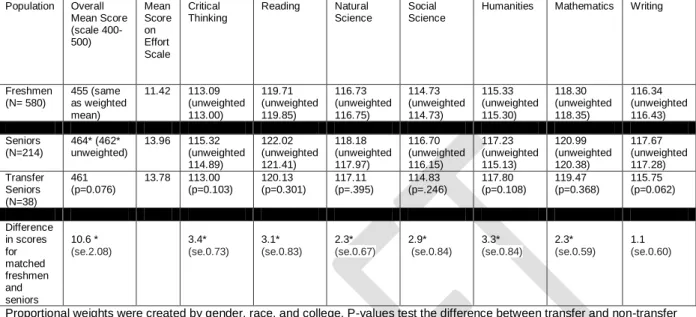
Figure 1: Mean Scores and Difference in matched pairs
Population OverallMean Score (scale 400-500) Mean Score on Effort Scale Critical Thinking
Reading Natural Science
Social Science
Humanities Mathematics Writing
Freshmen (N= 580)
455 (same as weighted mean)
11.42 113.09 (unweighted 113.00) 119.71 (unweighted 119.85) 116.73 (unweighted 116.75) 114.73 (unweighted 114.73) 115.33 (unweighted 115.30) 118.30 (unweighted 118.35) 116.34 (unweighted 116.43) Seniors (N=214) 464* (462* unweighted)
13.96 115.32 (unweighted 114.89) 122.02 (unweighted 121.41) 118.18 (unweighted 117.97) 116.70 (unweighted 116.15) 117.23 (unweighted 115.13) 120.99 (unweighted 120.38) 117.67 (unweighted 117.28) Transfer Seniors (N=38) 461 (p=0.076)
13.78 113.00 (p=0.103) 120.13 (p=0.301) 117.11 (p=.395) 114.83 (p=.246) 117.80 (p=0.108) 119.47 (p=0.368) 115.75 (p=0.062) Difference in scores for matched freshmen and seniors 10.6 * (se.2.08) 3.4* (se.0.73) 3.1* (se.0.83) 2.3* (se.0.67) 2.9* (se.0.84) 3.3* (se.0.84) 2.3* (se.0.59) 1.1 (se.0.60)
Proportional weights were created by gender, race, and college. P-values test the difference between transfer and non-transfer
seniors.
*Indicates significant difference
SUMMARY OF MODELS
Due to missing data, these models do not include transfers. Missing data (generally SAT scores) also resulted in fewer
students included in some of the models.
Freshmen: Overall (
N=547)
For freshmen, the predictors selected in a stepwise procedure for
overall
ETS PP score were
GPA, SAT
, and
effort.
Higher GPA
SAT and greater self-reported effort on the ETS PP predicted higher overall scores. Gender, race, and college were not significant
predictors. See page 6 of the full report for the full model and discussion.
Seniors: Overall (
N=186)
For seniors, the predictors selected in a stepwise procedure for
overall
ETS PP score were
gender, SAT
and
effort
. Males
performed better than females and higher SAT scores and self-reported effort predicted higher scores on the ETS PP. Race,
college and GPA were not significant predictors. See page 10 for the full model and discussion.
Combined Model: Overall (N=733)
Seniors performed better than freshmen. When combining freshman and senior data for analysis, we found that, controlling for all
other factors, being a senior predicted a performance on the ETS PP of 5 points higher than freshman (5% improvement- 100 point
scale). Other significant predictors in the combined model selected by a stepwise process were
SAT, GPA
and
effort.
Matched pairs: Overall (N=106)
When seniors and freshman were matched by characteristics such as gender, race, college, and SAT score, the difference in score
from freshman to senior year was 10.8 points.
Demographics
Race
Freshman
Senior
Sample
Population
Sample
Population
N
%
N
%
Non-Transfer
Transfer
Senior Total
Non-Transfer
Transfer
Senior Total
N
%
N
%
N
%
N
%
N
%
N
%
NRA
12
2.1%
113
2.7%
6
2.8%
1
2.8%
7
2.8%
45
1.7%
21
3.8%
66
2.0%
Unknown
8
1.4%
69
1.7%
7
3.3%
1
2.8%
8
3.2%
99
3.7%
26
4.8%
125
3.9%
Hispanic
29
5.0%
186
4.5%
7
3.3%
4
11.1%
11
4.4%
89
3.3%
29
5.3%
118
3.7%
American Indian
or Alaska Native
1
0.2%
19
0.5%
0
0.0%
0
0.0%
0
0.0%
14
0.5%
1
0.2%
15
0.5%
Asian
27
4.7%
216
5.2%
10
4.7%
1
2.8%
11
4.4%
134
5.0%
28
5.1%
162
5.0%
Black or African
American
34
5.9%
311
7.5%
23
10.8%
0
0.0%
23
9.3%
209
7.8%
20
3.7%
229
7.1%
Native Hawiian
or Other Pacific
Islander
0
0.0%
4
0.1%
0
0.0%
0
0.0%
0
0.0%
0
0.0%
0
0.0%
0
0.0%
White
451
77.8%
3069
74.1%
155
73.1%
27
75.0%
182
73.4%
2041
76.3%
409
74.9%
2450
76.1%
Two or More
18
3.1%
153
3.7%
4
1.9%
2
5.6%
6
2.4%
43
1.6%
12
2.2%
55
1.7%
Total
580
4140
212
36
248
2674
546
3220
Gender
Freshman
Senior
Sample
Population
Sample
Population
N
%
N
%
Non-Transfer
Transfer
All
Non-Transfer
Transfer
All
N
%
N
%
N
%
N
%
N
%
N
%
Female
305 52.6% 1910 46.1% 120 56.6% 21 58.3% 141 56.9% 1274 47.6% 262 48.0% 1536 47.7%
Male
275 47.4% 2230 53.9%
92 43.4% 15 41.7% 107 43.1% 1400 52.4% 284 52.0% 1684 52.3%
College
Freshman
Senior
Sample
Population
Sample
Population
N
%
N
%
Non-Transfer
Transfer
All
Non-Transfer
Transfer
All
N
%
N
%
N
%
N
%
N
%
N
%
CALS
108 18.6%
638 15.4%
48 22.6%
6 16.7%
54 21.8%
577 21.6% 108 19.8%
685 21.3%
Design
27
4.7%
105
2.5%
4
1.9%
0
0.0%
4
1.6%
113
4.2%
14
2.6%
127
3.9%
Education
31
5.3%
116
2.8%
28 13.2%
3
8.3%
31 12.5%
139
5.2%
18
3.3%
157
4.9%
Engineering
214 36.9% 1325 32.0%
43 20.3% 10 27.8%
53 21.4%
619 23.1%
90 16.5%
709 22.0%
CNR
24
4.1%
117
2.8%
7
3.3%
2
5.6%
9
3.6%
127
4.7%
40
7.3%
167
5.2%
CHASS
38
6.6%
359
8.7%
37 17.5%
7 19.4%
44 17.7%
506 18.9% 166 30.4%
672 20.9%
PAMS
30
5.2%
215
5.2%
12
5.7%
2
5.6%
14
5.6%
100
3.7%
16
2.9%
116
3.6%
Textiles
20
3.4%
165
4.0%
8
3.8%
2
5.6%
10
4.0%
123
4.6%
11
2.0%
134
4.2%
Management
28
4.8%
342
8.3%
25 11.8%
4 11.1%
29 11.7%
364 13.6%
81 14.8%
445 13.8%
FYC
60 10.3%
758 18.3%
6
0.2%
2
0.4%
8
0.2%
Total
580
4140
212
36
248
2674
546
3220
Sample
Freshman
Sample Senior
Population
Freshman
Population Seniors
GPA and SAT*
Non-Transfer
Transfer
Senior
Mean
Non-transfer
Transfer Senior
Means
SAT
1217.93
1194
1111
1182
1217.61
1189.51
1115
1184
GPA
3.34*
3.30
3.48
3.33*
3.19*
3.23
3.23
3.23*
Proficiency Levels
Freshmen
READING
Proficiency
Classifications -
Reading Level 1
Frequency
Percent
Proficiency
Classifications -
Reading Level 2
Frequency
Percent
Proficiency
Classifications -
Critical
Thinking Level
3*
Frequency
Percent
Subscale
Score
Percentile
(ETS
Comparison
group,
N= 37)
Marginally
Proficient
84
14.5%
Marginally
Proficient
159
27.4%
Marginally
Proficient
135
23.3%
Reading
78
thpercentile;
Critical
thinking
76
stpercentile
Not Proficient
53
9.1%
Not Proficient
183
31.6%
Not Proficient
423
72.9%
Proficient
443
76.4%
Proficient
238
41.0%
Proficient
22
3.8%
Grand Total
580
Grand Total
580
Grand Total
580
Writing
Proficiency
Classifications -
Writing Level 1
Frequency
Percent
Proficiency
Classifications -
Writing Level 2
Frequency
Percent
Proficiency
Classifications -
Writing Level
3*
Frequency
Percent
Subscale
Score
Percentile
(ETS
Comparison
group,
N= 37)
Marginally
Proficient
115
19.8%
Marginally
Proficient
258
44.5%
Marginally
Proficient
184
31.7%
Writing
86
thpercentile
Not Proficient
21
3.6%
Not Proficient
156
26.9%
Not Proficient
313
54.0%
Proficient
444
76.6%
Proficient
166
28.6%
Proficient
83
14.3%
Mathematics
Proficiency
Classifications -
Mathematics
Level 1
Frequency
Percent
Proficiency
Classifications -
Mathematics
Level 2
Frequency
Percent
Proficiency
Classifications -
Mathematics
Level 3*
Frequency
Percent
Subscale
Score
Percentile
(ETS
Comparison
group,
N= 37)
Marginally
Proficient
48
8.3%
Marginally
Proficient
158
27.2%
Marginally
Proficient
198
34.1%
Math
89
thpercentile
Not Proficient
17
2.9%
Not Proficient
71
12.2%
Not Proficient
302
52.1%
Proficient
515
88.8%
Proficient
351
60.5%
Proficient
80
13.8%
Grand Total
580
Grand Total
580
Grand Total
580
Humanities, Social Science, Natural Science**
Subscale Area
Subscale Score Percentile (ETS Comparison group, N= 37)
Humanities
62
thpercentile
Social Science
65
thpercentile
SENIORS
READING
Proficiency
Classifications -
Reading Level 1
Frequency
Percent
Proficiency
Classifications -
Reading Level 2
Frequency
Percent
Proficiency
Classifications -
Critical
Thinking Level
3*
Frequency
Percent
Subscale
Score
Percentile
(ETS
Comparison
group,
N= 57)
Marginally
Proficient
25
10.0
Marginally
Proficient
58
23.2
Marginally
Proficient
74
29.6
Reading
75
thpercentile;
Critical
thinking
63
rdpercentile
Not Proficient
23
9.2
Not Proficient
61
24.4
Not Proficient
147
58.8
Proficient
202
80.8
Proficient
131
52.4
Proficient
29
11.6
Total
250
100.0
Total
250
100.0
Total
250
100.0
WRITING
Proficiency
Classifications -
Writing Level 1
Frequency
Percent
Proficiency
Classifications -
Writing Level 2
Frequency
Percent
Proficiency
Classifications -
Writing Level
3*
Frequency
Percent
Subscale
Score
Percentile
(ETS
Comparison
group,
N= 57)
Marginally
Proficient
46
18.4
Marginally
Proficient
99
39.6
Marginally
Proficient
72
28.8
Writing 89
thpercentile
Not Proficient
4
1.6
Not Proficient
64
25.6
Not Proficient
125
50.0
Proficient
200
80.0
Proficient
87
34.8
Proficient
53
21.2
Total
250
100.0
Total
250
100.0
Total
250
100.0
MATHEMATICS
Proficiency
Classifications -
Mathematics
Level 1
Frequency
Percent
Proficiency
Classifications -
Mathematics
Level 2
Frequency
Percent
Proficiency
Classifications -
Mathematics
Level 3
Frequency
Percent
Subscale
Score
Percentile
(ETS
Comparison
group,
N= 57)
Proficient
Proficient
Proficient
95
thpercentile
Not Proficient
9
3.6
Not Proficient
28
11.2
Not Proficient
93
37.2
Proficient
224
89.6
Proficient
183
73.2
Proficient
78
31.2
Total
250
100.0
Total
250
100.0
Total
250
100.0
Humanities, Social Science, Natural Science**
Subscale Area
Subscale Score Percentile (ETS Comparison group, N= 37)
Humanities
58
thpercentile
Social Science
70
thpercentile
Natural Science
54
thpercentile
*Competency at which a majority of our students are not at least marginally proficient
** Proficiency levels are not provided by ETS. They note that,
“
Materials included in the ETS Proficiency Profile—reading sections, graphs, tables, and artistic designs—are concerned with issues, themes and ideas from the humanities, social sciences and natural sciences. The questions related to these materials—for example, the questions that follow a reading section—measure a students’ ability to read carefully, to make judgments about the clarity, correctness, or organization of the materials as pieces of writing, and to think critically about the issues and arguments presented. Mathematical data are presented largely although not exclusively in a mathematical form independent of academic content.
The questions do not explicitly ask for recall of information learned in specific courses in the humanities, social sciences or natural sciences, they assume however that a student who has taken general education courses in these areas will be better able to read the materials and answer the accompanying questions than a student who has not taken such courses.”
In essence, Reading, Writing, Critical Thinking and Mathematics are the content measured on the ETS PP and many of the questions that seek to measure these skills are framed as
Appendix I: List of Institutions of comparison that have administered ETS PP
Freshmen RI/RII/doctoral <30
hours
(N= 37)
Freshmen ALL institutions <30 hours
(N=273)
Arizona State University - Tempe Clark Atlanta University Clemson University
Colorado State University- Global Campus
Florida Agricultural and Mechanical University
Florida International University Indiana State University Indiana University - System Office Long Island University - CW Post Mississippi State University Missouri University of Science and Technology
Morgan State University Northern Arizona University Oklahoma State University Saint Philips College Sam Houston State University Spalding University
Texas A&M University - San Antonio Texas A&M University-Commerce Thomas Edison State College University of Akron, The
University of Alabama at Birmingham University of Alaska Fairbanks University of Cincinnati University of Colorado - Denver University of Delaware University of Illinois University of Mississippi University of Missouri - Columbia University of North Carolina at Greensboro
University of North Texas - Dallas University of South Carolina - Columbia University of Southern Mississippi University of Tennessee - Knoxville University of Tulsa
Walden University Wayne State University
Adventist University of Health Sciences Aiken Technical College
Alabama A&M University Alabama State University Albertus Magnus College Alcorn State University Alice Lloyd College
American Intercontinental University American Public University American Sentinel University Anderson University - South Carolina Antioch University McGregor Arizona State University - Tempe Art Institute of Austin
Art Institute of Charlotte, The Art Institute of Dallas Art Institute of Houston Art Institute of Raleigh-Durham Asbury University
Ashford University Athens State University Atlantic Cape Community College Ave Maria University
Belhaven College (MS) Bellarmine University Benedict College Bennett College for Women Bethel University Black Hawk College Bloomsburg University Blue Mountain College Bluffton University Brescia University Brewton-Parker College Burlington County College Cairn University
California University of Pennsylvania Calvary Bible College
Camden County College Campbell University Capital University Central Arizona College Central Bible College
Clarion University of Pennsylvania
Eastern University Eckerd College Edison State College Elizabeth City State University Endicott College
Everest College Excelsior College Ferris State University Ferrum College Fisk University
Florida Agricultural and Mechanical University
Florida Gateway College Florida International University Florida State College at Jacksonville George Fox University (OR) Governors State University Grambling State University Greenville Technical College Henderson State University Hesser College
High Point University Houston Baptist University Huston-Tillotson University Indiana State University Indiana University - System Office Jefferson State Community College Johnson C. Smith University Kaplan University Kaskaskia College Keiser University Keystone College LaGrange College Lake Land College
Lake Superior State University Lamar University
Lander University
Laramie County Community College Laredo Community College LeTourneau University Liberty University Limestone College Lindenwood University Lock Haven University of PA
Mount Vernon Nazarene University Neumann University
New England College of Business & Finance
New Jersey City University Newberry College Norfolk State University
Northeast State Technical Community College
Northern Arizona University Northwest Missouri State University Northwestern College (MN) Norwich University Ohio Christian University Oklahoma State University Ottawa University- Phoenix Palm Beach Atlantic University Palm Beach State College Parker University Patrick Henry College Patten University Pfeiffer University Pima Community College Pontifical College Prairie View A&M University Presentation College
Prince George's Community College Providence College
Quinnipiac University
Raritan Valley Community College Rasmussen College
Regent University Reinhardt College Rio Salado College
River Parishes Community College Roane State Community College Robert B. Miller College Saint Augustines University Saint Leo University
Saint Mary of the Woods University Saint Mary's University
Saint Peter's College Saint Philips College Sam Houston State University
Troy University Tusculum College
University of Akron Wayne College University of Akron, The University of Alabama at Birmingham
University of Alaska Fairbanks University of Central Missouri University of Central Oklahoma University of Charleston University of Cincinnati University of Colorado University of Colorado - Denver University of Delaware University of Houston - Victoria University of Illinois
University of Maine - Presque Isle University of Maryland - Eastern Shore
University of Maryland - University College
University of Mississippi University of Missouri - Columbia University of Mobile
University of North Carolina at Greensboro
University of North Florida University of North Texas - Dallas University of Northern Iowa University of Phoenix University of South Alabama University of South Carolina - Aiken University of South Carolina - Columbia
University of South Florida - St. Petersburg
University of Southern Indiana University of Southern Mississippi University of Tennessee - Chattanooga
University of Tennessee - Knoxville University of Tennessee at Martin University of Texas at Tyler University of the Cumberlands
Clark Atlanta University Clayton State University Clemson University Coastal Carolina University Coconino Community College College of Charleston College of Southern Maryland College of the Ozarks
Colorado State University- Global Campus
Colorado State University-Pueblo Columbia College (MO)
Community College of Baltimore County Community College of the Air Force Concordia College
Concordia University Chicago Coppin State University Covenant College Craven Community College Daytona State College Dean College Del Mar College
Delaware County Community College Denison University
DeVry University Dickinson State University Dordt College
Dyersburg State Community College East Stroudsburg University
Long Island University - CW Post Maharishi University of Management Mansfield University
Maranatha Baptist Bible College Marietta College
Martin Community College Massachusetts Maritime Academy McDowell Technical Community College
McNeese State University Metropolitan Community College Miami International University of Art and Design
Midland University Midway College Milligan College Minnesota State University Moorhead
Mississippi State University Missouri Southern State University Missouri State University Missouri University of Science and Technology
Montcalm Community College Morehouse College Morgan State University Motlow State Community College Mott Community College
Seminole State College of Florida South Arkansas Community College South Carolina State University South College
South University
Southeast Missouri State University Southeastern University
Southern Utah University Southern Vermont College Southern Wesleyan University Southwest Baptist University Southwestern Christian College Southwestern College Spalding University Spelman College
St. Johns River State College State College of Florida, Manatee-Sarasota
Stephen F. Austin State University Stevenson University
Strayer University Surry Community College Talladega College Tarleton State University
Texas A&M University - Corpus Christi Texas A&M University - San Antonio Texas A&M University Kingsville Texas A&M University-Commerce Thomas Edison State College Thomas More College Touro College
University of the Ozarks University of Tulsa University of West Alabama Vanguard University of Southern California
Victor Valley Community College Victoria College
Volunteer State Community College Walden University
Walters State Community College Warren County Community College Washburn University
Wayland Baptist University Wayne State University Webber International University West Coast University West Kentucky Community and Technical College
West Virginia University Western Oklahoma State College Western Texas College Western Wyoming Community College
Wilkes University William Carey University Winthrop University Young Harris College
SENIORS RI/RII/Doctoral
(N=57)
SENIORS ALL Institutions
(N= 379)
Andrews University Biola University Bowie State University Capella University Clark Atlanta University Clemson University
Colorado State University- Global Campus
Florida Agricultural and Mechanical University
Florida International University Indiana State University Indiana University - Bloomington Indiana University - System Office instituto Tecnologico y de Estudios Superiores de
Long Island University - CW Post Mississippi State University Montana State University Morgan State University
New Jersey Institute of Technology North Carolina A&T State University Northern Arizona University Oglala Lakota College
Abilene Christian University Adventist University of Health Sciences Aiken Technical College
Alabama State University Albany State University Albertus Magnus College Amberton University American Public University American Sentinel University Anderson University - South Carolina Andrews University
Angelo State University Antioch University McGregor Aquinas College (MI)
Armstrong Atlantic State University Art Institute of Atlanta, The Art Institute of Charlotte, The Art Institute of Dallas Art Institute of Houston Art Institute of Pittsburgh, The Asbury University
Ashford University
Ashland Community and Technical College
Fisk University
Florida Agricultural and Mechanical University
Florida International University Florida State College at Jacksonville Forman Christian College Fort Hays State University Framingham State College Francis Marion University Franklin University George Fox University (OR) Georgetown College Glendale Community College God's Bible School and College Governors State University Grambling State University Greenville Technical College Guilford College
Hesser College High Point University Holy Family University Houghton College Houston Baptist University
North Carolina Wesleyan College North Greenville University Northeast State Technical Community College
Northeastern Illinois University Northeastern Oklahoma A&M College Northern Arizona University Northern Michigan University Northwest Missouri State University Norwich University
Oakland City University Oglala Lakota College Ohio Christian University Oklahoma Baptist University Oklahoma State University Ottawa University Ottawa University- Phoenix Pace University - New York Pacific Union College Palm Beach Atlantic University Palm Beach State College Parker University Patrick Henry College
Trevecca Nazarene University Troy University
Troy University - Global Truman State University Tusculum College University of Akron, The
University of Alabama at Birmingham University of Alabama in Huntsville University of Alaska Fairbanks University of Arkansas - Little Rock University of Central Arkansas University of Central Missouri University of Central Oklahoma University of Charleston University of Cincinnati University of Colorado University of Colorado - Denver University of Delaware University of Houston - Downtown University of Illinois
University of Kansas
Oklahoma State University Pace University - New York Saint Philips College Sam Houston State University Seattle University
Spalding University Tennessee State University Texas A&M University - San Antonio Texas A&M University-Commerce Thomas Edison State College University of Akron, The
University of Alabama at Birmingham University of Alabama in Huntsville University of Alaska Fairbanks University of Cincinnati University of Colorado - Denver University of Delaware University of Illinois
University of Louisiana - Lafayette University of Massachusetts Lowell University of Mississippi
University of Missouri - Columbia University of Missouri - Kansas City University of Nevada
University of North Carolina at Greensboro
University of North Texas - Dallas University of South Carolina - Columbia University of South Florida - Sarasota-Manatee
University of South Florida - Tampa University of South Florida Polytechnic University of Southern Mississippi University of Tennessee - Knoxville University of Tulsa
Walden University Wayne State University Wilmington University
Athens State University Austin Peay State University Ave Maria University Baldwin Wallace University Bauder College
Becker College Belhaven College (MS) Bellarmine University Bemidji State University Bennett College for Women Bethel College
Bethel University Biola University Bloomsburg University Blue Mountain College Bluffton University Bowie State University Bradley University Brenau University Brewton-Parker College Bridgewater College Bryan College Cairn University
California University of Pennsylvania Camden County College
Campbell University Capella University Cazenovia College Central Bible College
Central Christian College of the Bible Charleston Southern University Charter Oak State College Cheyney University of Pennsylvania Claflin University
Clark Atlanta University Clayton State University Clemson University Coastal Carolina University Cochise College College of Charleston College of Coastal Georgia College of New Jersey, The College of Southern Maryland College of the Ozarks Colorado Mesa University
Colorado State University- Global Campus Colorado State University-Pueblo Columbia College (MO)
Columbia State Community College Community College of Baltimore County Community College of the Air Force Concordia College
Concordia University (CA) Concordia University Chicago
Howard Payne University Humboldt State University Huston-Tillotson University Indiana State University Indiana University - Bloomington Indiana University - System Office instituto Tecnologico y de Estudios Superiores de
Jacksonville State University Jamestown College
Jefferson State Community College John Tyler Community College Judson College
Kaplan University Kean University Keiser University Keystone College
Kutztown University of Pennsylvania LaGrange College
Lake Superior State University Lamar University
Lambuth University Lander University
Laramie County Community College Laredo Community College LDS Business College Lee University LeTourneau University Lewis-Clark State College Liberty University Limestone College Lindenwood University Lock Haven University of PA Long Island University - CW Post Louisiana College
Luther Rice University Madisonville Community College Maharishi University of Management Mansfield University
Maranatha Baptist Bible College Marian University (IN) Marietta College Martin Community College Mary Baldwin College
Massachusetts Maritime Academy McNeese State University Metropolitan Community College Metropolitan State College of Denver Miami International University of Art and Design
Midland University Midway College Mineral Area College
Minnesota State University Moorhead
Paul Quinn College Pfeiffer University Philander Smith College
Pima Community CollegePoint Loma Nazarene University
Point University Presentation College Providence College Queens University of Charlotte Quinnipiac University Rasmussen College Regent University Reinhardt College Rio Salado College Rivier University
Roane State Community College Robert B. Miller College Rocky Mountain College Saint Augustines University Saint Leo University
Saint Mary of the Woods University Saint Philips College
Sam Houston State University San Diego Christian College Schreiner University Seattle University
Seminole State College of Florida Shawnee State University Shenandoah University Shepherd University South Carolina State University South College
South University
Southeast Missouri State University Southeastern University Southern Adventist University Southern Catholic College
Southern Illinois University Carbondale Southern Illinois University Edwardsville Southern Utah University
Southern West Virginia Community and Technical Col
Southwest Baptist University
Southwest Tennessee Community College Southwest Texas Junior College Southwestern Assemblies of God University
Southwestern College Spalding University Spelman College Spring Hill College St. Petersburg College St. Vincent's College Winthrop University
University of Maine - Fort Kent University of Maine - Presque Isle University of Maryland - Eastern Shore University of Maryland - University College
University of Massachusetts Dartmouth
University of Massachusetts Lowell University of Memphis
University of Mississippi University of Missouri - Columbia University of Missouri - Kansas City University of Mobile
University of Nevada University of North Carolina at Greensboro
University of North Carolina at Wilmington
University of North Florida University of North Texas - Dallas University of North Texas - Denton University of Northern Iowa University of Phoenix University of Pikeville University of South Alabama University of South Carolina - Aiken University of South Carolina - Columbia University of South Carolina - Upstate University of South Florida - Sarasota-Manatee
University of South Florida - St. Petersburg
University of South Florida - Tampa University of South Florida Polytechnic University of Southern Indiana University of Southern Mississippi University of Tennessee - Chattanooga University of Tennessee - Knoxville University of Tennessee at Martin University of Texas at Tyler University of Texas Pan American University of the Cumberlands University of the Ozarks University of Tulsa
University of Wisconsin - Platteville University of Wisconsin - Stevens Point Vanguard University of Southern California
Victoria College Victory University
Volunteer State Community College Walden University
Walters State Community College Washburn University
Coppin State University Covenant College Craven Community College Dallas Baptist University Darton College Daytona State College Delaware Valley College Denison University DeVry University Dickinson State University Dordt College
Durham Technical Community College Dyersburg State Community College East Stroudsburg University Eastern Mennonite University Eastern New Mexico University Eckerd College
ECPI University
Edinboro University of Pennsylvania Endicott College
Everest College Everglades University Excelsior College Felician College - Lodi Ferris State University Fisher College
Minnesota State University, Mankato Mississippi College
Mississippi State University Mississippi Valley State University Missouri Southern State University Missouri State University Missouri Western State University Montana State University Montana Tech of the University of Montana
Montclair State University Morgan State University Motlow State Community College Mott Community College Mount Olive College
Mount Vernon Nazarene University National College
Neumann University New Jersey City University New Jersey Institute of Technology New Orleans Baptist Theological Seminary
Newberry College Nicholls State University Norfolk State University North Carolina A&T State University
Worcester State College State Fair Community College Stephen F. Austin State University Sterling College
Strayer University Sullivan University Surry Community College Talladega College Tarleton State University Taylor University Tennessee State University Tennessee Wesleyan College Texas A&M University - Central Texas Texas A&M University - Corpus Christi Texas A&M University - San Antonio Texas A&M University - Texarkana Texas A&M University Kingsville Texas A&M University-Commerce Texas Wesleyan University Thomas Edison State College Thomas More College Three Rivers Community College Toccoa Falls College
Touro College
Wayland Baptist University Wayne State University Webber International University West Kentucky Community and Technical College
Western Connecticut State University Western International University Western Oklahoma State College Western Wyoming Community College Wiley College
Wilkes University Wilmington University Wingate University
Appendix II: Comparison of NCSU ETS PP test takers with other ETS PP test takers nationally
Freshmen Overall Compared to other freshmen in ETS Comparison group
2, our freshman
3overall
score was in the
92nd
percentile.
Compared to all freshman
who had taken the ETS PP our students
were in the
97
thpercentile
.
o
Scaled Scores Freshmen Compared to ALL institutions (N=273)
Critical thinking 90
thpercentile
Reading 89
thpercentile
Writing 96
thpercentile
Math 97
thpercentile
Humanities 79
thpercentile
Social Science 86
thpercentile
Natural Sciences 89
thpercentile
o
Scaled Scores Freshman Compared to ETS Comparison Group
(N=37)
Critical thinking 76
stpercentile
Reading 78
thpercentile
Writing 86
thpercentile
Math 89
thpercentile
Humanities 62
thpercentile
Social Science 65
thpercentile
Natural Sciences 65
thpercentile
Senior Overall Compared to other seniors in ETS Comparison
group our seniors overall score was in
the
89
thpercentile.
Compared to
all
seniors
who had taken the ETS PP our students were in the
96
thpercentile.
o
Scaled Scores Seniors Compared to ALL institutions (N=379)
Critical thinking is 81
st
Reading is 86
th
Writing is 93
rd
Math is 98
th
Humanities is 78
th
Social Sciences is 85
th
Natural Sciences is 78
tho
Scaled Scores Seniors Compared to ETS Comparison Group (N=57)
Critical thinking 63
rdpercentile
Reading is 75
th
Writing is 89
th
Math is 95
th
Humanities 58
th
Social Science is 70
th
Natural Sciences is 54
th2
The ETS comparative data report conflates RI, RII and doctoral universities into a single category for comparison. This is their
convention and since they do not distinguish between the three, the term in this report ETS Comparison group refers to all other RI,
RII and doctoral institutions which have administered the ETS PP.
3
Here, freshmen does not refer to incoming freshmen, but rather freshmen with <30 credit hours. This is the cohort we tested and
ETS allows for the distinction in comparison groups between freshmen with 0 credit hours (incoming) and those with <30 semester
hours or <45 quarter hours.
Appendix III: Description of proportional weighting
We used a weighting formula by proportion to adjust for any proportional differences between the sample and
population.
Calculating Weights (post-stratification weighting):
w
ijklis the weight of the
i
thobservation in race
j
, gender
k
, and college
l
.
Calculating weighted average:
NCSU Subject & Proficiency Definition ETS PP proficiency definition Mapping between NCSU and ETS
Usability?
Humanities The humanities comprise the subjects and disciplines that use various models of rational inquiry to understand human nature and experience, organization and change in human societies, the nature of the world, and rational inquiry itself. An education in the humanities requires analysis and interpretation of significant works, gaining an exposure to a variety of methodologies, and learning to apply these in written exposition. An education in the basic humanistic disciplines is necessary to become a citizen with a broad knowledge of human cultures and with well-considered moral, philosophical, aesthetic, and intellectual convictions.
Category Objectives: Each course in the Humanities category of the General Education Program will provide instruction and guidance that help students to:
1. Engage the human experience through the interpretation of human culture and 2. Become aware of the act of interpretation itself
as a critical form of knowing in the humanities; and
3. Make academic arguments about the human experience using reasons and evidence for supporting those reasons that are appropriate to the humanities.
Humanities: The humanities materials include selections (poetry, fiction, and nonfiction prose) from classical literature in translation and from American and British literature. The materials also include discussion of key terms in humanities. Visual elements are presented, as well as discussions of painting, music, philosophical issues, and materials by and about women and minorities. The content is drawn from material typically encountered in introductory courses in literature, art, music, and philosophy
N/A Not useable
Natural sciences The natural sciences pursue basic questions about the workings of the universe, and the richness, variety and interconnectedness of the world around us. Students today are exposed to an increasing volume of information, from a large variety of sources, in diverse and changing formats. Training in the natural sciences is essential to help students develop skills to distinguish between testable and un-testable ideas, recognize scientifically valid tests of theories, and understand how information relates to those tests. By studying the natural sciences, students learn to reason both inductively and deductively, develop and test scientific hypotheses, and understand the value and limitations of scientific studies. The development and application of new technologies require scientifically literate citizens who can understand technological issues and evaluate the role of science in society's debate of those issues.
Category Objectives: Each course in the Natural Sciences will provide instruction and guidance that help the student to:
1. use the methods and processes of science in testing hypotheses, solving problems and
Natural Sciences: The natural sciences materials are often interdisciplinary in nature; that is, they present topics and issues that might be discussed in a general education course in biology, chemistry, or physics. In addition, the materials may present experimental findings in ways that are familiar to a student who has taken any kind of general education science course. Where materials are not interdisciplinary, topics and issues in biology will receive more emphasis than those in chemistry and physics. The materials includes both reading selections and graphs and/or charts.
N/A Not useable
making decisions; and
2. make inferences from and articulate, scientific concepts, principles, laws, and theories, and apply this knowledge to problem solving.
Social Sciences Rationale: The study of social sciences enables students to understand individual and collective human behavior by exploring meaning within a variety of social, cultural, political, and economic contexts, analyzing the structures within which human goals are established and human choices are made, and applying theoretical and empirical models to specific cases.
Category Objectives: Each course in the Social Sciences category will provide instruction and guidance that help students to:
1. Examine at least one of the following: human behavior, culture, mental processes, organizational processes, or institutional processes; and
2. Demonstrate how social scientific methods may be applied to the study of human behavior, culture, mental processes, organizational processes, or institutional processes; and
3. Use theories or concepts of the social sciences to analyze and explain theoretical and/or real-world problems, including the underlying origins of such problems.
Social Sciences: The social sciences materials present topics and issues that might be discussed in a general education course in history, economics, political science, psychology, anthropology, sociology, or indeed any general education social science course. The materials are often interdisciplinary in their approach to a topic; that is, they draw on more than one of the social science fields in their presentation of a topic. Social sciences topics of particular relevance to women and minorities are represented in the materials, which include both reading selections and graphs and/or tables. Questions include reading selections, graphs, and charts.
N/A Not useable
Writing Written communication is the purposeful development, expression, and revision of ideas in writing for specific audiences. Effective written communication follows appropriate genre conventions and may include a combination of text and other media. Students will be able to:
Recognize that writing is purposeful and varies according to context
Understand that writing is a complex, nonlinear process
Understand that writing often builds on the work of others and that strategies for locating and criteria for evaluating information vary according to context
Recognize when to acknowledge the source of others’ texts or ideas in their own writing
Be aware of a variety of technologies to compose, produce and publish their work
Level 1
Recognize agreement among basic grammatical elements (e.g. nouns, verbs, pronouns and conjunctions)
Recognize appropriate transition words
Recognize incorrect word choice
Order sentences in a paragraph
Order elements in an outline Level 2
Incorporate new material into a passage
Recognize agreement among basic grammatical elements (e.g. nouns, verbs, pronouns, and
conjunctions) when these elements are complicated by intervening words or phrases
Combine simple clauses into single, more complex combinations
Recast existing sentences into new syntactic combinations
Level 3
Discriminate between appropriate and inappropriate use of parallelism
ETS PP’s “Discriminate between appropriate and inappropriate use of idiomatic language” comprises a small part of NCSU’s description of recognizing that writing is purposeful and varies according to context
ETS PP focuses primarily on mechanics. There is very limited connection between outcomes.
Discriminate between appropriate and inappropriate use of idiomatic language
Recognize redundancy
Discriminate between correct and incorrect constructions
Recognize the most effective revision of a sentence Quantitative
Literacy
A “habit of mind,” competency, and comfort in working with numerical data. Individuals with strong QL skills possess the ability to reason and solve quantitative problems from a wide array of authentic contexts and everyday life situations. They understand and can create sophisticated arguments supported by quantitative evidence, and they can clearly communicate those arguments in a variety of formats (using words, tables, graphs, mathematical equations, etc., as appropriate).
Students will be able to:
Explain information presented in mathematical forms (e.g. equations, graphs, diagrams, tables, words)
Convert relevant information into various quantitative forms (e.g. equations, graphs, diagrams, tables, words)
Attempt and successfully complete all appropriate calculations for the task at hand Make judgments and draw appropriate conclusions based on the quantitative, logical and statistical analysis of data, while recognizing the limits of this analysis
Level 1
Solve word problems that would most likely be solved by arithmetic and do not involve conversion of units or proportionality
Solve problems involving the informal properties of numbers and operations, often involving the Number Line, including positive and negative numbers, whole numbers and fractions (including conversion of common fractions to percent, such as a conversion ¼ to 25%)
Solve problems requiring a general understanding od square roots and the squares of numbers
Solve a simple equation or substitute numbers into an algebraic expression
Find information from a graph Level 2
Solve arithmetic problems with some complications, such as complex wording, maximizing or minimizing and embedded ratios
Simplify algebraic expressions, perform basic translations and draw conclusions from algebraic equations and inequalities
Interpret a trend represented in a graph or choose a graph that reflects a trend
Solve problems involving sets Level 3
Solve word problems that would be unlikely to be solved by arithmetic; the answer choice are either algebraic expressions or are numbers that do not lend themselves to back solving
Solve problems involving difficult arithmetic concepts such as exponents and roots other than squares and squares roots and percent’s of increase or decrease
Generalize about numbers, e.g.; identify the values of (x) for which an expression increases as (x) increases
Solve problems requiring an understanding o the properties of integers, rations numbers, etc.
Interpret a graph in which the trends are to be expressed algebraically or in which one of the following is involved: exponents and roots other than squares and square roots, percent of increase or decrease
Solve problems requiring insight or logical reasoning
Levels 1 and 2 of the ETS PP contain outcomes tied to NCSU’s (AACU) outcomes for calculation and interpretation. Level 3 of ETS PP measures outcomes tied to NCSU’s outcomes for calculation, interpretation, representation and application/analysis.
There is a sufficient connection between NCSU and ETS PP outcomes.
Reading/Critical Thinking
Critical thinking is the active, persistent, and careful consideration of a belief or form of knowledge, the grounds that support it, and the conclusions that follow. It involves analyzing and evaluating one’s own thinking and that of others.
Students will be able to:
Raise vital questions and problems, and formulate these clearly and precisely
Gather and assess relevant information
Level 1
Recognize factual material explicitly presented in a reading passage
Understand the meaning of particular works or phrases in the context of the reading passage
Level 2
Synthesize material from different sections of a passage
Recognize valid inferences derived from material in the passage
Identify accurate summaries of a passage or of
Most of Level 2 and 3 are loosely tied to the NCSU outcomes:
Gather and assess relevant information
Reach well-reasoned conclusions
There is a sufficient connection between NCSU and ETS PP outcomes. This is usable, though not perfect match.
“Materials included in the ETS Proficiency Profile—reading sections, graphs, tables, and artistic designs—are concerned with issues, themes and ideas from the humanities, social
sciences and natural sciences. The questions related to these materials—for example, the questions that follow a reading section—measure a students’ ability to read carefully, to
make judgments about the clarity, correctness, or organization of the materials as pieces of writing, and to think critically about the issues and arguments presented. Mathematical
data are presented largely although not exclusively in a mathematical form independent of academic content.
The questions do not explicitly ask for recall of information learned in specific courses in the humanities, social sciences or natural sciences, they assume however that a student who
has taken general education courses in these areas will be better able to read the materials and answer the accompanying questions than a student who has not taken such courses.”
In essence, Reading, Writing, Critical Thinking and Mathematics are the content measured on the ETS PP and many of the questions that seek to measure these skills are
framed
as
Humanities, Social Science, or Natural Science questions.
Reach well-reasoned conclusions and test them against appropriate criteria and standards
Openly consider alternative systems of thought or points of view
Effectively communicate to others the analysis of and/or proposed solutions to questions or problems.
significant sections of a passage
Understand and interpret figurative language
Discern the main idea, purpose, or focus of a passage or a significant portion of a passage
Level 3
Evaluate competing casual explanations
Evaluate hypotheses for consistency with known facts
Determine the relevance of information for evaluating an argument or conclusion
Determine whether an artistic interpretation is supported by evidence contained in a work
Recognize the salient features or themes in a work of art
Evaluate the appropriateness of procedures for investigating a question of causation
Evaluate data for consistency with known facts, hypotheses or methods
and test them against appropriate criteria and standards
Openly consider alternative systems of thought or points of view