Australian Journal of Basic and Applied Sciences
2019 January; 13(1): pages 96-103 DOI: 10.22587/ajbas.2019.13.1.12 Original paper AENSI Publications Journal home page: www.ajbasweb.com
Australian Journal of Basic and Applied Sciences ISSN: 1991-8178, EISSN: 2309-8414
Structure and Spatial Pattern of Vegetation in a Fragment of
Atlantic Forest
Géssyca Fernanda de Sena Oliveira¹, Ana Lícia Patriota Feliciano², Luan Henrique Barbosa de Araújo³, Anderson Oliveira de Lima1, José Alberes Santos da Cunha4, Adriano Castelo dos Santos³
1
Forest engineer, Master's student in Forest Sciences, Federal Rural University of Pernambuco, Brazil. ² Forest engineer, Department of Forestry Science, Federal Rural University of Pernambuco, Brazil. 3 Forest engineer, PhD student in Forest Sciences, Federal Rural University of Pernambuco, Brazil, 4 Biologist, Master's student in Forest Sciences, Federal Rural University of Pernambuco, Brazil.
Correspondence Author: Adriano Castelo dos Santos, Forest engineer, PhD student in Forest Sciences, Federal Rural University of Pernambuco. E-mail:- [email protected]
Received date: 11 December 2018, Accepted date: 22 Janaury 2018, Online date: 29 January 2019
Copyright: © 2019 Géssyca Fernanda de Sena Oliveira et al, This is an open-access article distributed under the terms of the Creative Commons Attribution License, which permits unrestricted use, distribution, and reproduction in any medium, provided the original author and source are credited.
Key words: floristic, distribution of species; tropical forest; phytosociology.
INTRODUCTION
Native forests are still the main targets for environmental degradation in the world, and those that are classified as tropical suffer from even more intense and severe anthropogenic disturbances (Vaidyanathan et al., 2010, Estes et al., 2011; Morris, 2010). As a result, they tend to go through complex and gradual successional stages that aim to reestablish the various ecosystem processes previously lost and that maintain the self-sustaining functioning of this environment (Feeley et al., 2011).
In the Atlantic Forest, due to the marked anthropogenic action, it is challenging to maintain and conserve the biodiversity of the Atlantic Forest, which currently reflects the consequences of its degradation initiated since the colonial period (Turchetto et al., 2017). This phytogeographic domain presents a very diverse fauna and flora and was pointed out as the most devastated in Brazil according to data from the IBGE (2018). Carvalho et al. (2016) emphasize that the process of forest fragmentation causes physical and biological changes in the environment.
The Atlantic Forest is considered by the scientific community as an area of importance for the conservation of global biodiversity (Alves-Costa et al., 2008), because it has a high diversity and is affected by intense anthropic pressure. Therefore, studies that attenuate the effects of degradation in this phytogeographic domain are of great relevance.
Thus, Phytosociology becomes a relevant tool in obtaining information of great importance, since it helps in procedures that aim at the recovery of degraded environments, the production of seedlings, the recognition of endangered species, besides influencing decision-making on the most appropriate management actions, that should be done in a certain area for conservation purposes (Felfili and Venturoli, 2000; Brito et al., 2007).
Abstract
The degradation of the Atlantic Forest is a reflection of the occupation and irrational exploitation of natural resources, which resulted in a drastic reduction of vegetation cover and fragmentation of these habitats. Thus, the objective of this study was to evaluate the species diversity, horizontal structure and spatial pattern of a fragment of Atlantic. Ten plots with dimensions of 10 m x 25 m (250 m²), were distributed in a completely random manner in the area. The data were obtained from the identification and measurement of the arboreal individuals with circumference at the breast height (Cbh) at 1.30 m of the soil > 15 cm. The total height was estimated by using a 6 m long ruler positioned near the individual to be measured. The horizontal structure was calculated based on the following phytosociological parameters: density, frequency, dominance, importance value and diversity indices (Shannon Index - H ' and Pielou Equability - J). The spatial distribution pattern of the species was analyzed for the ten of the highest absolute density observed in the phytosociological analysis of the fragment. For this, we used the MacGuinnes index. The diversity Shannon Index was 3.37 nats. ind.-1 and the Pielou equability index of 0.83. In
general, the species presented an aggregate pattern of distribution in the area, with emphasis on the species
When one wishes to infer about the structure and behavior of forest communities and to portray the relationship between vegetation, soil and climate, the indexes titled phytosociological parameters are used, which allow predicting characteristics such as the stage of development of the community but also on the quality and productivity of the analyzed environment (Souza and Soares, 2013; Chaves et al., 2013).
Degradation processes resulting from natural events or human activities entail the fragmentation of these environments (Gris et al, 2014; Zanini et al, 2014), reflecting directly on the landscape structure, as well as results in different levels and degrees of disturbance, implying variation in the frequency and abundance of pioneer species and vegetation patterns (Lasky et al., 2013). In view of the above, the objective of this work was to analyze the species diversity, the horizontal structure and the spatial pattern of a fragment of the Atlantic Forest located in Dois Irmãos State Park, Recife, Pernambuco, Brazil.
2 MATERIAL AND METHODS
Study Area
The research was developed in a fragment of Atlantic Forest of 774.09 ha, located in Dois Irmãos State Park (PEDI), Recife, Pernambuco, Brazil. The Park is a Conservation Unit of Integral Protection and has a total area of 1.158 ha, composed of two fragments in different successional stages, being the Mata de Dois Irmãos with 384.42 ha of mature forest and Brejo dos Macacos Farm with 774.09 ha of secondary forest whose area was incorporated into the PEDI by Decree 40.547 in 2014, being the area under study (Figure 1).
Fig. 1: Geographic location of the fragment of Ombrophylous Dense Forest, Recife, Pernambuco, Brazil.
The climate of the region is of type As' (tropical rainy) according to the classification of Köppen, with high temperatures throughout the year and rainy season concentrated between the months of March and August (Alvares et al., 2013).
Data Collection
The sampling process consisted of a floristic and parametric survey of the vegetation, where 10 plots with dimensions of 10 mx 25 m (250 m²) were distributed randomly in the fragment, approximately 20 m from the edge of the remnant. All tree individuals with Circumference at breast height (Cbh) at 1.30 m of soil > 15 cm and total height (Ht) above 1.0 m, were estimated with the aid of a 6-degree ruler, were measured in each plot m in length. Cbh was measured using a tape measure and the data obtained were converted to diameter at breast height (Dbh).
The names of the families were updated according to the proposed Angiosperm Phylogeny Group IV (APG, 2016) system and the scientific names of the species were confirmed according to the nomenclature of the Missouri Botanical Garden (2018) and in "The plant list". The abbreviation of the authors' names followed the one given by Brummitt and Powell (1992). When it was not possible to identify them in the field, the characteristics of the plants and the collections of the botanical material were made for the preparation of exsiccates, with a view to later identification.
Phytosociological Characterization
The analysis of the diametric distribution of individuals in diameter classes was performed by means of histograms, with the number and amplitude between the classes defined by the method of Sturges Method (1926):
k = 1 + 3,3 (log10 n); w = R/k
where:
k = number of classes; n = number of observations; w = total amplitude;
R = difference between the highest and the lowest observed value.
Spatial distribution
The spatial distribution pattern of the species was analyzed for the ten of the highest absolute density observed in the phytosociological analysis of the fragment. For this, the MacGuinnes index (1934) was used to calculate the aggregation pattern of the species by means of the following expressions:
Where:
IGAi = MacGuinnes index;
Di = observed density of the ith species; di = expected density of the ith species; ln = neperian logarithm;
ni = number of individuals sampled from the ith species; Ui = number of sample units that the ith species occurs; UT = total number of sample units.
Considering that the index is based on the observed and expected density of the species, where IGAi ≤ 1.0 indicates uniform distribution; IGAi = 1.0 indicates pattern of random distribution; 1.0 <IGAi ≤ 2.0 indicates grouping tendency; and IGAi> 2.0 indicates the grouping of the individuals of the species, considering the ten species with the highest density for analysis purposes, since these represent 63.26% of the number of individuals sampled in the survey.
Statistical analysis
The graphical representation of the histograms of the individuals and data processing were used Microsoft Excel 2010 software and the statistical program R (R Core Team, 2018).
3 RESULTS
Floristic Composition
In the floristic and structural survey of the vegetation, 411 arboreal individuals were cataloged in 58 species belonging to 33 botanical families (Table 1).The most representative families as the richness of species in the studied fragment were Fabaceae with 12 species, followed by Myrtaceae with six, Anarcadiaceae with four and Melastomataceae with three species, totaling 43.10% of the species cataloged in the present study.
Table 1: Families and tree species raised in the Atlantic Forest fragment and their respective phytosociological parameters. ni =
number of individuals sampled; DAi = absolute density in number of individuals (n ha-1); DRi = relative density (%); FAi = absolute frequency; FRi = relative frequency (%); DoAi = absolute dominance (m2 ha-1); DoRi = relative dominance (%) and VI = value of importance (%).
Family Botanical name ni DAi DR FAi FR
Do
Ai DoR IV
Chrysobalanac
eae Licania tomentosa (Benth.) Fritsch. 3 12 0.73 10.00 0.68 0.02 0.20 0.54
Hypericaceae Vismia guianensis (Aubl.) Pers. 1 4 0.24 10.00 0.68 0.02 0.14 0.35
Lecythidaceae Eschweilera ovata (Cambess.) Mart. ex Miers 43 172 10.46 80.00 5.41 0.74 6.31 7.39
Paulowniaceae Paulownia fortunei (Seem.) Hemsl. 1 4 0.24 10.00 0.68 0.02 0.14 0.35
Anacardiaceae
Anacardium occidentale L. 2 8 0.49 20.00 1.35 0.05 0.44 0.76
Erythroxylum deciduum A.St.-Hil. 29 116 7.06 70.00 4.73 0.71 6.05 5.94
Tapirira guianensis Aubl. 7 28 1.70 40.00 2.70 1.01 8.61 4.34
Thyrsodium spruceanum Benth. 25 100 6.08 40.00 2.70 0.32 2.68 3.82
Apocynaceae Himatanthus bracteatus (A.DC.) Woodson 4 16 0.97 10.00 0.68 0.14 1.21 0.95
Plumeria bracteata A.DC. 1 4 0.24 10.00 0.68 0.06 0.55 0.49
Araliaceae Didymopanax morototoni (Aubl.) Decne. &
Planch. 10 40 2.43 60.00 4.05 0.40 3.41 3.30
Boraginaceae Cordia superba Cham. 1 4 0.24 10.00 0.68 0.01 0.09 0.34
Burseraceae Protium heptaphyllum (Aubl.) Marchand 3 12 0.73 20.00 1.35 0.07 0.59 0.89
Celastraceae Maytenus distichophylla Mart. 4 16 0.97 20.00 1.35 0.06 0.55 0.96
Clusiaceae Clusia nemorosa G.Mey. 19 76 4.62 30.00 2.03 0.82 6.99 4.55
Elaeocarpacea
e Sloanea guianensis (Aubl.) Benth. 1 4 0.24 10.00 0.68 0.02 0.20 0.37
Erythroxylacea e
Erythroxylum citrifolium A.St.-Hil. 4 16 0.97 30.00 2.03 0.05 0.39 1.13
Erythroxylum revolutum Mart. 1 4 0.24 10.00 0.68 0.02 0.18 0.37
Fabaceae
Albizia Pedicellaris (DC.) L.Rico 1 4 0.24 10.00 0.68 0.30 2.57 1.16
Abarema filamentosa (Benth.) Pittier 5 20 1.22 30.00 2.03 0.07 0.63 1.29
Bowdichia virgilioides Kunth 1 4 0.24 10.00 0.68 0.04 0.33 0.42
Caesalpinia peltophoroides Bentham 48 192 11.68 40.00 2.70 0.83 7.06 7.15
Cassia Multijuga Rich. 4 16 0.97 20.00 1.35 0.08 0.72 1.01
Chamaecrista ensiformis (Vell.) H.S.Irwin &
Barneby 17 68 4.14 20.00 1.35 0.56 4.73 3.40
Ormosia bahiensis Monach. 1 4 0.24 10.00 0.68 0.09 0.79 0.57
Plathymenia foliolosa Benth. 6 24 1.46 40.00 2.70 0.17 1.48 1.88
Pterocarpus violaceus Vogel 3 12 0.73 20.00 1.35 0.33 2.84 1.64
Pterodon emarginatus Vogel 7 28 1.70 40.00 2.70 0.26 2.21 2.20
Sclerolobium paniculatum Vogel 1 4 0.24 10.00 0.68 0.20 1.71 0.88
Stryphnodendron adstringens (Mart.) Coville 1 4 0.24 10.00 0.68 0.01 0.09 0.34
Goupiaceae Goupia glabra Aubl. 4 16 0.97 10.00 0.68 0.61 5.23 2.29
Lauraceae Ocotea glomerata (Nees) Mez 2 8 0.49 20.00 1.35 0.05 0.40 0.75
Lecythidaceae Lecythis pisonis Cambess. 7 28 1.70 30.00 2.03 0.14 1.19 1.64
Malpighiaceae Byrsonima crassifolia (L.) Kunth 24 96 5.84 90.00 6.08 0.59 4.98 5.63
Malvaceae Luehea paniculata Mart. 9 36 2.19 50.00 3.38 0.37 3.13 2.90
Melastomatace ae
Miconia hypoleuca (Benth.) Triana 1 4 0.24 10.00 0.68 0.01 0.08 0.33
Miconia minutiflora (Bonpl.) DC. 1 4 0.24 10.00 0.68 0.01 0.06 0.33
Miconia prasina (Sw.) DC. 13 52 3.16 70.00 4.73 0.22 1.84 3.24
Moraceae Brosimum guianense (Aubl.) Huber ex Ducke 6 24 1.46 30.00 2.03 0.06 0.52 1.34
Myrtaceae
Campomanesia dichotoma (O.Berg) Mattos 5 20 1.22 20.00 1.35 0.14 1.20 1.25
Eugenia sp. 1 4 0.24 10.00 0.68 0.01 0.09 0.34
Myrcia guianensis (Aubl.) DC. 4 16 0.97 20.00 1.35 0.02 0.21 0.85
Myrcia sylvatica (G.Mey.) DC. 30 120 7.30 50.00 3.38 0.68 5.80 5.49
Myrcia tomentosa (Aubl.) DC. 2 8 0.49 20.00 1.35 0.03 0.25 0.70
Myrcia splendens (Sw.) DC. 12 48 2.92 60.00 4.05 0.34 2.92 3.30
Nyctaginaceae Bougainvillea spectabilis Willd. 1 4 0.24 10.00 0.68 0.04 0.37 0.43
Guapira laxa (Netto) Furlan 7 28 1.70 20.00 1.35 0.15 1.24 1.43
Ochnaceae Ouratea polygyna Engl. 2 8 0.49 10.00 0.68 0.07 0.59 0.58
Olacaceae Ximenia americana L. 1 4 0.24 10.00 0.68 0.02 0.13 0.35
Peraceae Pera ferruginea (Schott) Müll.Arg. 8 32 1.95 50.00 3.38 0.33 2.83 2.72
Pogonophora schomburgkiana Miers ex Benth. 1 4 0.24 10.00 0.68 0.01 0.10 0.34
Polygonaceae Coccoloba mollis Casar. 4 16 0.97 30.00 2.03 0.08 0.65 1.22
Primulaceae Myrsine guianensis (Aubl.) Kuntze 4 16 0.97 20.00 1.35 0.05 0.42 0.91
Rubiaceae Alseis pickelle Pilg. & Schmale 2 8 0.49 10.00 0.68 0.10 0.81 0.66
Rutaceae Zanthaxilum sp. 1 4 0.24 10.00 0.68 0.02 0.20 0.37
Salicaceae Casearia javitensis Kunth 2 8 0.49 20.00 1.35 0.03 0.24 0.69
Sapindaceae Allophylus edulis (A.St.-Hil., A.Juss. &
Cambess.) Radlk. 1 4 0.24 10.00 0.68 0.01 0.07 0.33
Total 41
1 164 4 100.0 0 1480. 00 100.0 0 11.7 5 100.0 0 100.0 0
We sampled 1644 individuals, where the most representative species for absolute and relative density were Caesalpinia
peltophoroides, Eschwleira ovata, Myrcia sylvatica, Erythroxylum deciduum, Thyrsodium spruceanum and Byrsonima crassifolia,
Fig. 3: Species that presented higher values of DAi and DRi in the Atlantic Forest fragment.
The species that presented the highest value of importance were Eschweilera ovata, Erythroxylum deciduum, Byrsonima
crassifolia, Myrcia sylvatica and Clusia nemorosa (Figure 4).
Fig. 4: Relation of species with higher Value of Importance (VI) in the fragment.
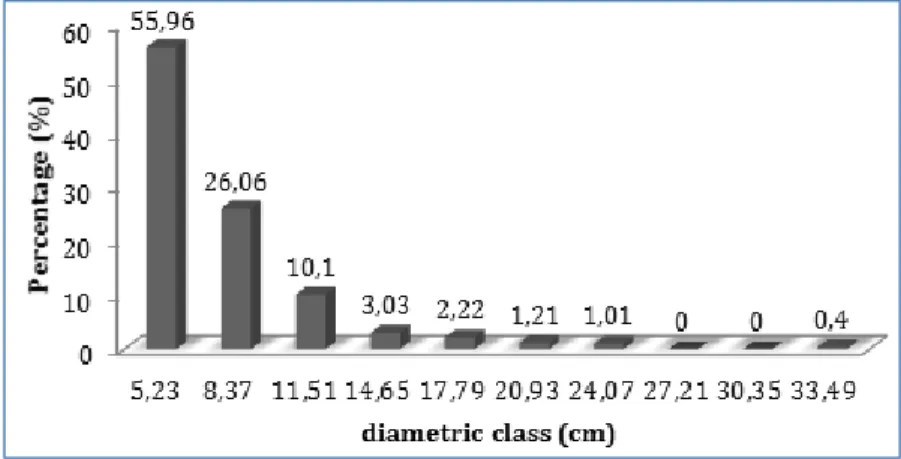
The arithmetic mean of the diameters of the arboreal individuals sampled in the fragment was 7.78 cm, with a diametric variation between 3.66 and 34.70 cm. Goupia glabra was the species with the highest DBH (34.70 cm), followed by Tapirira
guianensis (34.54 cm), Sclerolobium paniculatum (25.31 cm) and Clusia nemorosa (24.83 cm). The remainder presented a
diametric distribution pattern tending to the J-inverted, represented by a higher frequency of individuals concentrated in smaller diameter classes and the progressive decrease of the frequency with the increase of the diametric class (Figure 5).
Fig. 5: Diameter distribution of tree individuals with DBH ≥ 4.77 cm (Cbh ≥ 15 cm) sampled.
The Shannon diversity index for the forest community was 3.37 nats. ind.-1 and Pielou equability index was 0.83. In general, the species presented an aggregate pattern of distribution in the area, with emphasis on the species Miconia prasina and Myrcia
splendens, which presented a pattern with tendency to cluster and Byrsonima crassifolia that presented a random pattern (Table 2).
Table 2. Pattern of spatial distribution of species in the forest fragment.
Caesalpinia peltophoroides 9.4 Aggregate distribution
Eschweilera ovata 2.7 Aggregate distribution
Myrcia sylvatica 4.3 Aggregate distribution
Erythroxylum deciduum 2.4 Aggregate distribution
Thyrsodium spruceanum 4.9 Aggregate distribution
Byrsonima crassifolia 1.0 Random distribution
Clusia nemorosa 5.3 Aggregate distribution
Chamaecrista ensiformis 7.6 Aggregate distribution
Miconia prasina 1.1 Tendency to cluster
Myrcia splendens 1.3 Tendency to cluster
4 DISCUSSION
As in the present study, other authors such as Araújo et al. (2015), Colonetti et al. (2009) and Costa Junior et al. (2008) analyzing the phytosociological structure of fragments of Atlantic Forest also showed that a small number of species presented high density. According to Richards (1996), the dominance of a reduced number of species in the environment is a common occurrence in humid tropical forests. However, this fact may also be related to the successional stage of the fragment, where few species dominate the environment and the resources of the environment. According to Martins (2012), with vegetation advancement in the process of ecological succession, the density of individuals tends to decrease due to greater inter and intraspecific competition.
Sawczuk et al. (2014), analyzing the changes in the horizontal structure of a mixed ombrophilous forest in the state of Paraná, showed that the progression of the successional stage was accompanied by a decrease in the total number of trees, whose autho rs associated such response to factors such as inter and intraspecific and to a greater dominance exerted by the individuals of
Araucaria angustifolia and Ocotea porosa, that in turn, increased their diameters in the period of study between the years of 2002
and 2008. However, to test this hypothesis, studies related to the population dynamics of tree species are suggested in order to follow the changes in the structure of the remnant.
The absolute dominance in the community was 11.75 m² ha-1, being lower than that found by Costa Junior et al. (2008), Araújo et al. (2015) and Lima et al. (2017) when analyzing the structure of Atlantic Forest fragments in the Brazilian Northeast, whose values were 22.13 m² ha-1, 23.59 m² ha-1 and 19.63 m² ha-1, respectively. This fact can be explained by the successional stage of the fragment of forest analyzed, the size of the area sampled, as well as the anthropic disturbances that preceded t he incorporation of the fragment to the Conservation Unit Dois Irmãos State Park.
According to Martins (2012) dominance is an attribute represented by abundance expressed in m² ha-1, having been used worldwide to represent vegetation biomass. In order to analyze the species' dominance of the community, it was observed that
Tapirira guianensis, Caesalpinia peltophoroides, Clusia nemorosa, Eschweilera ovata, Erythroxylum deciduum and Myrcia
sylvatica are the species that contribute the most to the biomass of the studied fragment, totaling 40.96%.
The species that obtained the highest frequency in the survey were Byrsonima crassifolia, Eschweilera ovata, Miconia prasina
and Erythroxylum deciduum. According to Araújo et al. (2015) a relatively uniform distribution of species in vegetation may be
related to dispersal strategies, species spatial pattern, species adaptation to limiting factors, ecological behavior and inter- and intraspecific interactions among the species of the community.
The species that most stood out in Valor of Importance was Eschweilera ovata, by the highest values of relative density and relative frequency, being present in 80% of the plots sampled. Caesalpinia peltophoroides was present in 40% of the plots, resulting in the second highest value of Relative Dominance (Table 1). Oliveira et al. (2013) evaluated the horizontal struct ure in a fragment of Atlantic Forest in the State of Pernambuco and also identified the species Eschweilera ovata as one of the species with the highest Importance Value. Pinto et al. (2018) in Igarassu, Pernambuco, evaluated the structure of a secondary forest fragment in the São José Plant and found lower values of VI, indicating a late succession, corroborating with the good state of conservation of the fragment evaluated in the present study.
In relation to the diameter distribution of the individuals in the study area, other works carried out on the same typology, as that of Araújo et al. (2015), Marchiori et al. (2016), Cysneiros et al. (2017), Lima et al. (2017) also showed a higher propo rtion of individuals in smaller diameter classes, indicating that it is a factor associated with the natural dynamics in multiannual forests, whose high number of regenerating individuals compensates for mortality over time (Dalla Lana et al. 2013).
As for the floristic diversity of the area, the results are similar to other fragments of the Atlantic Forest, such as 3.19 nats. ind.-1 (Araújo et al., 2015); 2.9 nats. ind.-1 (Pinto et al., 2018); and 3.19 nats. ind.-1 (Cordeiro et al., 2017). However, it is lower than those found by Campos et al. (2011), Lima et al. (2017) and Marchiori et al., (2016), who verified values of 4.05 nats. ind.-1; 4.0 nats. ind.-1 and 3.7 nats. ind.-1, respectively. This lower diversity when compared to the aforementioned works may be related to the initial successional stage of the remnant, where the structural complexity is smaller when compared to more advanced fragments in the process of ecological succession.
ecosystem.According to Ferreira et al. (2016), the behavior of the spatial distribution reflects the autochoric dispersion syndrome, which confers the aggregate behavior in early-stage populations and a random pattern in the more advanced stage of development.
5 CONCLUSIONS
The phytosociological analysis of the vegetation allowed to know the floristic composition and characterization of the horizontal structure of the remnant, where despite a diametric distribution tending to the inverted J, indicating that the forest is in the process of regeneration, a small number of species stand out over while others are scarce in the remnant, deserving prominence in the conservation of biological diversity, so that actions of inadequate management do not imply extinction.
With the exception of Byrsonima crassifolia that presented a random distribution in the fragment and the species Miconia
prasina and Myrcia splendens, the other species whose aggregation pattern was analyzed presented an aggregated spatial
distribution of the individuals. This fact allows to understand the behavior of these species, to subsidize projects that use them, aiming to recover degraded areas in the remainder studied, as well as to establish strategies for the conservation of florist ic diversity.
REFERENCES
Alvares, C.A. et al., 2013. Köppen’s climate classification map for Brazil. Meteorologische Zeitschrift, 22(6): 711-728.DOI: 10.1127 / 0941-2948 / 2013/0507
Alves-Costa, C.P. et al., 2008. Implementando Reflorestamentos com Alta Diversidade na Zona da Mata Nordestina: Guia Prático. Recife.
APG IV. 2016. An update of the Angiosperm Phylogeny Group classification for the orders and families of flowering plants: APG
IV. Botanical Journal of the Linnean Society, 181: 1-20.DOI:10.1111/boj.12385
Araújo, L.H.B. et al., 2015. Composição florística e estrutura fitossociológica de um fragmento de Floresta Ombrófila Densa no município de Macaíba, RN. Revista Agroambiente, 9(4): 455-464.DOI:10.18227/1982-8470ragro.v9i4.2441
Brito, A. et al., 2007. Comparação entre os métodos de quadrantes e PRODAN para análises florística, fitossociológica e volumétrica. Revista Cerne, 13(4): 399-405.https://www.redalyc.org/articulo.oa?id=74413408
Brummitt, R.K. and Powell, C.E., 1992. Authors of Plant Names: A list of authors of scientific names of plants, with recommended standard forms of their names, including abbreviations. Royal Botanic Gardens, Kew, England.
Campos, M.C.R., J.Y. Tamashiro, M.A. Assis and C.A Joly, 2011. Florística e fitossociologia do componente arbóreo da transição Floresta Ombrófila Densa das Terras Baixas - Floresta Ombrófila Densa Submontana do Núcleo Picinguaba/PESM, Ubatuba, sudeste do Brasil. Biota Neotropica, 11(2): 301-312.DOI:10.1590/S1676-06032011000200030.
Carvalho, F.A.C., Braga, J.M.A. and Nascimento, M.T., 2016. Tree structure and diversity of lowland Atlantic forest fragments: comparison of disturbed and undisturbed remnants. Journal of Forest Research., 27(3): 605-609. DOI 10.1007/s11676-015-0165-2
Chaves, A.D.G. et al., 2013. A importância dos levantamentos florístico e fitossociológico para a conservação e preservação das florestas. Agropecuária Científica no Semiárido., 9(2): 43-48. DOI:10.30969/acsa.v9i2.449
Colonetti, S. et al., 2009. Florística e estrutura fitossociológica em floresta ombrófila densa submontana na barragem do rio São Bento, Siderópolis, Estado de Santa Catarina. Acta Scientiarum. Biological Sciences, 31(4): 397-405. DOI:10.4025/actascibiolsci.v31i4.3345
Cordeiro, J.M.P., B.I Souza and L.P. Felix, 2017. Florística e fitossociologia em floresta estacional decidual na Paraíba, nordeste do Brasil. Gaia Scientia., 11(1): 01-16. DOI:10.21707/gs.v11.n01a01
Costa Junior, R.F. et al., 2008. Estrutura fitossociológica do componente arbóreo de um fragmento de Floresta Ombrófila Densa na mata sul de Pernambuco, nordeste do Brasil. Ciência Florestal., 18(2): 173-183.DOI:10.5902/19805098455
Cysneiros, V.C. et al., 2017. Distribuição diamétrica de espécies da Floresta Ombrófila Densa no Sul do Estado do Rio de Janeiro.
Pesquisa Florestal Brasileira., 37(89): 1-10.DOI:10.4336/2017.pfb.37.89.1070
Dalla Lana, M., et al., 2013. Distribuição diamétrica de Escheweilera ovata em um fragmento de Floresta Ombrófila Densa-Igarassu, PE. Floresta, 43(1): 59-68.DOI:10.5380/rf.v43i1.25252
Estes, J.A. et al., 2011. Trophic Downgrading of Planet Earth. Science, Nova York.DOI:10.1126 / science.1205106
Fajardo, C., C. Rosaly, F. Vieira, and W. Molina, 2015. Distribuição Espacial de Cattleya granulosa Lindl. Uma Orquídea Ameaçada de Extinção. Floresta e Ambiente., 22(2): 164-170.DOI:10.1590/2179-8087.073714
Feeley, K.J, et al., 2011. Directional changes in the species composition of a tropical forest. Ecology, 94(4): 871-882. DOI:10.1890/10-0724.1
Felfili, J. and M. Venturoli., 2000. Tópicos em análise de vegetação: Comunicações técnicas florestais. Universidade de Brasília, Brasília, DF, Faculdade de Tecnologia, 34 p.
Ferreira, P.I., et al., 2016. Estrutura populacional, padrão espacial e estoque de carbono em bracatingais no planalto sul catarinense. Floresta, 46(2): 227-234. DOI:10.5380/rf.v46i2.41584
Gris, D., L.G. Temponi and G.A. Damasceno Junior, 2014. Structure and floristic diversity of remnant semideciduous forest under varying levels of disturbance. Acta Botanica Brasilica, 28(4): 569-576.DOI:10.1590/0102-33062014abb3432.
Instituto Brasileiro de Geografia e Estatística (IBGE), 2018. Mapas de biomas e vegetação. Retrieved from http:// www.ibge.gov.br: on 08/13/2018.
Lima, R.B.A. et al., 2017. Estrutura fitossociológica e diamétrica de um fragmento de Mata Atlântica, Pernambuco, Brasil.
Revista Desafios, 4(4): 725-726. DOI:10.20873/uft.2359-3652.2017v4n4p143
Marchiori, N.M. et al., 2016. Tree community composition and aboveground biomass in a secondary Atlantic forest, Serra do Mar State Park, São Paulo, Brazil. Cerne, 22(4): 501-514.DOI:10.1590/01047760201622042242
Martins, S.V., 2012. Restauração ecológica de ecossistemas degradados. Viçosa: Editora UFV, pp: 293.
Mcguinnes, W.G. et al., 1934. The relationship between frequency index and abundance as applied to plant populations in a semi-arid region. Ecology, 16(1): 263-282.DOI:10.2307/1932468
Missouri Botanical Garden., 2018. Tropicos. Retrieved from http://www.tropicos.org on 08/13/2018.
Morris, R.J., 2010. Anthropogenic impacts on tropical forest biodiversity: a network structure and ecosystem functioning perspective. Phil. Trans. R. Soc. B, (1558): 3709-3718. DOI:10.1098/rstb.2010.0273
Mueller-dombois, D. and H. Ellenberg, 1974. Aims and methods of vegetation ecology. New York: Willey e Sons. 574.
Oliveira, L.S.B, et al., 2013. Phytosociology of the natural regeneration of a dense ombrophilous forest in Moreno, Pernambuco, Brazil. Brazilian Journal of Agricultural Sciences, 8(1):119-124.DOI:10.5039/agraria.v8i1a2097
Pielou, C., 1975. Ecological diversity. New York: Willey, pp: 165.
Pinto, A.V.F., et al., 2018. Floristic and structure of the arboral community of a regenerating fragment of Atlantic Forest , Igarassu, Pernambuco, Brazil. Revista Agroambiente, 12 (2): 145-155.DOI:10.18227/1982-8470ragro.v12i2.4871
Richards, W., 1996. The Tropical Rain Forest. Cambridge University Press, Cambridge, UK. 13(5): 775-776
R Development core team., 2018. R: a language and environment for statistical computing. R Foundation for Statistical Computing, Vienna, Austria. Retrieved from http://www.R-project.org
Sawczuk, A.R., et al., 2014. Alterações na estrutura horizontal, no período de 2002-2008, em Floresta Ombrófila Mista no centro-sul do estado do Paraná. Ciência Florestal, 24(1): 149-160.DOI:10.5902/1980509813332
Souza, A. and L. Soares, 2013. C.P.B. Florestas Nativas: estrutura, dinâmica e manejo. Editora UFV, pp: 322
Sturges, H., 1926. The choice of a class interval. Journal of the American Statistical Association, 21(153): 65-66.DOI:10.1080/01621459.1926.10502161
Turchetto, F., et al., 2017. Phytosociology as a tool for forest restoration: a study case in the extreme South of Atlantic Forest Biome. Biodivers Conserv, 26(2): 1463-1480. DOI:10.1007/s10531-017-1310-3
Vaidyanathan, S., 2010. Patterns of tropical forest dynamics and human impacts: Views from above and below the canopy.
Biological Conservation, 143(12): 2881-2890.DOI:10.1016/j.biocon.2010.04.027
Varella, T.L., et al., 2018. Estrutura populacional e distribuição espacial de Theobroma speciosum Willd. Ex Spreng no norte do Estado de Mato Grosso. Ciência Florestal, 28(1): 115-126.DOI:10.5380/rf.v46i2.41584