X- Ray mass attenuation coefficients for mixture of some 3d elements
Fe
100-x _Al
xand
Cu
100-x–Al
x1
Farid M. Mohammed,
2Raed N. Razooqi,
3Muataz A. Majeed,
4Y K. Vijay,
4Subodh Sirvastava
1
Department of physics, College of Science, University of Tikrit, Iraq.
2Department of Mechanical Engineering/College of Engineering, University of Tikrit.
3Department of physics, College of Education, University of Tikrit, Iraq
4Department of Physics, University of Rajasthan, Jaipur, India.
Abstract: In this paper we study the mass attenuation coefficients for (Fe100-x Al x, Cu100- x Alx)
Mixtures with different weight ratios. These mixtures were prepared by mixing the Fe and Cu With different concentration of Al (x = 10-50) using ball milling technique. The mass attenuation coefficients (µm) were measured by self attenuation of X-rays at the energy of 30 keV. The Gamma
rays emitted from Am- 241 source were used to excite the mixture samples and emitted K α and K β X-ray lines were counted by a Silicon drift (SDD) detector with a resolution of 150 eV at 6.4 keV. The samples have also been characterized by SEM and (EDXRF) measurements. The obtained results were compared with theoretical values and are agreement with theoretical results.
Key words: Mass attenuation coefficient, X-ay fluorescence, 3d transition elements, scanning electronic microscope (SEM), EDAX.
INTRODUCTION
The X-Ray Fluorescence (XRF) become a powerful and versatile technique to analysis and characterization of materials(R. Novelline.1997)(Chilton et al.,1984).The information gained by experimental values of K α and K β X-ray production and cross sections have a wide use and applications(Rene, E. Grieken and Andzerj Markowski.1993). Accurate values of mass attenuation coefficients are essential when quantifying the interactions of an X-ray beam with matter. They are functions of both the photon energy and the physical properties of the irradiated material, The mass attenuation data used in Bremsstrahlung spectra model, exposure and dose calculations (W. Herman.1994). The mass attenuation compilations do not however cover every energy value in the energy ranges normally presented. To interpolate values for the mass attenuation coefficients for energies of interest, other than those tabulated, the compiled data are often fitted utilizing least-square techniques and appropriate mathematical expression (S.M. Seltzer., J.H., Hubbell.1995)(J.H. Hubbell and S.M.Seltzer.1996).When a beam of x-ray photons passes through attenuated material, each photon in the beam either doesn't react with the medium material at all or it reacts by absorption and scattering reactions. Due to the removal of photons from the beam, it will suffer attenuation, such attenuation may be intensity attenuation or energy attenuation, and such that the intensity or the energy decreases along the path it passes through this medium. Not all vacancies causes the production of characteristic X-ray photons since there is a competing internal rearrangement process known as the Auger effect (I. Rodr´iguez, Cabo.2005 ). The ratio of the number of vacancies resulting in the production of characteristic X-ray photons to the total number of vacancies created in the excitation process is called the fluorescent yield.
Fluorescent yield values are several orders of magnitude less for the very low atomic numbers. In the literature description of mixtures of elements, it is standard practice to assume that the contribution of each element to the attenuation is additive. This assumption yields the well known mixture rule which gives the attenuation coefficient of any substance as the sum of the appropriately weighted contributions from the individual atoms. Mass attenuation and energy absorption coefficients are widely used in the study of interaction of γ-rays with matter. Many measurements have been reported (O. Icelli., S. Erzeneoglu and B. Gurbulak,2005)( A. Khanna et al,1996)( M. Ertuˇgrul,1997)( I. celli Orhan and Salih Erzeneoˇglu,2004). Further advances on the conventional modes of these techniques especially related to the formation of exciting micro beams (X-ray or ion beams) provided elemental mapping capabilities down to the few parts per million concentration regime, enhancing considerably the applicability of the ion-beam- and X-ray spectrometry- based techniques into the cultural-heritage related studies (K. Janssen's et al.,2000)( A. Von Bohlen et al.,2007)( B. Constantinescu et al.,2008)( N. Grassi et al.,2007)( M.J., Berger and Hubbell, S. H.,1987). In present paper we study the mass attenuation coefficients (µm) for mixture some 3 d transition elements ( Fe100-x –Al x, Cu100-x
Al x ) with different weight ratio by self attenuation method using X-ray fluorescence. The sample mixtures
X-ray photon and the atomic number Z of the excited element (equation 2) was first established by Moseley (M. A. B. Witaker.,1999).
(2)
In which K is a constant that takes on different values for each spectral series, σ is the shielding constant that has a value of just less than unity. The wavelength of the X-ray photon is inversely related to the energy E of the photon according to equation 3.
λ ο= (3)
Thus the mass attenuation coefficient 4m is given by :-
µm= (4)
where w i is the proportion by weight, 4 is the linear attenuation coefficient in cm-1, ρ (g/cm3) is the density of
element and 4m (cm2/g) is the mass attenuation coefficient of constituent element i of the compound. The mixture rule is valid when the effects on the atomic wave function of molecular bonding and chemical or crystalline environment are negligible. However, the μ/ρ value for an element in a compound may vary substantially for incident photon energies that lie above the element’s absorption edge. The µm values are also
believed to be affected by the chemical, molecular and thermal environments. These phenomena lead to the deviation of the experimental µm value from that of the theoretical value, since the calculation of the theoretical
value has been done by considering the cross-section of an isolated atom. This deviation is termed as the breakdown or the no validity of the mixture rule.
3.Experimental:
3.1 Materials and Sample Preparation:
In the present work the sample mixtures of Fe100-x Al x and Cu100-x Al x were prepared by mixing the Fe and
Cu with Al in weight ratio x= 10%, 20%, 30%, 40% and 50%. The high purity (99.9-99.99 %) fine powder of Al, Cu and Fe were obtained from Sigma Aldrich. The mixing has been done using ball milling (Planetary Ball Mill PM100) contained stainless steel container (volume about 75 cm3) and stainless steel ball having a diameter of 10 mm. We put the sample powder (Fe100-x Al x and Cu100-x Al x) separately in ball milling container
with ball to powder ratio 10:1 in argon atmosphere. The rotation speed of mill was 250 rpm and milling time, followed by 4hr further grinding with postal mortar.
3.2 Characterization:
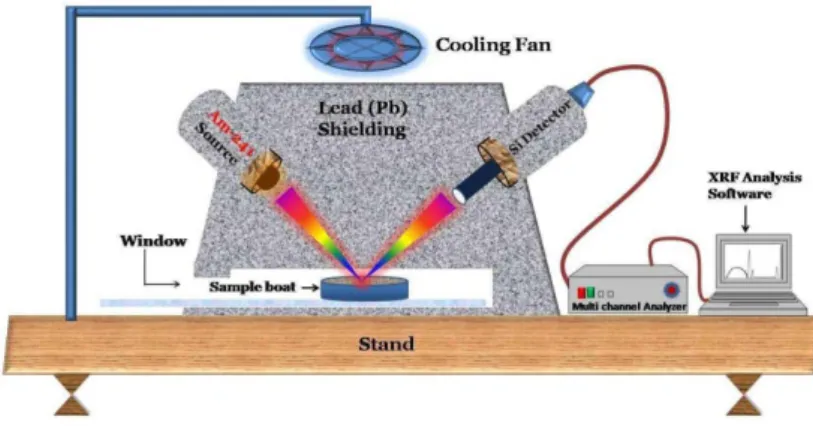
The mass attenuation coefficients were determined by measuring of X-rays fluorescent emitted through sample mixture of known thickness. The experimental arrangement is shown in Fig. 1. The sample mixtures were irradiated with 30 keV X-rays obtained from the Am 241 (40 mCi) annular source. The emitted K-line X-rays fluorescents were collimated by the lead collimator shielded with aluminum and iron to fall on samples. These sample mixture was put in circular ring having various thicknesses (0.5- 1.5) mg/cm2. The X-rays fluorescent was recorded with help of silicon drift detector (SDD) connected to the Fast Comtech multi channel analyzer card. The distance between sample to source was 15mm same as the distance between sample to detector with an angle 90o as shown in Fig.1. Total mass attenuation coefficient, µm (cm2/g) of mixtures were
Fig. 1: The experimental setup.
(5)
Where t (mg/cm2) is the thickness of sample, I and Io are area under the peak (K α and Kβ) for the mixture and pure elements (i.e. Fe, Cu) respectively. The µm values obtained experimentally was compared with the
theoretical values obtained by Xcom software [16]. The relative difference (RD) between the experimental and theoretical values has been calculated by equation 6.
(6)
The samples have also been characterized using Scanning Electron Microscopy (Zeiss, Germany) and EDAX analysis.
RESULT AND DISCUSSION
4.1 Mass Attenuation Coefficient (µm):
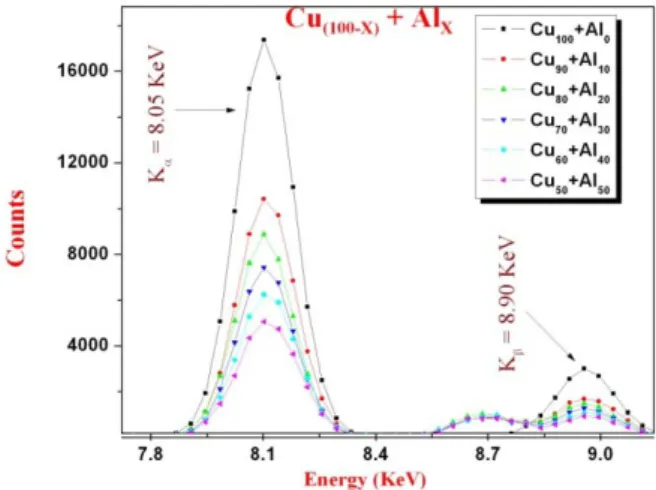
The Fig.2and Fig.3 show the XRF measurements for pure Fe and pure Cu with different weight ratio of Al (10%, 20%, 30%, 40% and 50%). These figures clearly indicate the K α and K β X-ray energy peaks for pure Fe and pure Cu have been appeared at 6.4 KeV and 7.05 and 8.08 KeV and 8.9KeV respectively with higher Intensity. It was observed that for mixture samples intensity of these K α and K β X-ray energy peaks was decreased as the concentration of Al increased.
Fig. 2: Shows the X-ray fluorescence plots for Fe100-x Al x mixtures.
We have calculated the mass attenuation coefficient (µm) for these mixtures by Eq. 6 and it was observed
that in case of Fe100-x Al x µm is linearly increased as the Al concentration increased in Fe mixture while for
Cu100-x Al x the µm decreased as the Al concentration increased. The experimental and theoretical plots of µm
Fig. 3: Shows the X-ray fluorescence plots for Cu100-x Al x mixtures.
Fig. 4: Shows the experimental and theoretical plot between mass attenuation coefficient (µm) and Al
concentration for Fe100-x Al x mixtures.
These measured experimental values of µm have been compared with theoretical values by Xcom software
and have good agreement. The increased values of µm in case of Fe mixture may be attributed to the higher
absorption X-ray fluorescence due to presence of Al in mixture. We may assumed that when pure Fe is exposed with incident X-ray then it emits the X-ray fluorescence and hence behaving as source which detected by the detector. As we know that K α and K β X-ray energy for Al is less 1.4 8 KeV and 1.55 KeV respectively and its density is also less in comparison to the pure Fe, therefore in mixture the absorption of X-ray fluorescence emerged from Fe is high therefore been detected which gives the high attenuation then pure Fe. The calculated µm for Fe-Al mixture has been shown in table 1.
In case of Cu100-x Al x mixture we observed just inverse behavior as compared to Fe100-x Al x mixture that the
µm is continuously decreased as the Al concentration increased in Cu mixture as shown Fig. 5. It may assumed
that in Cu100-x Al x mixture the Cu is a secondary source of X-ray with higher K α and K β X-ray energy at 8.0
KeV and 8.9 KeV (Fig. 3), so this energy is sufficient to interact and eject the electron form inertial shell of Al which gives the higher fluorescence and hence less attenuation. The calculated µm for Cu-Al mixture has been
shown in table 2.
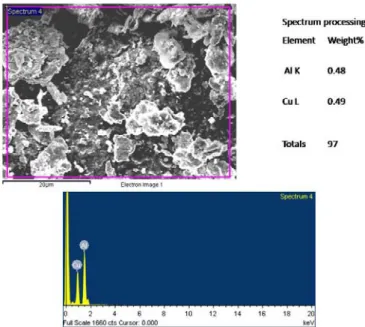
4.2 Scanning Electron Microscopy (SEM):
The Fig. 6 and Fig. 7 show the SEM images for Fe50Al50 and Cu50Al50 mixtures. These images show that
Fig. 5: Shows the experimental and theoretical plot between mass attenuation coefficient (µm) and Al concentration for Cu100-x Al x mixtures.
Table 1: Shows the calculated experimental and theoretical mass attenuation coefficient (µm) for Fe100-x Al x mixtures.
Samples Weight ratio µm
Experimental
µm
Theoretical
Percentage error
Fe+Al 90%+10% 86 87.89 0.021
Fe+Al 80%+20% 89.92 90.93 0.011
Fe+Al 70%+30% 92.05 93.98 0.02
Fe+Al 60%+40% 98.12 97.02 0.011
Fe+Al 50%+50% 101.25 100.1 0.011
Table 2: Shows the calculated experimental and theoretical mass attenuation coefficient (µm) for Cu100-x Al x mixtures.
Samples Weight ratio µm
Experimental
µm
Theoretical
Percentage error
Cu+Al 90%+10% 54.12 52.33 0.034
Cu+Al 80%+20% 53.32 52.11 0.023
Cu+Al 70%+30% 52.14 51.88 0.005
Cu+Al 60%+40% 50.25 51.66 0.027
Cu+Al 50%+50% 50.01 51.44 0.027
Fig. 7: The SEM image with EDAX analysis for Cu50Al50 mixture.
REFERENCES
Berger, M.J. and S.H. Hubbell, 1987. NBSIR87-25397 XCOM. "Photon Cross Sections on A personal Computer ", National of Standards Technology ,Gaithersburg, MD,USA.
Berlin, W.R., Leo, 1987. "Techniques for Nuclear and Particle Physics Experiments”, Springer- Verlog. Celli Orhan, I. and Salih Erzeneoˇglu, 2004. J. Quant. Spectroscopy. Radiate. Transfer, 88: 519.
Chilton, A.B., J.K. Shultis and R.E. Faw, 1984. "Principles of radiation shielding", Prentice-Hall, Inc., New Jersey.
Constantinescu, B., R. Bugoi, V. Cojocaru, M. Radtke, T. Calligaro, J. Salomon, L. Pichon, S. Rohr's., D. Ceccato, Oberlander E. Tarnoveanu, 2008. Nucl Instr Meth Sect., B 266: 2325-2328.
Ertuˇgrul, M., 1997. J. Rad. Nucl. Chemistry, 219: 111.
Grassi, N., L. Giuntini, P.A. Mando, M. Massi, 2007. Nucl Instr Meth Sect., B 256: 712-715. Herman, W., 1994. World scientific publishing synchrotron Radiation sources-A premier.
Hubbell, J.H. and S.M. Seltzer, 1996. Tables of X-ray Mass Attenuation coefficients and mass energy-absorption coefficients from 1 keV to 20MeV for Elements Z=1–92 and 48 Additional Substances of Dosimetric Interest, National Institute of Standards and Technology, US Department of Commerce, Gaithersburg, MD 20899.
Icelli, O., S. Erzeneoglu and B. Gurbulak, 2005. J. Quant. Spectroscopy. Radiate. Transfer, 90: 399.
Janssen's, K., G. Vittiglio, I. Deraedt, A. Aerts, B. Vekemans, L. Vincze, F. Wei, I. de Ryck, O. Schalm, F. Adams, A. Rindby, A. Knochel, A. Simionovici, A. Snigirev, 2000. X-ray Spectrum, 29: 73-91.
Khanna, A.S., S. Bhatti, K.J. Singh, 1996. Nucl. Instrum. Methods, 114: 217.
Novelline, R., 1997. "Squire's Fundamentals of Radiology". Harvard University Press. 5th edition. ISBN 0-674-83339-2 p. 1.
Rene, E. Grieken and Andzerj Markowski, 1993. New York Handbook of X-ray spectrometry: Methods and Techniques. Marcel Dekker, Inc., pp: 453.
Rodr´iguez, I., Cabo. 2005. Thesis. El Proyecto Pierre Auger Como Granja Solar Photovoltaic a.
Seltzer, S.M., J.H. Hubbell, 1995. Tables and graphs of photon mass energy absorption coefficients for photon energies 1 keV to 20MeV for Z=1–92 and some dosimetric materials, Appendix to invited plenary lecture by Hubbell, J.H., 45 Years (1950–1995) with X-ray Interactions and Applications, Presented at the 51st National Meeting of the Japanese Society of Radiological Technology, April 14–16, Nagoya, Japan.
Sewell, S., 2007. 8.13 course reader.
Von Bohlen, A., S. Rohr's, J. Salomon, 2007. Anal Bioanal Chem., 387: 781-790.