POLICY BRIEF
June 2014
CWED
Ten Dollars or Thirteen Dollars?
Comparing the Effects of State Minimum Wage
Increases in California
by Sylvia A. Allegretto, Michael Reich and Rachel West
Sylvia A. Allegretto, Ph.D., is an economist and co-director of the Center on Wage and Employment Dynamics at the Institute for Research on Labor and Employment, University of California, Berkeley. Michael Reich is Professor of Economics and Director of the Institute for Research on Labor and Employment, University of California, Berkeley.
Rachel West, M.P.P., is a senior policy analyst at the Center for American Progress in Washington, DC, and a researcher at the Institute for Research on Labor and Employment, University of California, Berkeley.
We are grateful to Annette Bernhardt, David Cooper, David Graham-Squire, Ken Jacobs, and Laurel Lucia for their assistance and advice. We thank the Ford Foundation and the University of California for financial support.
Introduction
In September of 2013, California Governor Jerry Brown signed Assembly Bill 10 into law. AB10 increases California’s minimum wage—which has stood at $8 per hour since 2008—to $9 on July 1, 2014, and to $10 on January 1, 2016. Some policymakers regard the modest increase provided by AB10 and the absence of annual adjustments for price increases as insufficient for the wellbeing of the Golden State’s lowest-paid workers. Indeed, for the first time in the state’s history a new minimum wage proposal— Senate Bill 935 sponsored by Senator Mark Leno—has been introduced in the legislature before the implementation of the already-legislated minimum wage increase (AB10). Senator Leno’s bill would increase California’s wage floor in several steps to reach $13 in January 2017, and annual cost of living adjustments would begin in 2018.
California is not alone in implementing or considering minimum wage increases this year. Thus far in 2014 thirty eight states have considered minimum wage bills and eight states and Washington, DC have enacted new increases (NCSL 2014). Some states and cities have already enacted minimum wage standards that exceed $10. A number of California cities are currently contemplating citywide increases: $15 in San Francisco, $13 in Richmond, $12.53 in Berkeley, $12.50 in Oakland, and $11.50 in San Diego.
While minimum wages of $10 to $15 are appearing for the first time in the U.S., when adjusted for in-flation or compared to median wages they are not outside of previous experience (Dube 2014). The $10 minimum wage of AB10 represents just under 50 percent of the median full-time wage in California— less than the 55 percent ratio that held in the U.S. as a whole in the late 1960s, and about the same percentage as in European countries with a statutory minimum wage today. A fully implemented SB935 would be only modestly higher than the federal minimum wage in 1968. Its ratio to the median wage would be 58 percent, less than the ratio in many U.S. states in the 1960s and well below the equivalent percentage in the Nordic countries today. Nonetheless, it is important to ask: What are the implications of such double-digit minimum wages in California today?
In this report we compare the effects of $10 (AB10) and $13 (SB935) minimum wage levels in Cali-fornia. We show that AB10 restores some of the ground lost by low-paid workers in recent years, but it maintains the inflation-adjusted minimum wage at about the same level as in 1988. The Leno bill, SB935, goes much further, raising the real minimum wage to just above the peak value obtained in 1968. Between 2014 and 2017, the aggregate increase in earnings accrued by affected workers will total about $8.2 billion for the $10 minimum wage bill and $22.5 billion for the $13 minimum wage proposal. We also analyze the effects of each minimum wage scenario on California’s businesses and on California’s state budget.
We find that California’s businesses are likely to absorb the increased labor costs of either minimum wage largely with offsets from increased worker productivity, from declines in recruitment and retention costs, and with small price increases in the restaurant industry (the industry most affected by minimum wage increases).
Unlike previous minimum wage impact studies, we pay particular attention to the effects of each mini-mum wage proposal on the state’s budget. Increased wage income will generate substantial income and
sales tax revenue for California during 2014-17: approximately $444 million under AB10 and $2.62 billion under SB935. On the spending side, Medi-Cal costs will fall by about $562 million under AB10 and $1.54 billion under SB935, while increased wage costs for state-supported home care workers and developmentally disabled service workers will total about $400 million (AB10) and $2.04 billion (SB935). Increased revenues less increased outlays will total about $585 million (AB10) and $2.15 billion (SB935).
The report proceeds as follows. In Section 1 we document trends in the distribution of wages in Cali-fornia since 1979, present the history of the state’s minimum wage, and illustrate its importance to the state’s lowest-paid workers. In Section 2 we discuss the effects of AB10 and the proposed SB935 on workers in the state, and analyze each proposal’s impact by demographic group and family status. Section 3 examines the cost impacts on businesses and discusses how businesses are likely to absorb these costs. Section 4 discusses how each of the two minimum wage paths will affect the state’s economy and the state’s budget. Here we address state tax revenue increases, savings in state Medicaid costs, and increased wage costs to California for developmentally disabled and in-home care support service workers. Section 5 concludes.
Main findings:
• For the bottom half of the workforce, real hourly wages today are 6.7 percent lower than in 1979. • AB10 will restore some of this lost ground but does not advance beyond it, while SB935 will raise
pay standards beyond recent levels.
• In today’s dollars, the minimum wage under AB10 will peak at $9.54 in 2016 and will erode back to $8.00 by 2023.
• SB935 will peak at $12.11 in today’s dollars and annual adjustments will prevent erosion thereafter.
• AB10 would increase pay for about 21.8 percent of California’s workforce; the comparable figure for SB935 is 35.2 percent.
• The workers affected by AB10 and SB935 are primarily adults, and are likely to live in families with annual incomes below the state’s median household income.
• Among workers who would experience a raise under either AB10 or SB935, about 56 percent are at least 30 years old and more than 61 percent are full-time workers.
• Over half the workers receiving increases under either minimum wage proposal are Hispanics. • SB935 would help more working families make ends meet than would AB10:
• Approximately one in five children in California have at least one parent who will be affected by AB10; one in three (32.1 percent) have a parent who would be affected by SB935.
• Workers who would get a raise due to AB10 contribute 49.5 percent, on average, to overall family income. The corresponding figure for SB935 is 55.9 percent.
• By 2017, AB10 would provide about an additional $8.2 billion in wages to low-wage workers, while SB935 would increase total wages by about $22.5 billion.
• The most affected industries under both proposals are leisure and hospitality, retail, and agriculture.
• Businesses will adjust primarily through increased worker productivity, through savings on employee turnover costs, and through price increases among restaurants.
• California’s overall budget would realize net gains of about $585 million under AB10 and $2.15 billion under SB935 over the period 2015 to 2017.
• Some Medi-Cal enrollees would be shifted from coverage under “traditional” Medi-Cal (for which California pays 50 percent of costs) to Medi-Cal under the Medicaid expansion and healthcare subsidies of the Affordable Care Act (both of which are primarily federally financed).
• From 2015 to 2017 (inclusive), these cost shifts would save California taxpayers a total of $542 million (in 2013 dollars) under AB10, or $1.54 billion under SB935.
• Taxpayer savings between 2015 and 2017 on CalFresh, California’s name for the federal food stamp program, would total about $516 million under AB10, or $1.64 billion under SB935 (both in 2013 dollars). Under AB10 the federal savings on CalFresh would nearly offset the increased federal spending on Medi-Cal due to the cost shift noted above. Savings would more than offset this spending under SB935.
• California would experience increased costs for In-Home Supportive Services (IHSS) and Department of Developmental Services (DDS). Between 2015 and 2017 (inclusive), these costs would total about $400 million under AB10, and $2.0 billion under SB935.
1. California’s Wage Trends and Minimum Wage History
The Wage Distribution: Recent Trends
We focus on two important wage trends in California. First, wages for over half of California’s workers are lower today than they were 35 years ago. Second, wage inequality has grown substantially over the same time period. The extent of economic inequality and its increase over time have risen to the fore-front of public attention. In what follows, we briefly analyze trends in earnings and economic inequality through the lens of hourly wages.
Over the last 35 years, wage growth in California has varied considerably across the wage scale. Figure 1 tracks wage growth by percentiles of the earnings distribution for two periods: over the past three and a half decades (1979-2013) and over the past decade alone (2003-2013). The figure shows that after accounting for inflation, wages grew only for those close to the top of the earnings distribution. Since 1979, only those above the 60th percentile (that is, those who have earnings higher than 60 percent of other workers) have experienced real wage gains compared to their counterparts. Hourly wages for high earners—those at the 95th percentile—grew 47.4 percent from 1979 to 2013, from $42.37 to $62.45. On the other hand, wages for typical workers (at the median) and lower-paid workers were lower in 2013 compared to 1979. Earnings of the lowest-paid workers (the 10th percentile) in California have fallen from $9.26 to $8.58 (in 2013 dollars), representing a decline of 7.4 percent compared to their counterparts in 1979.
-7.4%
-9.6% -9.2%
-4.8% -2.4%
0.3%
6.7%
18.2%
32.3%
47.4%
-4.4%
-7.1% -6.7% -5.3% -7.2% -5.6%
-2.8%
1.3%
5.1%
11.7%
-20% -10% 0% 10% 20% 30% 40% 50%
10th 20th 30th 40th 50th
(Median) 60th 70th 80th 90th 95th
Figure 1: Wage growth in California: 1979-2013 and 2003-2013
1979-2013 2003-2013
Source: Authors' analysis of Current Population Survey data for workers aged 18-64.
Real wages over the past 35 years have fallen for most of the state’s workers, yet during this period worker productivity nearly doubled in the U.S. (BLS 2014). The majority of California’s workers thus have not benefited from increased productivity and economic growth.
Figure 1 also depicts California’s pay trends over the past ten years. From 2003 to 2013 real wages fell for all workers except those above the 80th percentile. The problem of falling real wages has thus be-come even more widespread in the past decade.
California’s Minimum Wage in Recent Years
Although the Fair Labor Standards Act of 1938 instituted the first federal minimum wage, California did not adopt a minimum wage higher than the federal level until 1988—as is depicted in Figure 2 by the solid red line. With federal increases in the early 1990s, the state’s wage floor reverted to the federal level for several years, but has been higher than the federal minimum wage since 1998.
Because the federal minimum wage (shown in Figure 2 by the solid black line) is not indexed to the rate of inflation, its value exhibits several long periods of decline. Clearly, California’s higher minimum wage—although not indexed, either—has kept the state’s wage floor from eroding as much as the federal
floor. However, California’s average minimum wage, when adjusted for inflation, has remained relatively flat since 1998. As a result, while purchasing power has not declined for California’s minimum-wage workers, those workers are no better off than they were a decade and a half ago.
Figure 2 also shows that the state’s wage floor is binding for its lowest-wage workers—the trend in the tenth percentile wage (dotted green line) closely tracks the state’s minimum wage. Without the higher state floor, pay at the 10th percentile would likely have declined much further, and been closer to the federal minimum. The two state minimum wage increases between 2003 and 2013 have mitigated the fall of the 10th percentile wage reported in Figure 1.
AB10 and SB935
As noted above, the first phase of AB10 will increase the state minimum to $9 per hour on July 1, 2014. The second and final step to $10 is slated for January 1, 2016. Senator Leno’s proposed SB935 would increase the wage floor from $9 to $11 on January 1, 2015, with subsequent increases to $12 and $13 on the same days in 2016 and 2017, respectively. SB935 would also index the minimum wage to the rate of inflation starting in 2018, such that the minimum wage would change to match the cost of living on January 1 of each year thereafter.
$0.00 $2.00 $4.00 $6.00 $8.00 $10.00 $12.00 $14.00
Figure 2: California's minimum wage history with projections for AB10 (to $10) and SB935 (to $13)
California Minimum Wage Federal Minimum Wage AB10
SB935
California 10th Percentile Wage
Note: All data in 2014 dollars, adjusted using California-specific Consumer Price Index for All Urban Consumers (CPI -U), as published by the Department of Industrial Relations, Division of Labor. Projections assume an annual average inflation rate of2.4%.
Projections $12.11
Figure 2 shows the phase-ins and forecasted real values for AB10 and SB935 along with the federal minimum. The data in the figure are in today’s (2014) dollars with a future inflation assumption of 2.4 percent (the annual average for the state over the past decade). Without any change, the federal mini-mum will continue to decline in real terms, falling to approximately $5.72 (in 2014 dollars) by 2024. Although AB10 has been touted as the state’s first double-digit wage floor, the phase-in time frame and likely inflation mean that it will not actually reach $10 in 2014 dollars. Rather, as Figure 2 shows, AB10 will peak at $9.54 in today’s dollars (dashed yellow line). The buying power of the wage floor is expected to return to today’s $8 level around 2023 or 2024. In the interim, as the purchasing power of the mini-mum wage declines yet again, the state will likely once again debate the merits of another wage increase. AB10, while much improved relative to current federal policy, represents a modest and temporary increase in the wage of California’s lowest-paid workers. AB10 ultimately keeps the wage floor where it has remained for the past several decades—a very low bar given increases in worker productivity and economic growth.
SB935, under which the minimum wage would eventually increase to $13, also overstates the increase in today’s dollars: given its phase-in schedule, its real value will also be eroded by inflation. In today’s dollars, the minimum wage under SB935 would peak at approximately $12.11 after the final phase-in occurs in 2017 (dashed blue line). However, SB935 would increase the state’s wage floor to just above its 1968 historical peak. As indicated in Figure 2, indexation would prevent any erosion from that point onward.
2. Effects on California’s Workers and Families
Minimum wage increases directly affect workers who are currently paid less than or equal to the new minimum wage; these workers are legally entitled to a pay increase under the law. Minimum wage increases also affect many workers who earn at or slightly above the new wage floor (“indirectly affected workers”). The top row of Table 1 displays the proportion of workers who would be affected directly and indirectly by the AB10 and SB935 proposals. About 21.8 percent of the state’s workers will realize pay increases after AB10 is fully implemented in 2016. By contrast, about 35.2 percent will receive pay increases if SB935 becomes law and is fully implemented in 2017.1
The second row of the table shows that 3.3 million workers would receive increases under AB10, com-pared to 5.4 million under SB935. The third row indicates the average annual wage increase for affected workers under each wage floor. AB10 would lead to an average pay increase of about $844 per affected worker, while the more expansive SB935 would lead to a much larger increase—approximately $1,316 per affected worker. From 2014 to 2017 the aggregate wage increase due to AB10 and SB935 would amount to $8.2 billion and $22.5 billion, respectively.
1Further detail is provided in Appendix Table A1. Our results on wage increases are based on the Current Population
Table 1: Summary of minimum wage effects on workers and their families after full implementation1
AB 10 SB 935
Percent of all workers who are affected 21.8% 35.2%
Number of workers affected 3.3 million 5.4 million
Average annual wage increase per affected worker $843.9 $1,316.6 Aggregate increase in wages (2014-2017, inclusive) $8.2 billion $22.5 billion
All affected workers 49.5% 55.9%
Affected parents only 58.6% 64.5%
All workers 17.6% 22.5%
Parents only 23.2% 29.1%
Note: Data in 2013 dollars.
1 Full implementation for AB10 occurs in 2016; full implementation for SB935 occurs in 2017.
Average contribution to family income among:
Proportion of affected workers who are sole earners
Minimum wage workers contribute significantly to total family income. As reported in Table 1, the average contribution to total family income by workers affected by AB10 is 49.5 percent; among work-ers who are parents this figure climbs to 58.6 percent. The respective contributions of those affected by SB935 are greater: 55.9 percent across all affected workers, and 64.5 percent for working parents. Table 1 also reports the share of affected workers who are the sole breadwinners in their families: 17.6 percent (22.5 percent) of all workers affected by AB10 (SB935) are the only earners in their families. Among affected parents, the share of sole earners is 23.2 percent (29.1 percent) for the $10 ($13) wage floors. Moreover, nearly one in five of California’s children have at least one parent who will be affected by AB10. That figure would jump to nearly one in three if the state were to implement a $13 minimum wage under SB935. A higher wage floor would thus help many low-income families and their children.
Demographics
The workers affected by minimum wage hikes in California form a diverse group. Figure 3 illustrates the demographic composition of workers affected by each of the wage bills. The effects of AB10 and SB395 on men and women would be similar, as the top-left panel of Figure 3 shows. A commonly held but incorrect belief is that minimum wage workers are predominately teenagers. In fact, the majority of workers who would receive higher pay because of a minimum wage increase are prime-age adults with a strong connection to the labor force. As the panel on age in the figure shows, over half (56.4 percent) of those affected by a $13 wage floor are at least 30 years old. Only 6.7 percent are teens; close to double that share are 55 years old or older. The age distribution is similar for AB10. In both cases the majority
0% 5% 10% 15% 20% 25% 30% 35% 40% Teenagers
16-19 20 to 29 30 to 39 40 to 54 55 and older
Age 0% 10% 20% 30% 40% 50% 60% 70%
Part time (< 19) Mid time (20-34) Full time (35+)
Hours status 0% 5% 10% 15% 20% 25% 30% 35% 40% Less than
$20,000 $20,000-$39,999 $40,000-$59,999 $60,000-$74,999 $75,000-$99,999 $100,000-$149,999 $150,000or More Family income 0% 10% 20% 30% 40% 50% 60% 70% Single
parent Marriedparent Married,no kids Unmarried,no kids
Family composition
0% 10% 20% 30% 40% 50% 60% Female Male Gender 0% 10% 20% 30% 40% 50% 60% 70%
White Black Hispanic Asian
Race/ethnicity
Figure 3: Demographic distributions of affected workers for AB10 and SB935
AB10 SB935
of workers affected work at least 35 hours a week—56.1 percent and 61.4 percent for AB10 and SB935, respectively.
Hispanic workers are more affected than other race/ethnicity groups: 58.4 percent and 55.0 percent of the aggregate earnings increases under AB10 and SB935, respectively, would go to Hispanic workers. The impacts by family income and composition are also similar under both minimum wage levels. Two out of every three families that would benefit from either proposal have family incomes below the medi-an household income in California ($58,328 in 2012, the most recent year for which data is available). About 70.4 percent of workers affected by an increase to $10, and 67.7 percent of workers affected by the $13 proposal, come from families with incomes below $60,000. Many affected workers are parents who, as noted above, contribute significantly to their families’ total incomes. Of those affected, 29.8 percent (31.4 percent) for a $10 ($13) minimum wage are parents.
In summary, affected workers would be similar under AB10 and SB935. In each case, well over half are at least 30 years old and a majority is Hispanic. Most are full-time workers with family incomes below $60,000, and approximately 30 percent have children.
3. Effects on California’s Businesses
Employment: Evidence from State and Federal Minimum Wage Laws
Much of the debate on minimum wage effects has historically focused on possible job losses. But previously accepted notions of disemployment effects due to minimum wages have been seriously questioned by recent research. Studies, such as Neumark and Wascher (2008), found disemployment effects used federal and state variation over time in minimum wages to study minimum wage effects. But these studies did not adequately account for other differences between the states that raised their minimum wages and those that did not. As a result of this bias, studies such as Neumark and Wascher’s turned out to predict employment losses even two years before a minimum wage increase was implemented (Dube, Lester and Reich 2010). But when their research design is augmented to statistically compare nearby areas, the results were very different.
Allegretto, Dube, Reich and Zipperer (2013) looked at every major state and federal minimum wage increase (over 200 in all) in the U.S. between 1990 and 2012. The authors compared employment in nearly 400 pairs of adjacent counties that were located on different sides of a state border with a mini-mum wage difference. Comparing the employment trends of the most affected groups—teens and restaurant workers—across adjacent counties with different minimum wage levels provides an attrac-tive research design: neighboring counties are likely to be very similar to one another. This study finds no statistically significant effects of minimum wage increases on either employment or hours worked in restaurants and other low-wage industries, controlling for a range of regional and local differences that previous research did not include.2
2Neumark, Salas and Wascher (2013) question whether nearby areas make good control groups. Allegretto et al. (2013)
find their critique is without merit. The Congressional Budget Office (2014) states that a national minimum wage of $10.10 would increase pay for 24 million workers but eliminate 500,000 jobs. The CBO job loss figure is based on an assumption
Belman and Wolfson (2014) provide the most extensive recent summary of the minimum wage research literature. Drawing in large part on recent research, they conclude that minimum wage employment effects in the U.S. are “both vanishingly small and not statistically significant in even the most generous test” (p. 168). A separate review of minimum wage research by Schmitt (2013) similarly finds “the mini-mum wage has little or no discernible effect on the employment prospects of low-wage workers.”
In summary, studies that use credible research designs find that minimum wage mandates in the range implemented to date do not have a statistically significant negative effect on employment or hours worked.
What, then, are the implications of these studies for the minimum wage levels proposed in AB10 and SB935? The minimum wage in 2012 (the most recent year in previous studies) in the state of Washing-ton was already $9.32 (in 2013 dollars) and the highest of any state. San Francisco’s minimum wage in 2012 ($10.77 in 2013 dollars) was higher than Washington’s. Hence the findings in Allegretto et al. (2013) would appear to apply to a $10 minimum wage.
SB935, which peaks at $12.11 in today’s dollars, also falls below San Francisco’s effective minimum
compensation. In 2008 San Francisco implemented an employer health care spending mandate of about $1.50 (in 2013 dollars) as well as a universal paid sick leave mandate that costs employers about 40 cents per hour. These additional mandates raise San Francisco’s current minimum compensation to well over $13. As Dube, Naidu and Reich (2014) and Colla, Dow and Dube (2014) show, restaurant employ-ment between 2008 and 2012 nonetheless did not exhibit negative effects due to the wage mandates. While these two studies suggest that SB935 remains within the range of moderate minimum wage increases that do not lead to disemployment effects, some caution is called for. Living costs and the median wage are considerably higher in San Francisco than in the state as a whole. Since a number of states and cities have or are likely to implement minimum wages in the $10 to $15 range, we will soon have considerably more data points to consider on how high minimum wage can go without generating disemployment effects. Monitoring these policies on a timely basis would determine whether mid-course corrections might be desirable.
How will California businesses adjust to increased labor costs resulting from these minimum wage increases? We discuss in turn the countervailing effects from increased worker productivity, reduced recruitment and retention costs, and price pass-throughs to consumers.
Effects on Worker Productivity, Recruitment, and Retention Costs
While traditional research on minimum wage employment effects has considered only the demand side of the labor market, recent research examines the effects on the supply side of the labor market as well. Moreover, since low-wage labor markets exhibit high and costly levels of employee turnover, recent research has also examined effects of minimum wages on worker turnover.
that disemployment effects will be at the low end of Neumark and Wascher’s estimates. However, CBO’s choice is arbi-trary; in particular, their discussion (in Appendix A) of the range of findings in recent studies ignores the methodological flaws in studies by Neumark and Wascher and others that we discuss above.
As discussed in detail by Reich, Jacobs and Bernhardt (2014), businesses adjust to the increased costs of a minimum wage increase with offsets that mitigate the need to reduce employment. When work-ers are paid more, their productivity can improve—as can their attitude about their job, their level of effort, and their ability to get to work on time (Reich, Jacobs and Dietz 2014; and Hirsch, Kaufman and Zelenska forthcoming). Moreover, minimum wages can reduce the high levels of job churning that characterize low-wage labor markets.
The National Restaurant Association estimates that annual employee turnover in restaurants approaches 75 percent in some restaurant classifications (National Restaurant Association 2010). Turnover levels are high because workers frequently leave for jobs that pay higher wages, or because they are unable to stay in their jobs due to poverty-related problems such as difficulties with transportation, childcare, or health. Dube, Lester and Reich (2013) found that a 10 percent increase in the minimum wage results in a 2.1 percent reduction in turnover among restaurant workers.
Turnover can be quite costly to firms, even for low-wage jobs. Boushey and Glynn (2012) find that the median cost of replacement for a job paying $30,000 a year or less is 16.1 percent of the employee’s an-nual earnings. The associated reduction in employers’ recruitment and retention costs offsets about 20 to 25 percent of the costs of minimum wage increases (see also Dube, Freeman and Reich 2010).
Effects on Prices
Firms also adjust to increased costs by passing on some of the increases to consumers through higher prices. Since the minimum wage applies to all employers, firms such as restaurants that serve the local market will be able to pass costs through to consumers without experiencing a competitive disadvantage. And since the demand for restaurant meals responds relatively inelastically to price increases, restaurant profits do not fall.3
Research by Aaronson, French and MacDonald (2008) has found that for every percentage-point in-crease in the minimum wage, restaurant prices rise by only 0.072 percent. An earlier study (Lee et al. 2000) showed that restaurant operating costs increase by about 0.1 percent for each percentage increase in the minimum wage (see also Benner and Jayaraman 2012). Cost increases in other industries, includ-ing retail, are an order of magnitude smaller—partly because wage scales are higher and partly because labor costs constitute a much smaller percentage of operating costs.
Previous studies thus suggest that 70 to 75 percent of cost increases in restaurants are passed on to con-sumers in the form of higher prices. A preliminary study of San Jose’s recent experience after its 25 percent minimum wage increase in 2013 arrives at a similar estimate (Allegretto and Reich 2014). Applying this estimate to AB10 and SB935 indicates average price increases of about 0.7 percent for restaurants only, in each of the years in which the minimum wage would increase. This annual increase is one-third of the amount by which average restaurant prices have increased in recent years absent a minimum wage increase.
3More precisely, a Department of Agriculture study (Okrent and Alston 2012) implies that the price elasticity of demand for
all restaurants (food-away-from-home) averages very close to 1, indicating that overall spending at all restaurants remains unchanged in the face of a price increase, and therefore that restaurant profits do not fall. Effects on limited and full service restaurants may differ somewhat from this average; these details are beyond our scope here.
0.0% 10.0% 20.0% 30.0% 40.0% 50.0% 60.0% 70.0% 80.0%
90.0% Proportion of workers affected by minimum wage increase within each industry
AB10 SB935
Note: Each industry's proportion of California's overall workforce is shown in parentheses. Source: 2013 Current Population Survey data. See Data Appendix for details.
0.0% 5.0% 10.0% 15.0% 20.0% 25.0%
Distribution of workers affected by minimum wage increase across industries
AB10 SB935
Effects by Industry
The number of workers affected by minimum wage policies is likely to be greater in large industries with low pay structures. As the top panel of Figure 4 shows, two large industries (each industry’s share of the workforce is noted in parenthesis) – leisure/hospitality and retail—account for over 40 percent of workers affected by AB10 and about 35 percent of workers affected by SB935. Since average wages vary by industry, minimum wages affect some industries more than others. The bottom panel of Figure 4 shows that leisure/hospitality, retail, and agriculture are the most affected industries—that is, they have the highest proportions of low-wage workers who would affected by AB10 or SB935.
4. Effects on the California’s Economy and State Budget
Macroeconomic Effects
A higher minimum wage—whether the $10 proposed by AB10 or the $13 proposed by SB935—will affect the broader economy. Low-wage workers have a high marginal propensity to consume—that is, they spend rather than save a large share of additional earnings, often because they are striving to meet their basic needs. Thus, raising the minimum wage can simultaneously benefit low-wage working fami-lies and provide a modest boost to overall consumption.4
As we report in Table 1, between 2014 and 2017, AB10 would provide an additional $8.2 billion in wages for directly and indirectly affected workers. During SB935’s phase-in to $13 over the same pe-riod, total wages would increase by a much larger amount ($22.5 billion). In comparison, California’s GDP is about $2 trillion.
Increased State Revenues from Taxes
Both minimum wage bills have the potential to modestly increase state tax revenues. Figure 5 below reports increases in state income and sales taxes associated with AB10 and SB935—as estimated by the Institute on Taxation and Economic Policy (ITEP)—for the years 2015, 2016, and 2017.5 AB10 would
4In principle, this increased consumption by low-wage workers could be offset by decreased consumption by other
work-ers (whose incomes decrease), by decreased investment, or by decreased government spending and increased taxes. As we argued in Section 3, minimum wage increases under AB10 and SB935 are not likely to generate unemployment, nor to decrease earnings among higher-paid workers. As we also discussed, they also are not likely to affect profits, the main source of funds for business investment. Moreover, when the level of economic activity is below its potential and interest rates are at a zero lower bound, increased consumption spending increases the level of economic activity and does not automatically crowd out other types of spending. We discuss the effects of minimum wage increases on government spending and taxes below.
5Income and sales tax estimates were generated using ITEPs Microsimulation Tax Model, a computer model based on
a large sample of federal tax returns that estimates federal, state, and local tax liability under a variety of scenarios. The model uses data from the Internal Revenue Service, the Census Bureau’s American Community Survey, the Consumer Expenditure Survey, and state revenue departments to generate micro-level analyses that are consistent with the latest state and federal revenue forecasts. ITEP used wage growth estimates provided by the Economic Policy Institute to estimate the additional income and sales tax revenues that would be generated as a result of new wage levels. For the sales tax analysis, ITEP calculated effective sales tax rates by income levels, and applied those tax rates to the additional wage growth, after
0 200 400 600 800 1,000 1,200 1,400 1,600
Sales tax Income tax Sales tax Income tax
AB10 SB935
m
ill
io
ns
o
f $
20
14
2017 2016 2015
Figure 5: Estimates of California sales and income tax revenue due to AB10 and SB935
Three-year totals for salestax and income tax revenues:
AB 10 = $444 million SB 935 = $2.6 billion
Source: Analysis provided by the Institute on Taxation and Economic Policy.
2015 2016 2017
2015 2016 2017
generate up to $444 million in additional revenue over three years, while SB935 would increase state revenues by as much as $2.6 billion over the same period—a net difference of $2.2 billion.6
The lowest-income households who would benefit from AB10 and SB935—particularly those with dependent children—do not generally have positive income tax liability. Most of the additional income tax revenue under the wage proposals comes from affected workers in middle-earning households and from single working adults without children. Sales tax revenue, on the other hand, would be generated by affected workers across the income spectrum: Low-income households will spend additional earnings
accounting for the proportion of income that would be saved rather than spent. For the income tax analysis, ITEP calculat-ed average taxable income for those households realizing higher wages, and applicalculat-ed the relevant estimates of the California marginal income tax rates. The model assumes a marginal propensity to consume for taxable goods of 95 percent for the lowest-income households, decreasing in steps to 75 percent for the highest-earning households.
6These estimates depend upon the assumed marginal propensities to consume goods that are taxable. If these assumptions
are too high, tax revenues will be lower. On the other hand, increases in consumption are likely to have multiplier effects as the new money is respent in the state. Since recent estimates of such multiplier effects vary, we have not attempted to quantify them here. As a result, our estimates of revenue gains may be under-estimated.
on basic needs, and while some of that additional spending will be on nontaxable items (such as food or services), a large portion will be taxable spending on goods (Aaronson, Agarwal and French 2012).7
Public Subsidy Savings on Select Programs
This section discusses the effect of AB10 and SB935 on taxpayer-financed public subsidy programs in California. Two recent econometric studies (West and Reich 2014a, 2014b) examine the causal effects of minimum wage changes on two large public assistance programs: the Medicaid program and the
Supplemental Nutrition Assistance Program (SNAP, formerly known as the Food Stamp Program). In this section, we leverage the results of these studies to predict the impact of AB10 and SB935 on California’s Medi-Cal and CalFresh programs, respectively. We calculate reductions in terms of both program enrollment and program expenditures.
Medi-Cal Savings
Prior to January of 2014, California’s Medicaid program, Medi-Cal, was available only to select groups of low-income individuals and families in California. These included certain groups who were eligible under federal mandate, termed “categorically needy.”8California had also extended Medi-Cal coverage beyond the federal requirements, to groups such as parents of qualifying dependent children. Medi-Cal eligibility for these individuals and families was governed by income thresholds, measured relative to the Federal Poverty Level (FPL). For example, working parents of dependent children whose incomes were below 106 percent of the FPL qualified for Medi-Cal; jobless parents were eligible if their income was below 100 percent of the FPL. Some low-income groups—for example, childless adults—remained ineligible for Medi-Cal regardless of income.
After Medicaid expansion under the Affordable Care Act took effect in January 2014, any individual or family whose income fell below 138 percent of the Federal Poverty Level could receive health care under Medi-Cal. These eligibility changes have generated a surge of enrollments—and not only among newly eligible individuals and families. Publicity about changes to Medi-Cal under the Affordable Care Act, as well as successful outreach strategies to enroll those who are newly eligible, have resulted in additional enrollments among individuals and families who were eligible under the previous Medi-Cal guidelines. The healthcare literature often dubs this source of increased enrollment the “woodwork effect,” referring to individuals and families who “come out of the woodwork” to take up a program for which they were already eligible.9
7Could the increased tax revenues from workers affected by minimum wage increases be offset by lower taxes paid by
oth-ers who are hurt by a minimum wage? As we have argued, spending on restaurants will not be appreciably affected, leaving unchanged restaurant owners’ profits and restaurant customers’ consumption on other goods and services. In an economy operating at less than full potential, a minimum wage can modestly increase the level of economic activity and therefore also increase tax revenues.
8As of 2012, categorically eligible groups included children under age 19 whose family income was at or below the federal
poverty level (and 133 percent of the FPL for children under 6); SSI recipients (primarily those who are disabled); families with children meeting the requirements for former AFDC (welfare); pregnant women with incomes at or under 133 percent of the FPL and their infants; and specific low-income Medicare beneficiaries.
9See, for example, Aaron Carroll. 2013. “The ‘Woodwork Problem’ and the Medicaid Expansion.” The Incidental
Policymakers were not caught off guard by the woodwork effect, but enrollments by previously eligible individuals and families have exceeded expectations. Governor Jerry Brown announced in May 2014 that 30 percent of Californians were expected to participate in Medi-Cal—far exceeding the 24 percent anticipated in January 2014. This Medi-Cal participation estimate includes 800,000 individuals who were eligible under “traditional” Medi-Cal guidelines.10 Unlike newly eligible groups—for whom cover-age is entirely funded by the federal government through the end of 2016—California pays nearly 50 percent of the cost of coverage for woodwork enrollees. In his revised May budget, the governor expects the woodwork effect to cost the state $1.2 billion more than anticipated—$193 million for the prior budget cycle and $918 million for this cycle (2014-2015).
The minimum wage provides a policy instrument that will offset part of the cost of the Medicaid expan-sion—as well as the woodwork effect—to the state. For the majority of Medi-Cal participants, Medi-Cal eligibility is directly determined by income. Thus, insofar as the minimum wage affects income among Medi-Cal recipients who were previously eligible, the enrollment rate in “traditional” Medi-Cal will decline when the minimum wage rises. In the ACA Medicaid expansion era, if a minimum wage change lifts some families’ incomes above the eligibility thresholds for “traditional” Medi-Cal—pushing these families into “newly eligible” income categories—the cost of their care will be shifted primarily to the federal government. In other words, a minimum wage increase both improves the financial wellbeing of such families and sustains their access to affordable healthcare—either by virtue of the Medicaid expan-sion or health insurance subsidies—while simultaneously relieving the state of most of the direct costs. How responsive will “traditional” Medi-Cal enrollment and spending be to minimum wage changes? West and Reich (forthcoming 2014b) examine the empirical relationship between Medicaid and the minimum wage using 15 years of historical data from the Annual Social and Economic Supplement of the Current Population Survey (commonly called the March CPS). The paper develops an econometric model by exploiting variation in binding state and federal minimum wage changes from 1998 to 2012 (inclusive). The regression design controls for state-level conditions such as unemployment rates, em-ployment to population ratios, and median family income levels. The findings of this study indicate that a 10 percent increase in the minimum wage leads to a 0.3 percentage point reduction in the Medicaid enrollment rate among non-elderly families, holding other factors constant.
In Appendix Table 2, we apply the study’s results to estimate the number of persons who would be shifted from “traditional” (partially state-financed) Medi-Cal to new, primarily federally-financed healthcare coverage options under both AB10 and SB935. The table shows both the reduction in “woodwork” enrollees in “traditional” Medi-Cal each year (presuming a total of 800,000 woodwork enrollments), and the reduction in all other “traditional” Medi-Cal enrollees. In 2016, when it would be fully implemented, AB10 would shift more than 217,000 Californians from “traditional” state-financed Medicaid to coverage under the ACA expansion. SB935 would shift more than twice that many recipi-ents to predominately federally-financed care in the same year.
We also calculate the associated savings accruing to California taxpayers from Medi-Cal enrollment
10California Healthline, “Brown’s Revised Budget Proposal Includes Addition $1.2B for Medi-Cal,” May 14, 2014.
shifts.11Figure 6 illustrates California savings over the next four years. About 7.4 percent is due to reductions in the “woodwork effect;” the remainder is due to income increases among previously enrolled individuals.12
Between 2015 and 2017, AB10 would save California taxpayers a total of $542 million in Medi-Cal re-lated costs, while SB935 would save nearly $1.54 billion over the same time period. Primarily by virtue of inflation indexing, the savings under SB935 would continue to be above $595 million per year after 2017, while AB10 savings would erode as the minimum wage decreased in real terms.
CalFresh
California’s Supplemental Nutrition Assistance (food stamp) program, CalFresh, is a means-tested pro-gram. A household’s overall eligibility for CalFresh—as well as the extent of benefits it may receive—are directly determined by household income. CalFresh benefits decline by 30 cents for every $1 increase
11To estimate the savings to California taxpayers, we presume that minimum wage policy affects primarily non-elderly,
non-disabled individuals and families, and apply an average cost of care for such families. Assuming that the Federal Medi-cal Assistance Percentage—that is, the amount of federal matching funds that California receives for social services—re-mains at 50 percent throughout the next decade, California is responsible for an average of about $1,117 per enrollee per year for each non-disabled, non-elderly Medi-Cal participant.
12These estimated taxpayer savings, presented in detail in Appendix Table 2, have been adjusted to reflect California’s share
of Medicaid expansion costs in 2017. Since our estimates derive from statistical models and Current Population Survey data, they are also subject to margins of error.
$0 $100 $200 $300 $400 $500 $600 $700
m
ill
io
ns
o
f 2
01
3
do
lla
rs
Figure 6: Projected annual Medi-Cal savings to California from AB 10 and SB 935
AB 10 SB 935
Source: Authors' analysis of data from the March Current Population Survey, the Center on Medicare and Medicaid. Services, and the Bureau of Economic Analysis National Income and Product Accounts.
Note: See Data Appendix for details.
in family earnings and phase out entirely at about the Federal Poverty Level (FPL). Thus, by definition, government spending on CalFresh should decline as average earnings increase, inasmuch as benefit levels fall with increased earnings, and inasmuch as the earnings increase makes some households ineligible for the program. Low-wage workers and their families are disproportionately enrolled in CalFresh. A minimum wage increase that lifts working families out of poverty should therefore reduce public expen-ditures on CalFresh.
West and Reich (2014a) estimate the effect of minimum wage changes on SNAP activity between 1990 and 2012. The report concludes that a 10 percent increase in the minimum wage reduces SNAP enroll-ment between 2.4 and 3.2 percent and reduces program expenditures by an estimated 1.9 percent. Using these results, we show in detail in Appendix Table 3 the anticipated reduction in CalFresh enroll-ment and expenditures that would occur under AB10 and SB935. Figure 7 summarizes these estimates. In 2012, CalFresh benefits totaled nearly $7.2 billion, about 9.6 percent of the nation’s total. AB10 would reduce this amount by as much as 3.1 percent of recent expenditures ($227 million) in 2016. However, the impact of AB10 on CalFresh expenditures would dwindle after 2016 as inflation erodes the value of the AB10 minimum wage. By contrast, SB935 represents a large and lasting reduction in program expenditures, exceeding 7.6 percent of recent CalFresh spending ($548 million) by 2016. As noted above, CalFresh is a federally-funded program. Thus, unlike in the case of Medi-Cal, the reduction in program expenditures on CalFresh would not accrue to the state of California. Rather, the savings would be distributed to taxpayers across the United States. Also in contrast to minimum wage’s
$0 $100 $200 $300 $400 $500 $600 $700
m
ill
io
ns
o
f 2
01
3
do
lla
rs
Figure 7: Projected annual CalFresh savings to the federal government from AB 10 and SB 935
AB 10 SB 935
Source: Authors' analysis of data from the March Current Population Survey and the US Department of Agriculture. Note: See Data Appendix for details.
effects on Medi-Cal, the effect on CalFresh benefits would counteract some of the improvement in workers’ welfare brought about by a minimum-wage increase.13 However, because program benefits decrease by at most $0.30 for every additional dollar of earnings, the income gain from the minimum wage increase would far outweigh the loss associated with the reduction in Calfresh benefits for working families.
In contrast to CalFresh savings, which would be distributed among all federal taxpayers, the Medi-Cal state-level savings discussed above would be achieved by shifting some costs from state to federal taxpayers. Taking the two programs together, predicted CalFresh savings to federal taxpayers would offset some or all of the additional federal costs from the Medi-Cal cost shifting. Under AB10, Medicaid savings would offset 95 percent of increased costs from Medi-Cal between 2015 and 2017. Under SB935, on the other hand, $1.64 billion in reduced CalFresh expenditures would more than offset the $1.54 billion in increased federal Medicaid costs.
Increased State Outlays: Home Care Workers and Services for the Developmentally-Disabled
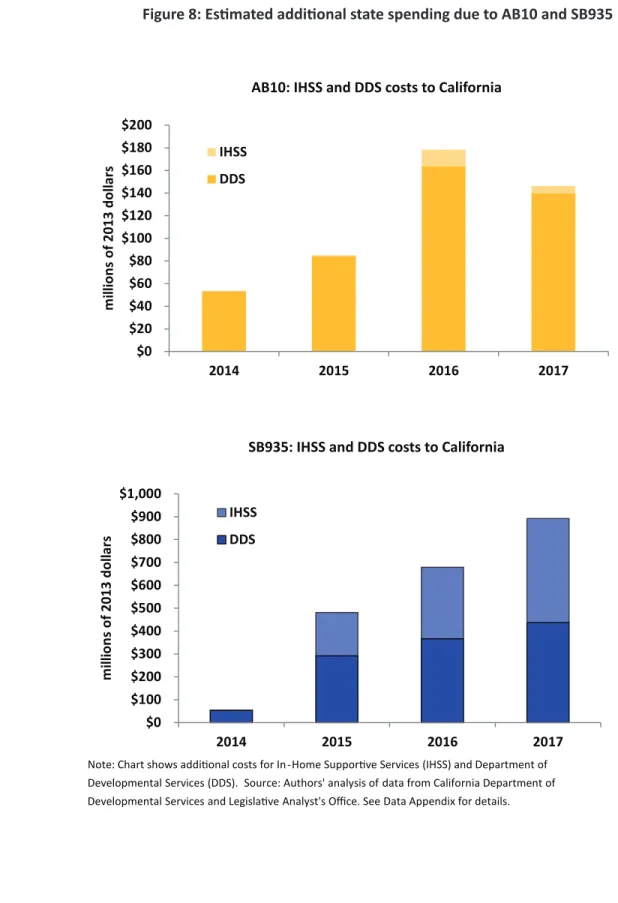
In addition to the favorable budgetary outcomes discussed above, California’s state budget would also incur some costs from raising the minimum wage. The primary source of direct costs to the state in-volves the workers whom the state employs at or near the current minimum wage—and who would ex-perience a direct pay increase under both AB10 and SB935. In-Home Supportive Service (IHSS) work-ers constitute the largest group of such workwork-ers.14Assuming that without further legislative action, IHSS workers’ pay in each California county will rise at the rate of inflation (that is, that annual cost-of-living adjustments are provided) the state would incur additional costs only when the minimum wage exceeds hourly pay rates in each county.15 Under these assumptions, additional state costs from AB10 would reach a maximum of $14 million in 2016, and fall thereafter. SB935 would impose larger and increas-ing costs on the state—though the rate of increase would slow significantly by the end of the decade— reaching $304 million in 2016 and $444 million by the time SB935 is fully implemented in 2017.
13As noted above, workers who lose eligibility for “traditional” (state-financed) Medi-Cal by virtue of a wage increase
would nonetheless retain access to the program’s services at little or no additional expense. They would either continue to receive Medi-Cal under the Medicaid expansion, or would qualify for substantial health insurance subsidies under the Affordable Care Act. Thus the Medi-Cal effects would represent a zero or small offset to the welfare improvement from the minimum wage increase.
14The federal government matches states’ wages for IHSS workers, and provides an additional contribution in California
under the Community First Choice Option waiver. The California Legislative Analyst’s Office estimates that California’s average contribution to IHSS wages is 46 percent. http://www.lao.ca.gov/reports/2014/budget/human-services/human-services-022014.aspx.
15According to the California Department of Social Services, 51 of California’s 58 counties paid an hourly IHSS wage
higher than the minimum wage in 2013. The average wage across counties was $9.64.
$0 $20 $40 $60 $80 $100 $120 $140 $160 $180 $200
2014 2015 2016 2017
m
ill
io
ns
o
f 2
01
3
do
lla
rs
AB10: IHSS and DDS costs to California
IHSS DDS
$0 $100 $200 $300 $400 $500 $600 $700 $800 $900 $1,000
2014 2015 2016 2017
m
ill
io
ns
o
f 2
01
3
do
lla
rs
SB935: IHSS and DDS costs to California
IHSS DDS
Note: Chart shows additional costs for In-Home Supportive Services (IHSS) and Department of Developmental Services (DDS). Source: Authors' analysis of data from California Department of Developmental Services and Legislative Analyst's Office. See Data Appendix for details.
Other costs to the state of a minimum wage increase stem from the routine purchase of services by the California Department of Developmental Service (DDS). The DDS’s May 2014 budget reported that the costs associated with a minimum wage increase from $8 to $9 per hour would total about $106.5 million for the 2014-2015 fiscal year.16 We were unable to obtain direct estimates for how these costs might respond to minimum wage changes of different magnitudes or at different times. Therefore, we make the rough assumption that DDS costs increase linearly with the wage rate. As illustrated in Figure 8, AB10 would then add a maximum of $160 million in DDS costs in 2015 (relative to no minimum wage change). SB935 would increase DDS costs by$358 million in 2016—and about $427 million each year thereafter—when compared against a zero minimum wage change scenario.
Summary of these State Fiscal Impacts
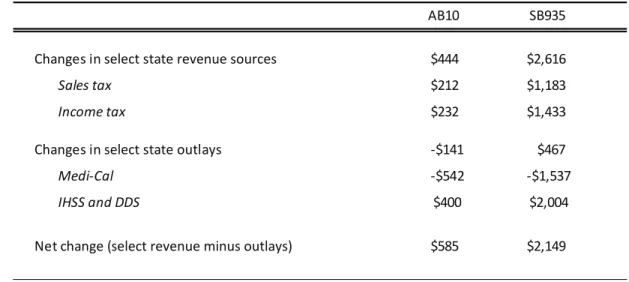
Table 2 summarizes the fiscal effects of minimum wages on the California budget during 2015-17. Income and sales tax revenue will increase about $445 million under AB10 and $2.62 billion under SB935. On the spending side, Medi-Cal costs will fall by about $542 million under AB10 and $1.54 billion under SB935, while increased wage costs for state-supported home care workers and service workers for the developmentally disabled will total about $400 million (AB10) and $2.0 billion (SB935). Increased revenues less increased outlays will total about $585 million (AB10) and $2.14 billion
(SB935). We emphasize that these estimates refer only to the effects of minimum wage changes and do not constitute an overall forecast of the state’s budget in coming years.
16See California Department of Developmental Services, “Developmental Centers 2014 May Revision of the 2014-15
Budget,” May 2014. http://www.dds.ca.gov/Budget/Docs/2014_2015DCMayRevision.pdf.
Table 2: Cumulative estimated effects of minimum wages on California budget, 2015-2017 (inclusive) (millions of 2013 dollars)
AB10 SB935
Changes in select state revenue sources $444 $2,616
Sales tax $212 $1,183
Income tax $232 $1,433
Changes in select state outlays -$141 $467
Medi-Cal -$542 -$1,537
IHSS and DDS $400 $2,004
Net change (select revenue minus outlays) $585 $2,149
5. Conclusion
We compare the recently enacted AB10, which will increase the minimum wage in California to $10 in 2016, to Senator Mark Leno’s proposed SB935, which would increase the state’s minimum wage to $13 in 2017. Although both bills would bring California’s minimum wage into the double digits for the first time, each of the wage floors overstate the changes they would bring. In today’s dollars, AB10 would peak at $9.54, and SB935 would peak at $12.11. Both would bring about minimum wage levels that are within historical precedent. AB10 will restore the real minimum wage to the same level it attained in 1980. SB935 would go further, representing a real wage standard just beyond the level attained in 1968, when worker productivity was about half the current level. By indexing the minimum wage to inflation in 2018 and beyond, SB935 would ensure that benefits are sustained for California’s affected workers. While both AB10 and SB935 would have positive effects on low-income workers and families in Cali-fornia, SB935’s reach would be much greater, touching more than one-third of California’s workforce. The majority of workers affected by both AB10 and SB935 are full-time employees, are at least 30 years old, and are Hispanic. Nearly one in three children would experience increased family income under SB395, versus one in four under AB10. SB935 would provide an additional $22.5 billion in earnings to low-wage workers and their families between 2015 and 2017, nearly three times as much as AB10 would provide. Both proposals would have the greatest impact on workers in the leisure/hospitality and retail industries.
Research suggests that affected businesses would adjust to either policy through a combination of increased worker productivity, reduced recruitment and retention costs, and modest price increases in restaurants only. As a note of caution, this previous research has necessarily focused on somewhat lower minimum wage levels. We suggest timely monitoring of the many new minimum wage policies around the U.S. that range between $10 and $15. This knowledge will provide further information on how high minimum wages can go without affecting employment.
Although the primary objective of minimum wage policy is to increase the well-being of low-wage workers and their families, it bears mentioning that both AB10 and SB935 would positively affect Cali-fornia’s fiscal situation in the coming years. Both policies would increase state tax revenues and decrease state outlays. These effects are far greater under SB935. The proposals would also reduce enrollment in California’s public subsidy programs; in the case of Medi-Cal, California would sustain savings as some recipients shift from state-financed to federally-financed care. The state would also experience increased costs associated with certain groups of workers—primarily in-home care workers and service workers for the developmentally-disabled. Accounting for each of these effects of minimum wages, we estimate that over the period from 2015 to 2017, the net gains would approximate $585 million under AB10 and $2.14 billion under SB935.
Appendix
Appendix Table A1: Estimated effects of proposed California state minimum wage increases
Nominal Minimum
Wage
Total estimated
workers1
Directly affected2
Indirectly affected3
Total Affected
Total Affected as
% of Workers
Increased wages for directly &
indirectly affected4
Current AB10 schedule
July-December 2014 $9.00 14,944,000 1,200,000 880,000 2,080,000 13.90% $900,526,500
January-December 2015 $9.00 15,075,806 1,210,584 887,762 2,098,346 13.90% $1,816,938,287
January-December 2016 $10.00 15,142,000 2,128,000 1,175,000 3,303,000 21.80% $2,714,231,000
January-December 2017 $10.00 15,275,552 2,146,769 1,185,364 3,332,132 21.80% $2,738,170,517
Total: 2014-2017 $8,169,866,305
Proposed SB935
July-December 2014 $9.00 14,944,000 1,200,000 880,000 2,080,000 13.90% $900,526,500
January-December 2015 $11.00 15,010,000 3,274,000 1,392,000 4,666,000 31.10% $7,946,381,000
January-December 2016 $12.00 15,142,000 3,650,000 843,000 4,493,000 29.70% $4,310,076,000
January-December 2017 $13.00 15,276,000 4,326,000 1,053,000 5,379,000 35.20% $9,349,981,000
Total: 2014-2017 $22,506,964,500
Source: EPI Analysis of Current Population Survey, Outgoing Rotation Group public-use microdata, 2013. Notes: Estimates provided with assistance from David Cooper economic analyst at the Economic Policy Institute. The average margin of error is ± 1.2 percentage-points within a range of ± 0.4 to ± 2.9 percentage-points for data in Figures 3 and 4. Some workers indirectly affected by initial phases of each policy will be directly and indirectly
affected in subsequent phases. Demographic analysis of affected workers describes those directly and indirectly
affected during any phase of the policy. Wage increase, GDP impact, and jobs impact totals are the sums of all phases. GDP- and job-stimulus estimations rely upon multipliers applicable to current economic conditions and periods of labor market slack. Job impact estimation methods can be found in: Douglas Hall and David Cooper (2012) and Josh Bivens (2011).
Annual population growth assumed to be 0.882%, as projected by California Department of Finance for 2013-2018. No assumed annual wage growth from 2013 values in first year; 2.4% wage growth assumed in subsequent years. (Consistent with average annual wage growth of bottom 20% of wage earners from 2002-2006, according to the Current Population Survey.)
1 Total estimated workers is estimated from the CPS respondents who were 16 years old or older, employed, but
not self-employed, and for whom either a valid hourly wage is reported or one can be imputed from weekly earnings and average weekly hours. Consequently, this estimate represents the identifiable wage-earning workforce and tends to understate the size of the full workforce.
2 Directly affected workers will see their wages rise because the new minimum wage rate will exceed their
current hourly pay.
3 Indirectly affected workers have a wage rate just above the new minimum wage (between the new minimum
wage and the new minimum wage plus the dollar amount of the increase in the previous year's minimum wage). They will receive a raise as employer pay scales are adjusted upward to reflect the new minimum wage.
Appendix Table A2: Comparison of Medi-Cal savings under AB10 and SB935
Woodwork Enrollment reduction (persons)
Non-woodwork enrollment
reduction (persons)
California savings (millions of
$2013)
Woodwork Enrollment reduction
(persons)
Non-woodwork enrollment
reduction (persons)
California savings (millions of
$2013)
2014 3,861 47,991 $56.6 3,861 47,991 $56.6
2015 7,424 92,282 $108.8 28,600 355,511 $419.1
2016 16,181 201,137 $237.1 35,590 442,406 $521.5
2017 13,776 171,249 $195.8 41,953 521,503 $596.3
a. Calculations assumes that all affected enrollees are non-aged and non-disabled enrollee, and that California's federal reimbursement rate for Medi-Cal expenses (50%) remains constant.
b. Population growth is projected to be 0.882 percent per year. California Department of Finance projected rate of growth for the period 2013-2018.
Year
AB10 SB935
Appendix Table A3: Comparison of CalFresh program savings under AB10 and SB935 Enrollment reduction
(persons) (millions of $2013)Federal savings Enrollment reduc(persons) tion (millions of $2013)Federal savings
2014 45,220 $51.9 45,220 $51.9
2015 88,433 $100.6 377,716 $429.9
2016 200,931 $226.7 485,926 $548.2
2017 169,011 $189.0 590,166 $660.0
Year
b. Population growth is projected to be 0.882 percent per year. California Department of Finance projected rate of growth for the period 2013-2018.
AB10 SB935
Appendix Table A4: In-Home Supportive Service Worker and Department of Developmental Services costs
IHSS Costs
(millions of $2013) (millions of $2013)DDS Costs (millions of $2013)IHSS Costs (millions of $2013)DDS Costs
2014 $0.4 $52.0 $0.4 $52.0
2015 $1.2 $82.1 $185.0 $285.2
2016 $14.3 $159.8 $304.6 $358.2
2017 $6.5 $136.6 $444.0 $427.2
Year AB10 SB935
References
Aaronson, Daniel, Sumit Agarwal and Eric French. 2012. “The Spending and Debt Responses to a Minimum Wage
Hike.” American Economic Review 102, 7: 3111-39.
Aaronson, Daniel, Eric French and James MacDonald. 2008. “The Minimum Wage, Restaurant Prices and Labor Market Structure.” Journal of Human Resources.43, 3: 688-720.
Allegretto, Sylvia, Arindrajit Dube and Michael Reich. 2011. “Do Minimum Wages Really Affect Teen
Employment?” Industrial Relations 50, 2: 205-40.
_______, ______, ________and Ben Zipperer. 2013. “Credible Research Designs for Minimum Wage Studies.” Working Paper No. 148-13. Institute for Research on Labor and Employment, UC Berkeley.
_______ and Michael Reich. 2014. “Revisiting Minimum Wage Effects on Prices: a Preliminary Report.” Presented at the annual meetings of the Labor and Employment Relations Association, Portland, OR. May 31.
Belman, Dale and Paul J. Wolfson. 2014. “The New Minimum Wage Research.” Employment Research 21(2): 4-5.
Benner, Chris and Saru Jayaraman. 2012. “A Dime a Day: the Impact of the Harkin/Miller Proposal on the Price of Food.” University of California, Berkeley Food Labor Research Center, Food Chain Workers Alliance and Restaurant Opportunities Center. http://laborcenter.berkeley.edu/foodlabor/price_food12.pdf
Bureau of Labor Statistics. 2014. “Nonfarm Business Sector: Real Output Per Hour of All Persons.” https://research.
stlouisfed.org/fred2/series/OPHNFB
Colla, Carrie, William Dow and Arindrajit Dube. 2014. “Health Spending Requirements in San Francisco.”
Chapter 3 in Reich, Jacobs and Dietz eds. When Mandates Work: Raising Labor Standards at the Local Level.
Berkeley, CA: University of California Press.
Congressional Budget Office. 2014. “The Effects of a Minimum-Wage Increase on Employment and Family Income.” Washington DC: Congressional Budget Office.
Dube, Arindrajit. 2013. “Minimum Wages and the Distribution of Family Income.” Unpublished working paper https://dl.dropboxusercontent.com/u/15038936/Dube_MinimumWagesFamilyIncomes.pdf
______.2014. “Designing Thoughtful Minimum Wage Policy at the State and Local Levels.” Washington, DC: The Hamilton Project.
______, Eric Freeman and Michael Reich. 2010. “The Economics of Replacement Costs.” Working Paper 201-10. Institute for Research on Labor and Employment, UC Berkeley.
______, William Lester and Michael Reich. 2010. “Minimum Wages Across State Borders: Estimates from
Contiguous Counties.” Review of Economics and Statistics 92, 4: 945-64.
______, Suresh Naidu and Michael Reich. 2014. “Labor Market Impacts of San Francisco’s Minimum Wage.”
Chapter 2 in Reich, Jacobs and Dietz eds. When Mandates Work: Raising Labor Standards at the Local Level. Berkeley,
Hirsch, Barry T. Bruce E. Kaufman and Tetyana Zelenska. Forthcoming. “Minimum Wage Channels of
Adjustment.” Industrial Relations.
National Council of State Legislators. 2014. “State Minimum Wages.”
http://www.ncsl.org/research/labor-and-employment/state-minimum-wage-chart.aspx
National Restaurant Association. 2010. Industry Report.
Neumark, David and William Wascher. 2008. Minimum Wages. Cambridge, MA: MIT Press.
______, Ian Salas and William Wascher. 2013. “Revisiting the Minimum Wage-Employment Debate: Throwing out the Baby with the Bathwater?” Working Paper 18681. National Bureau of Economic Research.
Okrent, Abigail and Julian Alston. 2012. “The Demand for Disaggregated Food-Away-from-Home and Food-at-
Home Products in the United States.” U.S. Department of Agriculture, Economic Research Service. http://www.
ers.usda.gov/publications/err-economic-research-report/err139.aspx
Reich, Michael, Ken Jacobs and Annette Bernhardt. 2014. “Local Minimum Wage Laws: Impacts on Workers, Families and Businesses.” Working Paper No. 104-14. Institute for Research on Labor and Employment, UC Berkeley.
________, _______ and Miranda Dietz eds. 2014. When Mandates Work: Raising Labor Standards at the Local Level.
Berkeley, CA: University of California Press.
Schmitt, John. 2013. “Why Does the Minimum Wage Have No Discernable Effect on Employment?” Center for
Economic and Policy Research. http://www.cepr.net/documents/publications/min-wage-2013-02.pdf
Schmitt, John and Janelle Jones 2012. “Low-wage Workers Are Older and Better Educated than Ever.” Issue Brief, Center for Economic and Policy Research. http://www.cepr.net/documents/publications/min-wage3-2012-04.pdf Sommeiller, Estelle and Mark Price. 2014. “The Increasingly Unequal States of America: Income Inequality by State,
1917 to 2011.” Economic Policy Institute, Economic Analysis and Research Network Report. http://s2.epi.org/
files/2014/Income-Inequality-by-State-Final.pdf
U.S. Department of Commerce, Bureau of Economic Analysis. 2014. Gross Domestic Product. http://research.
stlouisfed.org/fred2/series/GDPC1
West, Rachel and Michael Reich. 2014a. “The Effects of Minimum Wages on SNAP Enrollments
and Expenditures.” Center for American Progress. http://americanprogress.org/issues/economy/
report/2014/03/05/85158/the-effects-of-minimum-wages-on-snap-enrollments-and-expenditures
________, _______. 2014b. “A Win-Win for Working Families and State Budgets: Paying for Medicaid Expansion with a $10.10 Minimum Wage.” Center for American Progress (forthcoming).
Center on Wage and Employment Dynamics
Institute for Research on Labor and Employment University of California, Berkeley
2521 Channing Way #5555 Berkeley, CA 94720-5555 (510) 643-8140