© 2019 by the Serbian Biological Society How to cite this article: Vidonja-Uzelac T, Tatalović N, Mijović M, Koželj G, 133 Nikolić-Kokić A, Oreščanin-Dušić Z, Bresjanac M, Blagojević D. Effects of ibogaine
per os application on redox homeostasis in rat liver and erythrocytes. Arch Biol Sci. 2019;71(1):133-44.
Effects of ibogaine
per os
application on redox homeostasis in rat liver and erythrocytes
Teodora Vidonja Uzelac1, Nikola Tatalović1, Milica Mijović2, Gordana Koželj3, Aleksandra Nikolić-Kokić1,
Zorana Oreščanin-Dušić1, Mara Bresjanac4 and Duško Blagojević1,*
1Department of Physiology, Institute for Biological Research “Siniša Stanković”, University of Belgrade, Bulevar despota
Stefana 142, 11060 Belgrade, Serbia
2Institute of Pathology, Faculty of Medicine, University of Priština, Anri Dinana bb, 38220 Kosovska Mitrovica, Serbia
3Institute of Forensic Medicine, Faculty of Medicine, University of Ljubljana, Korytkova 2, 1000 Ljubljana, Slovenia
4Institute of Pathophysiology, Faculty of Medicine, University of Ljubljana, Zaloška 4, 1001 Ljubljana, Slovenia
*Corresponding authors: [email protected]
Received: September 18, 2018; Revised: November 28, 2018; Accepted: November 29, 2018; Published online: December 6; 2018
Abstract: Ibogaine, administered as a single oral dose (1-25 mg/kg body weight), has been used as an addiction-interrupting agent. Its effects persist for up to 72 h. Ex vivo results showed that ibogaine induced cellular energy consumption and res-titution, followed by increased reactive oxygen species production and antioxidant activity. Therefore, the aim of this work was to explore the effect of a single oral dose of ibogaine (1 or 20 mg/kg body weight) on antioxidative defenses in rat liver and erythrocytes. Six and 24 h after ibogaine administration, histological examination showed glycogenolytic activity in hepatocytes, which was highest after 24 h in animals that received 20 mg/kg ibogaine. There were no changes in the activi-ties of superoxide dismutases, catalase, glutathione peroxidase, glutathione reductase and glutathione-S-transferase in the liver and erythrocytes after ibogaine treatment, regardless of the dose. Hepatic xanthine oxidase activity was elevated in rats that received 20 mg/kg compared to the controls (p<0.01), suggesting faster adenosine turnover. TBARS concentration was elevated in the group treated with 1 mg/kg after 24 h compared to the controls (p<0.01), suggesting mild oxidative stress. Our results show that ibogaine treatment influenced hepatic redox homeostasis, but not sufficiently to remodel antioxidant enzyme activities at 6 and 24 h post-ibogaine application.
Keywords: ibogaine; glycogen; antioxidant enzymes; lipid peroxidation; xanthine oxidase
INTRODUCTION
Ibogaine is the main alkaloid in the root bark of the plant Tabernanthe iboga [1], which has been used by the natives of western-central Africa to overcome fatigue, hunger and thirst, and at higher doses, to provoke dreamlike hallucinations for spiritual rituals [2]. In the “ibogaine medical subculture”, predominantly in Europe and America, it is used to facilitate abstinence from a variety of addictive substances (such as cocaine, heroin, methadone and alcohol), when ibogaine is most frequently administered as a single oral dose in the range from 1-25 mg/kg of body weight (b.w.) [2-4]. In the most recent publication [5] in the Clini-cal Guidelines for Ibogaine-Assisted Detoxification, published by the Global Ibogaine Therapy Alliance (GITA), it is suggested that dosing should never exceed
we chose to explore the effects of a single oral dose of either 1 or 20 mg/kg b.w.
Ibogaine’s anti-addictive activity is achieved through its effects on receptors (N-methyl-D-aspartate [9], nicotinic [10], 5-hydroxytryptamine 2A (5-HT2A), muscarinic [1] and kappa, sigma-2 and mu opioid receptors [1]), inhibition of monoamine oxidase [1], antagonism of 5-HT and dopaminergic transporters [1], and through adaptive changes in ATP-related cell energy homeostasis [11-13]. Paškulin et al. [14] showed an increase in the production of energy-related enzymes in rat brain after intraperitoneal (i.p.) injection of 20 mg/kg b.w., and in yeast Saccharomyces cerevisiae
[11] cultivated with ibogaine at a concentration of 1 mg/L, which corresponds to the dose in the brain. It was also shown that ibogaine caused rapid depletion of ATP that was accompanied by increased production of reactive oxygen species (ROS) [13] and activation of antioxidant defense enzymes in yeast [11]. While ibogaine in vitro did not show any significant anti-oxidant properties per se [12], the observed ibogaine-associated increase in activities of antioxidant enzymes (cytosolic copper-zinc superoxide dismutase (SOD1), glutathione reductase (GR) [13] and catalase (CAT) [15]) in different in vitro [12] and ex vivo [13] model systems supported ibogaine as a pro/antioxidative agent. In previous work on yeast [11], elevated expres-sion of metabolic enzymes involved in glycolysis and of SOD protein were detected after 5 h at a dose of 1 mg/L ibogaine (equivalent to ibogaine levels found in brains of rats that received 20 mg/kg b.w., i.p.). However, among the proteins identified by matrix-assisted laser desorption/ionization-time of flight mass spectrometry (MALDI-TOF MS) that were induced after 24 and 72 h in brains of rats (that received 20 mg/ kg b.w., i.p.), SOD was not listed [14], suggesting spe-cies- and tissue-specific effects of ibogaine. Therefore, in our experiments we measured the activities of the antioxidant enzymes, SOD1, mitochondrial manga-nese superoxide dismutase (SOD2), CAT, glutathione peroxidase (GSH-Px) and GR after ibogaine in vivo,
per os (p.o.) application (1 or 20 mg/kg b.w.) after 6
and 24 h. Ibogaine has a blood half-life in humans ranging between 4-8 h, and the elimination half-life of ibogaine in humans is from 4-7 h [7,16-18]. Thus, the time point of 6 h in our experiments was the mean time of its half-life used to examine the expression of antioxidant enzymes in yeast (5 h).
In mammals, ibogaine is converted to its active metabolite, noribogaine (12-hydroxyibogamine). Studies in human subjects after single oral ibogaine administration showed its complex pharmacokinetic profiles. Ibogaine is cleared rapidly from the blood, and replaced by noribogaine [18]. However, ibogaine metabolism in the rat is different when compared to the human. Ibogaine is eliminated faster than noribo-gaine [1] and 24 h after p.o. administration about 65% of the ibogaine in rats [19], and even 90% in humans [7], can be eliminated via the urine and feces. Ac-cording to Bauman et al., 24 h after intravenous (i.v.) administration of ibogaine, noribogaine still persists in rat blood, unlike ibogaine, which can no longer be detected [20]. Therefore, in the present work, we also measured the concentration of both ibogaine and noribogaine in blood plasma.
Having in mind ibogaine pharmacokinetics, as well as its influence on both energy metabolism and the activity of antioxidant enzymes explored ex vivo
MATERIALS AND METHODS
Animals
All procedures complied with the EEC Directive on the protection of animals used for experimental and other scientific purposes and were approved by the Ethical Committee for the Use of Laboratory Animals of the Institute for Biological Research “Siniša Stanković”, University of Belgrade, No. 02-03/16. Male Wistar rats, 3-months of age, b.w. 290-320 g, were housed individu-ally under standard laboratory conditions day/night 12 h/12 h, at 22°C with free access to food and water.
Design of the experiment
Ibogaine hydrochloride (PubChem CID: 197059, pu-rity 98.93%) was a kind gift from the Sacrament of Transition, Maribor, Slovenia; ibogain hydrochloride (Remøgen, Phytostan Enterprises Inc., Canada, pu-rity 99.9%) was provided by Mara Bresjanac from the LNPR project funded by the ARRS Program P3-0171. Ibogaine was dissolved in dH2O by strong vortexing (at a stock concentration of 2 mg/mL) and maintained in the dark until use. The animals were divided into six groups (6 animals per group) and treated with one dose of ibogaine p.o. by gavage (1 or 20 mg/kg b.w.). The control groups were gavaged with an equal amount of dH2O. All animals received 1 mL of liquid (dH2O or ibogaine solution of appropriate concentration) per 100 g b.w. by gavage. The experimental groups were as follows: C6 – control treated with dH2O, decapitated after 6 h; C24 – control treated with dH2O, decapitated after 24 h; L6 – low dose ibogaine (1 mg/kg b.w.), de-capitated after 6 h; L24 – low dose ibogaine (1 mg/kg b.w.), decapitated after 24 h; H6 – high dose ibogaine (20 mg/kg b.w.), decapitated after 6 h; H24 – high dose ibogaine (20 mg/kg b.w.), decapitated after 24 h.
Blood preparation
When the rats were killed, blood was collected in trans-parent heparinized tubes (500 I.U. per mL of blood). Blood plasma was separated from erythrocytes by centrifugation (MiniSpin, Eppendorf, at 3000 x g, for 10 min) and stored at -20oC until analysis.
Erythro-cytes were washed three times with saline (0.9% w/w)
and stored at -20oC until use. Antioxidant enzymes
and XOD were measured in erythrocyte hemolysates (hemolyzed by ice cold dH2O).
Determination ibogaine and noribogaine concentrations in blood plasma
A validated liquid chromatography-tandem mass spec-trometry (LC-MS/MS) method [21] was used for the determination of ibogaine and noribogaine in blood plasma samples. Sample pretreatment consisted of simple protein precipitation with a double volume of acetonitrile. Plasma calibration standards were pre-pared by adding the appropriate amounts of working standard solutions and prazepam (internal standard) to drug free plasma. All samples and standards were treated adequately to prevent decomposition of ibo-gaine and noriboibo-gaine due to light exposure. The com-pounds (ibogaine, noribogaine and prazepam) were separated with gradient elution on Zorbax XDB-CN (75 mm x 4.6 mm i.d., 3.5 µm). The LC-MS/MS instru-ment consisted of the Agilent 1100 HPLC system and the tandem quadrupole mass spectrometer, Quattro micro™ API, from Waters, with an electrospray oper-ating in positive ionization mode. The software used was MassLynx 4.1. Two SRM transitions were acquired for ibogaine (311→174, 122), noribogaine (297→160, 122) and for the internal standard (325→105, 271). The calibration curves for both compounds in the plasma were linear in a prepared range from 0.1 to 100.0 ng/ mL, with a correlation coefficient of at least 0.996. The limit of quantification was 0.2 ng/mL.
Liver preparation
After decapitation, the liver was perfused with cold saline (0.9% w/w) and excised. A portion of the left lobe of the perfused liver was fixed in 4% parafor-maldehyde solution in phosphate buffered saline pH 7.4 for 24 h. The remaining liver tissue was frozen in liquid nitrogen and stored at -70°C.
Preparation of micrographs
AB, Göteborg, Sweden). Thin sections (5 μm) were cut on a rotary microtome (Leica, Germany), caught on glass slides and prepared for hematoxylin eosin (H&E) and Periodic Acid-Schiff (PAS) staining [22]. Hematoxylin dyes the nucleus blue, while the eosin dyes the cytoplasmic proteins, collagen and erythrocytes a reddish color. Glycogen granules in the cytoplasm are colored purple-magenta by the PAS staining method. Microscopic liver slides were examined using a Leica DM LS2 light microscope, and original photomicrographs were captured using a Canon PowerShot S70.
Qualitative analysis of the liver
The qualitative H&E analysis included histomorphologi-cal liver examination of the hepatic lobules, dilatation of the central vein, dilatation of portal vein branches, hepatocyte edema, the presence of necrosis, portal in-filtration of lymphocytes and plasma cells, hyperplasia of Kupffer cells and other pathological changes.
To compare the presence of glycogen in hepatocytes of animals from all experimental groups (quantitative analysis), the exact number of glycogen-positive cells was counted using a high-power field (HPF) at 400x magnifications of the areas (5 per each sample) around the central vein with the strongest glycogen signal. The presence of glycogen was expressed as the number of cells that contain glycogen per 100 cells.
Since the amount of glycogen in glycogen-positive cells can vary, in order to additionally clarify the ob-tained results, we classified each sample into one of three classes according to the average intensity of PAS staining (i.e. the amount of glycogen) in all cells in the examined fields of individual sample as follows: + (weak staining) – the amount of glycogen <33.3% of the maximum; ++ (medium staining) – the amount of glycogen 33.3-66.7% of the maximum; +++ (strong staining) – the amount of glycogen >66.7% of the maximum (semiquantitative analysis). The scale is in the range between 0%, which represents cells negative to PAS staining, and 100%, which represents cells with the maximal observed intensity of PAS staining in hepatocytes of all groups (cells full with glycogen), with boundaries placed on one third and two thirds of the scale. To ensure objectivity, all PAS staining slides were interpreted by three different coauthors, with the mean of their findings as the final result.
Determination of concentration of TBARS and -SH groups
For measuring the level of TBARS and total and non-protein free -SH groups, the perfused liver tissue was homogenized (3x10 s) and sonicated (3x15 s, at 10 kHz) in 0.05 M tris(hydroxymethyl)aminomethane (Tris), 1 mM ethylenediaminetetraacetic acid (EDTA) buffer, pH 7.4. The sonicates were centrifuged (MiniSpin, Eppendorf) for 15 min at 9000 x g. The level of lipid peroxidation in liver was estimated according to the concentration of TBARS measured in liver sonicates according to the method of Rehncrona et al. [23]. The supernatants were mixed with equal volumes of 0.6% 2-thiobarbituric acid and the mixtures were heated for 10 min at 95°C. The absorbance of the supernatant was measured at 532 nm spectrophotometrically on a Shimadzu UV-160 (Shimadzu Scientific Instruments, Shimadzu Corporation, Kyoto, Japan). The amount of TBARS was calculated using malondialdehyde as a standard.
The concentrations of total -SH groups were measured according to Ellman’s protocol customized for a mi-crotiter plate [24]. Supernatants were mixed directly on a microtiter plate with 0.1 M potassium phosphate buf-fer (pH 7.3) and 3 mM 5,5’-dithiobis-(2-nitrobenzoic acid (Ellman’s reagent). Measurements were performed 10 min after development of the yellow color. Absor-bance was measured at 412 nm (Multiskan Spectrum, Thermo Fisher Scientific Oy, Vantaa, Finland). For determination of non-protein free -SH groups, sul-fosalicylic acid was added before centrifugation and measurements were performed in the supernatant.
Determination of the activities of antioxidant enzymes, XOD and GST
autooxidation by 50%. CAT activity was measured by monitoring H2O2 consumption at 230 nm, according to Beutler [26]. Glutathione peroxidase (GSH-Px) activity was measured using t-butyl hydroperoxide as a substrate, by a modification of the assay described by Paglia and Valentine [27]. After the reaction of the substrate with glutathione (GSH) by sample GSH-Px, the remaining oxidized glutathione (GSSG) in the reaction mixture is reduced by GR that consumes NADPH. The method is based on the follow-up of the absorbance at 340 nm (absorbance peak of NADPH). The activity of GR was determined using the method based on NADPH oxidation and GSSG reduction [28]. The activity of GST was determined using 1-chloro-2,4-dinitrobenzene and GSH as substrates and monitoring the increase in absorbance at 340 nm [29]. XOD activity was determined by monitoring uric acid production in the presence of xanthine as a substrate, according to Terada et al. [30].
Measurement of hemoglobin concentration
Hemoglobin concentration in erythrocytes was mea-sured by the method of Drabkin [31].
Protein determination
The concentrations of proteins in liver samples were measured by the method of Lowry using bovine serum albumin as a standard [32].
Determination of the amounts of consumed food and water
At the end of the experiment, the amount of consumed food and water for each animal was measured and expressed as g (for food) or mL (for water) per h per kg b.w. The total volume of water consumed during the experiment was calculated as a sum of the volume that the animals have drank freely and the volume applied by gavage.
Determination of blood glucose concentration
Glucose concentration was measured in the whole blood immediately after decapitation using a Blood Glucose Test Strip TOUCH-IN® Micro, ApexBio (Taiwan).
Determination of urine parameters
Bilirubin, urobilinogen and urine specific gravity were determined using commercial strips, Uriscan urine test strips, YD Diagnostics (Yongin, Republic of Korea).
Data analysis and statistical procedures
Statistical analyses were performed according to the protocols described by Hinkle et al. [33]. The presence of glycogen in hepatocytes, the activities of antioxidant enzymes, XOD, GST, the concentrations of glucose, TBARS, the concentrations of total and non-protein free -SH groups and the amount of consumed food and water were compared by two-way ANOVA (ibogaine dose and time after treatment as factors), followed by Tukey’s HSD post hoc test. The statistical significance of the distribution of the intensity of PAS staining was calculated by the Kolmogorov-Smirnov χ2-test. The
significance level was p<0.05, with values expressed as the mean±standard error of the mean (SEM).
RESULTS
Concentration of ibogaine and noribogaine in blood plasma
Presence of glycogen and color intensity of PAS staining in the liver
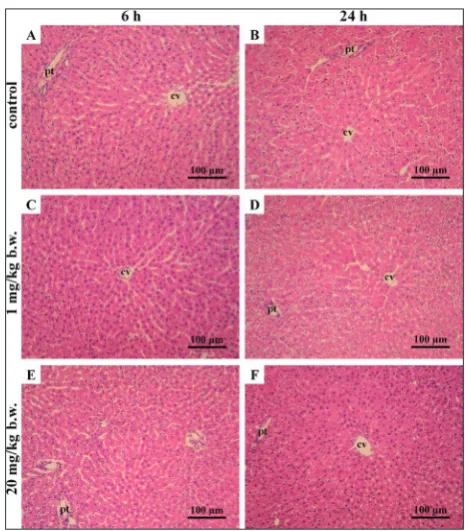
Histological analysis of the left lobe of livers by H&E staining (Fig. 1) revealed a normal liver morphology without any histopathological changes in all animals. Both control and treated H&E-stained livers presented the hexagonal structure of the classic lobule, without signs of necrosis, portal infiltration of lymphocytes and plasma cells, or of hyperplasia of Kupffer cells. PAS staining (Fig. 2) revealed a different proportion of glycogen-positive cells, as well as intensity of PAS staining (i.e. the amount of glycogen) of cells in the experimental groups. Analysis for the presence of gly-cogen in hepatocytes (Fig. 3) showed that the number of glycogen-positive cells per 100 cells was decreased in groups treated with 1 and 20 mg/kg b.w. of ibogaine (two-way ANOVA, effect of dose, p<0.001). Treatment with 1 mg/kg b.w. of ibogaine caused a decrease in
Fig. 1. Micrographs of rat liver after H&E-staining. Histomor-phological examination showed regular, hexagonal, lobular liver structure without histopathological changes. Group C (control groups): animals treated with dH2O, decapitated after 6 h (C6) – A, and after 24 h (C24) – B. Group L: animals treated with ibogaine 1 mg/kg b.w., decapitated after 6 h (L6) – C, and after 24 h (L24) – D; group H: animals treated with ibogaine 20 mg/kg b.w., decapitated after 6 h (H6) – E, and after 24 h (H24) – F. A-F: H&E staining, magnification: 200x. cv – central vein, pt – portal triads.
Fig. 2. Micrographs of rat liver after PAS-staining. Differences in the numbers of glycogen-positive cells and staining intensity of glycogen are shown in representative fields. Group C (control groups): animals treated with dH2O, decapitated after 6 h (C6) – A
and after 24 h (C24) – B; group L: animals treated with ibogaine 1 mg/kg b.w., decapitated after 6 h (L6) – C, and after 24 h (L24) – D; group H: animals treated with ibogaine 20 mg/kg b.w., de-capitated after 6 h (H6) – E, and after 24 h (H24) – F. A-F: PAS staining, magnification: 400x. cv – central vein. Example of a cell that contains glycogen are in circle.
the proportion of glycogen-positive cells after 6 h, which remained at the same level after 24 h. On the other hand, treatment with 20 mg/kg b.w. of ibogaine also caused a decrease after 6 h, followed by an even greater decrease after 24 h (two-way ANOVA, effect of time, p<0.05; interaction of dose and time, p<0.05; Tukey’s HSD test, H6 vs. H24, p<0.01). Analysis of in-tensity of the PAS-staining, i.e. the amount of glycogen (semiquantitative analysis) (Fig. 4) showed significant differences among the groups (Kolmogorov-Smirnov chi-squared test, p<0.001). In both control groups, all samples were classified as +++. Treatment with 1
mg/kg b.w. of ibogaine caused a decrease in staining intensity of glycogen after 6 h (three specimens were classified as + and three as ++), whereas after 24 h, the staining intensity of glycogen was slightly greater (two samples were classified as + and four as ++). However, treatment with 20 mg/kg b.w. of ibogaine also caused a mild decrease after 6 h (five specimens were classified as ++ and one as +++), followed by a greater decrease after 24 h (five specimens were clas-sified as + and one as ++).
Fig. 4. Intensity of PAS staining, i.e. amount of glycogen (semi-quantitative analysis). Each sample is classified in one of the three classes: + amount of glycogen <33.3% of the maximum; ++ amount of glycogen 33.3-66.7% of the maximum; +++ amount of glyco-gen >66.7% of the maximum. Group C (control groups): animals treated with dH2O, decapitated after 6 h (C6) – A, and after 24 h (C24) – B; group L: animals treated with ibogaine 1 mg/kg b.w., decapitated after 6 h (L6) – C, and after 24 h (L24) – D; group H: animals treated with ibogaine 20 mg/kg b.w., decapitated after 6 h (H6) – E, and after 24 h (H24) – F; body weight (b.w.). Statistical significance was calculated by the Kolmogorov-Smirnov chi-squared test; χ2 and p values are presented.
Concentration of TBARS and -SH groups and enzyme activities
While there were no observable changes in the con-centrations of total and non-protein free -SH groups (Table 1) in the liver, the concentration of TBARS was elevated in the L24 group (Fig. 5A). Two-way ANOVA revealed that XOD was higher in the livers of rats that received 20 mg/kg b.w. compared to the control, but the post hoc Tukey’s HSD test did not show any statistical significance among individual groups (Fig. 5B). There were no differences in the activities of an-tioxidant enzymes and GST in rat liver after ibogaine treatment, regardless of the dose used (Table 1). The same was found in erythrocytes, where the activity of
antioxidant enzymes was similar in treated animals compared to controls (Table 2). In erythrocytes, there was no difference in XOD activity among groups.
Amounts of consumed food and water, blood glucose concentration and urine parameters
There were no significant differences in the consump-tion of water and food. No difference in blood glucose concentration was observed after treatment with ibo-gaine, regardless of dose and time of observation (Table 3). There were no discernible changes in the bilirubin and urobilinogen levels or urine specific gravity in any of the treated groups when compared to the controls (data not shown).
Table 1. Activities of antioxidant enzymes (SOD1, SOD2, CAT, GSH-Px, GR), GST, XOD, concentration of TBARS, total and non-protein free -SH groups in the liver.
group time [h] [nmol/g TBARS liver]
total free –SH groups
[μmol –SH/L]
non-protein free –SH
groups [nmol–SH/L]
SOD1 [U/mg protein]
SOD2 [U/mg protein]
CAT [μmol H2O2/
min/ mg protein]
GSH-Px [nmol NADPH/
min/mg protein]
GR [nmol NADPH/
min/mg protein]
GST [nmol GSH/
min/ mg protein]
XOD [nmol uric
acid/min/ mg protein]
C 6 7.35±0.77 0.83±0.06 0.10±0.03 23.97±0.86 2.89±0.16 130.38±1.66 135.66±6.78 89.04±1.52 637.05±64.69 0.076±0.009 24 7.01±0.97 0.80±0.03 0.12±0.03 20.89±3.36 2.87±0.43 122.93±11.59 126.72±10.43 85.43±6.9 727.73±62.66 0.069±0.011 L 6 9.62±1.31 0.80±0.03 0.13±0.01 22.67±2.19 3.09±0.24 122.93±10.81 153.78±9.15 95.20±4.83 716.25±47.76 0.079±0.006 24 10.04±0.86* 0.84±0.05 0.13±0.02 23.39±2.73 2.24±0.25 169.32±1.84 136.40±8.75 81.95±4.77 629.80±29.21 0.107±0.009 H 6 7.95±1.22 0.84±0.03 0.12±0.03 21.12±2.78 2.32±0.10 160.48±26.41 148.62±7.68 91.48±3.61 744.73±26.41 0.114±0.007 24 9.34±0.59 0.81±0.04 0.12±0.01 22.84±1.81 2.49±0.19 137.28±9.95 142.43±13.95 85.22±6.10 679.32±71.00 0.105±0.016
two-way ANOVA F=5.37;dose:
p<0.05 ns ns ns ns ns ns ns ns
dose: F=7.02;
p<0.01
The control group (C) was treated with dH2O; groups treated with ibogaine were as follows: 1 mg/kg b.w. (L), 20 mg/kg b.w. (H).
Values are expressed as the mean±SEM. Results were compared by two-way ANOVA, dose and time as factors, p<0.05 and post hoc compared by Tukey’s HSD test; * represents Tukey’s HSD test significant difference compared to C24, p<0.05.
Nonsignificant – ns.
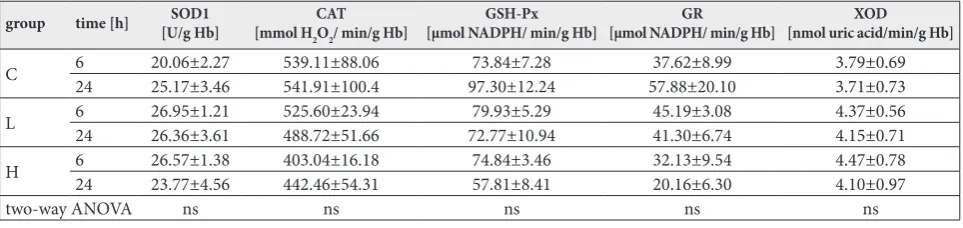
Table 2. Activities of antioxidant enzymes (SOD1, CAT, GSH-Px, GR), and XOD in erythrocytes. There were no significant changes between groups.
group time [h] [U/g Hb]SOD1 [mmol HCAT
2O2/ min/g Hb]
GSH-Px
[μmol NADPH/ min/g Hb] [µmol NADPH/ min/g Hb]GR [nmol uric acid/min/g Hb]XOD
C 624 20.06±2.2725.17±3.46 539.11±88.06541.91±100.4 97.30±12.2473.84±7.28 57.88±20.1037.62±8.99 3.79±0.693.71±0.73
L 624 26.95±1.2126.36±3.61 525.60±23.94488.72±51.66 72.77±10.9479.93±5.29 45.19±3.0841.30±6.74 4.37±0.564.15±0.71
H 6 26.57±1.38 403.04±16.18 74.84±3.46 32.13±9.54 4.47±0.78
24 23.77±4.56 442.46±54.31 57.81±8.41 20.16±6.30 4.10±0.97
two-way ANOVA ns ns ns ns ns
The control group (C) was treated with dH2O; groups were treated with ibogaine were as follows: 1 mg/kg b.w. (L), 20 mg/kg b.w. (H).
DISCUSSION
In spite of the existing knowledge about the molecu-lar mechanisms of ibogaine action and its effects on ROS and redox homeostasis, there is little published research about its various systemic in vivo oxidant/ antioxidant effects. It has been shown that ibogaine can act as a pro/antioxidant, promoting increased antioxidant activity in a dose- and time-dependent manner in different model systems, including yeast [11] and human erythrocytes [13]. However, our re-sults presented here show that liver and erythrocyte antioxidant enzyme activities after administration of ibogaine p.o. at doses of 1 and 20 mg/kg b.w. at 6 and 24 h post-application did not significantly differ from those in control rats. However, TBARS was elevated after application of 1 mg/kg b.w., suggesting a mild prooxidant and systemic effect that was insufficient to promote an increase in activities of antioxidant en-zymes to a measurable level. Our results also showed that ibogaine caused a depletion of glycogen in the liver, suggesting extensive utilization of glucose. In animals that received the low dose, ibogaine caused a depletion that was partially compensated at 24 h. On the other hand, in the liver of animals that received 20 mg/kg ibogaine, the depletion in liver glycogen was more profound at 6 h post-ibogaine administra-tion, and even greater after 24 h. It would appear that ibogaine increased overall tissue energy consumption, which was both time- and dose-dependent, confirming earlier results that showed ibogaine-mediated
deple-tion of cellular energy stores were followed by ATP re-synthesis and elevated ROS production, as well as restitution of energy homeostasis [11]. The degrees of change in these processes in vivo can be tissue-specific; however, if we take into account that there were no changes in blood glucose concentration, we can assume that ibogaine-associated tissue energy depletion was compensated from blood glucose that was maintained at a steady state via liver glycogen utilization. It has been reported that ibogaine itself can induce elevation of local cerebral glucose consumption [34], but at a higher dose and after a different route of application (40 mg/kg, i.p.). Thus, it would appear that the effect of ibogaine on glucose metabolism is tissue-, dose- and route-of-application-dependent.
No histopathological changes were observed in the liver after administration of either dose of ibo-gaine; however, we detected glycogen depletion. Urine analysis showed that the metabolic function of the liver was preserved. However, the higher dose of ibogaine induced a slight elevation in XOD that suggests a faster turnover of ATP and adenosine. The xanthine oxidase reaction can cause tissue injury in hypoxic organs due to increased superoxide, as well as enhanced adenine nucleotide breakdown that occurs during oxygen depri-vation. Faster turnover implies an elevated synthesis of uric acid that possesses significant antioxidant proper-ties so that ibogaine application can be considered as pro/antioxidative. Uric acid itself is a strong antioxidant and its elevation was found as a side effect of XOD prooxidant action during ischemia-reperfusion and hypoxia when intensive ATP depletion occurs [35-37]. Since no change in XOD activity was observed in the blood, it seems that the faster purine turnover was not systemic but only characteristic for the liver.
Measurements of ibogaine and noribogaine concen-trations in blood plasma revealed a pharmacokinetics that was generally consistent with earlier publications. In our experiment with animals treated p.o. (dose 1 mg/ kg b.w.), noribogaine was detected after 6 h, while the concentration of ibogaine was low, close to the thresh-old of detectability by the employed method. After 24 h, neither ibogaine nor noribogaine were detected in the plasma of rats treated with the low-dose, suggest-ing efficient metabolism of ibogaine and/or possible sequestration into adipose tissue and the brain. It was
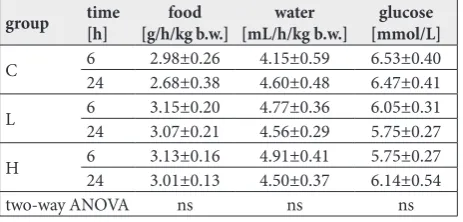
Table 3. Amount of consumed food and water, and blood glucose concentration. There were no significant changes between groups.
group time[h] [g/h/kg b.w.]food [mL/h/kg b.w.]water [mmol/L]glucose
C 624 2.98±0.262.68±0.38 4.15±0.594.60±0.48 6.53±0.406.47±0.41
L 624 3.15±0.203.07±0.21 4.77±0.364.56±0.29 6.05±0.315.75±0.27
H 6 3.13±0.16 4.91±0.41 5.75±0.27
24 3.01±0.13 4.50±0.37 6.14±0.54
two-way ANOVA ns ns ns
The control group (C) was treated with dH2O; groups were treated with
ibogaine were as follows: 1 mg/kg b.w. (L), 20 mg/kg b.w. (H). Values are expressed as the mean±SEM. Results were compared by two-way ANOVA, dose and time as factors, p<0.05 and post hoc compared by Tukey’s HSD test.
shown that ibogaine largely accumulates in adipose tis-sue and to some extent in the brain [38]. Ibogaine and noribogaine were detected in blood plasma after 6 h in the group treated with 20 mg/kg b.w. At 24 h following the 20 mg/kg b.w. of ibogaine, the plasma noribogaine concentration was 20 times higher than that of ibo-gaine. This is in accordance with the known ibogaine metabolism and pharmacokinetics [39]. Ibogaine is subject to a substantial “first pass” effect [38] and there is a significant difference in ibogaine metabolism even among humans [40,41]. The maximal concentration of ibogaine in blood or plasma and the time needed for ibogaine to reach its maximal concentration in the plasma are dependent on animal sex, dose and type of application (i.v., subcutaneous (s.c.), i.p. or p.o.) [20]. After i.v. application of 10 mg/kg to rats, the maximal concentration in whole blood (18.2 μg/mL) was at-tained already after 1 min [20], while after i.p. applica-tion of 40 mg/kg to rats, ibogaine reached the maximal concentration in whole blood (3.9 μg/mL) after 6 min [20]. In our experiment where ibogaine application was p.o., its incorporation was slower. Furthermore, after i.v. application ibogaine bypasses the first pass of liver-mediated detoxification. Hough et al. [38] revealed that in female rats, ibogaine (40 mg/kg) administered s.c. achieved a higher concentration in blood plasma after 1 h and 12 h when compared to its i.p. route of administration. After p.o. application of 5 mg/kg, the maximal concentration of ibogaine in the plasma was 10 ng/g (about 10 ng/mL) [19], but the time when ibogaine peaked was not reported. Having in mind that ibogaine peaks in blood plasma within 1-2 h after p.o. application in humans [18], the ibogaine concentration measured in our experiment after 6 and 24 h for both doses seems reasonable for this route of application. Moreover, it is clear that the maximal concentration attained in the blood or plasma after p.o. application is much lower compared to other types of application. Based on the pharmacokinetics described by Jeffcoat [19] and other authors [7,18,20,38,39], it is not possible to extrapolate precisely the blood plasma ibogaine and noribogaine concentrations from different graphs due to variations in animal models and treatments. Furthermore, Shrep et al. [8] suggested additional safety factors need to be applied to animal data prior to considering an appropri-ate and safe initial dose for humans.
Ibogaine is metabolized in the liver by the cyto-chrome P-450-dependent system and different classes
of GST that eliminate a broad spectrum of xenobiotics and final metabolic products [42]. Liver GSTs are in-ducible enzymes that follow liver xenobiotic metabo-lism. However, our results showed no changes in GST activity, suggesting that ibogaine could be metabolized before the time points when GST activity was mea-sured or when the treatment with ibogaine did not significantly affect the liver microsomal system. This assumption is supported by the fact that there were no changes in the concentration of GSH, as concluded based on the measurement of non-protein free -SH groups, which is a cofactor utilized during GST activity.
In our experiment, ibogaine did not affect food and water consumption. This is in agreement with the results of Rezvani et al. [43], who showed that ibogaine treatment (i.p., p.o.) with doses of 10, 30, and 60 mg/kg had no significant effect on food and water consumption.
In spite of the changes in liver glycogen, there were no changes in the activities of the studied antioxidant enzymes in either the liver or erythrocytes. At the doses used in our study, it seems that ibogaine did not provoke a significant antioxidative response either in the liver or at the systemic level. However, since ibo-gaine effects are rapid, it is possible that compensatory antioxidative activities by antioxidative enzymes were carried out soon after ibogaine administration, much earlier than at 6 or 24 h. Previous results from in vitro
studies on yeast [11,12], ex vivo data obtained in human erythrocytes [13] and isolated rat uterus [15] showed that antioxidant enzymes responded to an ibogaine challenge by changing their activities. Furthermore, previous results on yeast showed that 5 h is the time period necessary for ROS production to return to the normal cellular level after application of ibogaine at doses ranging from 1 to 20 mg/L [11]. Additionally, the liver has a greater antioxidant capacity compared to other tissues [44,45], and it seems that the applied doses were not sufficient to create a persistent anti-oxidant response at the level of antianti-oxidant enzyme activities after 6 or 24 h.
TBARS in the treated group after 24 h, implying that cell membranes were oxidatively attacked and dam-aged, yielding lipid peroxide byproducts. Ibogaine is a lipophilic molecule. There are membrane lipid rafts that store ATP [46]. In our earlier work [13], we showed that ibogaine addition to fresh whole blood (10 and 20 μM) releases ATP from erythrocytes within 1 h of incubation. The release of ATP from erythrocytes is accompanied by increases in SOD1 and GR activi-ties. However, our results showed that there were no changes in erythrocyte SOD1 and GR after 6 h or 24 h after the application of either dose. The much higher concentrations of ibogaine (3.1 μg/mL and 6.2 μg/ mL) applied in our earlier work on erythrocytes ex vivo [13], which were several times higher than the concentrations of ibogaine and noribogaine measured in blood plasma herein, could be the reason for the apparent absence of antioxidant effects of ibogaine on erythrocytes.
CONCLUSION
Our results confirm ibogaine-associated changes in tissue energy and its dose- and time-dependent redox-related actions. No overt pathological signs of damage to hepatic cells and tissue were detected. However, due to the different rates of rat and human metabolism, a linear extrapolation of results (and applied doses) from rat to human should be avoided. Since our research is based on doses used by humans, additional safety factors need to be applied to the animal data before recommending a safe initial dose for humans.
Funding: This study was supported by a grant from the Ministry of Education, Science and Technological Development of the Republic of Serbia, Project No: 173014 (“Molecular mechanisms of redox signaling in homeostasis, adaptation and pathology”), and by ARRS grant P3-0171 (M.B.).
Author contributions: D. Blagojević conceptualized and defined the research idea and created the research design; T. Vidonja Uzelac, N. Tatalović, Z. Oreščanin-Dušić, A. Nikolić-Kokić and M. Bres-janac searched the literature; D. Blagojević selected the statistical tests; T. Vidonja Uzelac and N. Tatalović performed most of the experiments, Z. Oreščanin-Dušić and A. Nikolić-Kokić assisted in the executaion of the experiments; G. Koželj designed the protocol and measured the concentration of ibogaine and noribogaine in plasma, M. Mijović performed the histopathological analysis, N. Tatalović and D. Blagojević performed the statistical analyses; T. Vidonja Uzelac wrote the first draft of the manuscript; D. Blagojević,
Z. Oreščanin-Dušić, N. Tatalović, M. Bresjanac, G. Koželj and M. Mijović wrote the second draft of the manuscript; A. Nikolić-Kokić and M. Bresjanac edited the manuscript.
Conflict of interest disclosure: The authors declare that there is no conflict of interests.
REFERENCES
1. Alper K. Ibogaine: A Review. Alkaloids Chem Biol. 2001;56:1-38.
2. Popik P, Layer R, Skolnick P. 100 years of ibogaine: neu-rochemical and pharmacological actions of a putative anti-addictive drug. Pharmacol Rev. 1995;47(2):235-53. 3. Alper K, Lotsof H, Kaplan C. The ibogaine medical
subcul-ture. J Ethnopharmacol. 2008;115(1):9-24.
4. Sheppard S. A preliminary investigation of ibogaine: case reports and recommendations for further study. J Subst Abuse Treat. 1994;11(4):379-85.
5. Global ibogaine therapy alliance [Internet]. Montreal: The Global Ibogaine Therapy Alliance; 2016. Clinical Guidelines for Ibogaine-Assisted Detoxification; 2016 Sep 11 [cited 2018 Nov15]. Available from: http://www.ibogainealliance. org/guidelines/.
6. Alper K, Lotsof H, Frenken G, Luciano D, Bastiaans J. Treat-ment of acute opioid withdrawal with ibogaine. Am J Addict. 1999;8(3):234-42.
7. Mash D, Kovera C, Buck B, Norenberg M, Shapshak P, Hearn W, Sanchez-Ramos J. Medication development of ibogaine as a pharmacotherapy for drug dependence. Ann N Y Acad Sci. 1998;844:274-92.
8. Schep L, Slaughter R, Galea S, Newcombe D. Ibogaine for treating drug dependence. What is a safe dose? Drug Alco-hol Depend 2016;166:1-5.
9. Leal M, Michelin K, Souza D, Elisabetsky E. Ibogaine atten-uation of morphine withdrawal in mice: role of glutamate N-methyl-D-aspartate receptors. Prog Neuropsychophar-macol Biol Psychiatry. 2003;27(5):781-5.
10. Glick S, Maisonneuve I, Kitchen B, Fleck M. Antagonism of alpha 3 beta 4 nicotinic receptors as a strategy to reduce opioid and stimulant self-administration. Eur J Pharmacol. 2002;438(1-2):99-105.
11. Paškulin R, Jamnik P, Obermajer N, Slavić M, Štrukelj B. Induction of energy metabolism related enzymes in yeast Saccharomyces cerevisiae exposed to ibogaine is adaptation to acute decrease in ATP energy pool. Eur J Pharmacol. 2010;627(1-3):131-5.
12. Paškulin R, Jamnik P, Danevčič T, Koželj G, Krašovec R, Krstić-Milošević D, Blagojević D, Štrukelj B. Metabolic plasticity and the energy economizing effect of ibogaine, the principal alkaloid of Tabernanthe iboga. J Ethnopharmacol. 2012;143(1):319-24.
14. Paškulin R, Jamnik P, Živin M, Raspor P, Štrukelj B. Ibo-gaine affects brain energy metabolism. Eur J Pharmacol. 2006;552(1-3):11-4.
15. Oreščanin-Dušić Z, Tatalović N, Vidonja-Uzelac T, Nesto-rov J, Nikolić-Kokić A, Mijušković A, Spasić M, Paškulin R, Bresjanac M, Blagojević D.The effects of ibogaine on uterine smooth muscle contractions: relation to the activity of antioxidant enzymes. Oxid Med Cell Longev. 2018;2018:5969486.
16. Mash D, Kovera C, Pablo J, Tyndale R, Ervin FR, Kamlet J, Hearn W. Ibogaine in the treatment of heroin withdrawal. Alkaloids Chem Biol 2001;56:155-71.
17. Kontrimaviciūte V, Mathieu O, Mathieu-Daudé J, Vain-auskas P, Casper T, Baccino E, Bressolle F. Distribution of ibogaine and noribogaine in a man following a poisoning involving root bark of the Tabernanthe iboga shrub. J Anal Toxicol 2006;30(7):434-40.
18. Mash D, Kovera C, Pablo J, Tyndale R, Ervin F, Williams I, Singleton E, Mayor M. Ibogaine: complex pharmacokinetics, concerns for safety, and preliminary efficacy measures. Ann N Y Acad Sci. 2000; 914:394-401.
19. Jeffcoat R, Cook C, Hill J, Coleman D, Pollack G. Disposition of [3H] ibogaine in the rat [abstract]. In: Harris L, editor. 55th Annual Scientific Meeting of the College on Problems of Drug Dependence; 1993 Jun; Toronto, Canada. Rockville: National institute on drug abuse; 1994. p. 309.
20. Baumann M, Rothman R, Pablo J, Mash D. In vivo neurobio-logical effects of ibogaine and its O-desmethyl metabolite, 12-hydroxyibogamine (noribogaine), in rats. J Pharmacol Exp Ther. 2001;297(2):531-9.
21. Koželj G. Development of an analytical method for the determination of alkaloids in biological samples. [disserta-tion]. [Ljubljana]: Faculty of Chemistry and Chemical Tech-nology, University of Ljubljana. 2015.
22. Luna LG. Manual of histologic staining methods of the armed forces institute of pathology. 3rd ed. New York: McGraw-Hill; 1968.
23. Rehncrona S, Smith D, Akesson B, Westerberg E, Siesjo B. Peroxidative changes in brain cortical fatty acids and phospholipids, as characterized during Fe2+- and ascorbic acid-stimulated lipid peroxidation in vitro. J Neurochem. 1980;34(6):1630-8.
24. Ellman G. Tissue sulfhydryl groups. Arch Biochem Biophys. 1959;82(1):70-7.
25. Misra H, Fridovich I. The role of superoxide anion in the autoxidation of epinephrine and a simple assay for superox-ide dismutase. J Biol Chem. 1972;247(10):3170-5.
26. Beutler E. Red cell metabolism: a manuel of biochemical methods. 3rd ed. NewYork: Grune and Stratton; 1982. 102 p. 27. Paglia D, Valentine W. Studies on the quantitative and quali-tative characterization of erythrocyte glutathione peroxidase. J Lab Clin Med. 1967;70(1):74-7.
28. Glatzle D, Vuilleumier J, Weber F, Decker K. Glutathione reductase test with whole blood, a convenient procedure for the assessment of the riboflavin status in humans. Experien-tia. 1974;30(6):665-8.
29. Habig N, Pabst M, Jakoby N. GST: 1st enzymatic step in mercapturic acid formation. J Biol Chem. 1974;249:7130-9.
30. Terada L, Leff J, Repine J. Measurement of xanthine oxidase in biological tissues. Methods Enzymol. 1990;186:651-6. 31. Drabkin D, Austin J. Spectrophotometric studies: II.
Prepa-rations from washed blood cells: nitric oxide hemoglobin and sulfhemoglobin. J Biol Chem. 1935;112:51-5.
32. Lowry O, Rosebrough N, Farr A, Randall R. Protein measurement with folin phenol reagent. J Biol Chem. 1951;193(1):265-75.
33. Hinkle E, Wiersma W, Jurs G. Applied statistics for behav-ioral sciences. 5th ed. Boston: Houghton Mifflin Company; 2002.
34. Levant B, Pazdernik T. Differential effects of ibogaine on local cerebral glucose utilization in drug-naive and mor-phine-dependent rats. Brain Res. 2004;1003(1-2):159-67. 35. de Groot H, Littauer A. Hypoxia, reactive oxygen, and cell
injury. Free Radic Biol Med. 1989;6(5):541-51.
36. Rosell M, Regnsrtom J, Kallner A, Hellenius M. Serum urate determines antioxidant capacity in middle-aged men- a con-trolled, randomized diet and exercise intervention study. J Intern Med. 1999;246(2):219-26.
37. Nikolić A, Mijalković D, Nikolić-Kokić A, Kastratović D, Blagojević D, Davidović B, Spasić M. Elevated serum uric acid reduce heart damage in patients undergoing open-heart surgery. Acta Chir Iugosl. 2006;53(3):29-33.
38. Hough L, Pearl S, Glick S. Tissue distribution of ibogaine after intraperitoneal and subcutaneous administration. Life Sci. 1996;58(7):PL119-22.
39. Dhahir H. A Comparative study of the toxicity of ibogaine and serotonin. [dissertation]. [Indiana]: School of medicine, University of Indiana. 1971.
40. Maciulaitis R, Kontrimaviciute V, Bressolle F, Briedis V. Ibogaine, an anti-addictive drug: pharmacology and time to go further in development. A narrative review. Hum Exp Toxicol. 2008;27(3):181-94.
41. Obach S, Pablo J, Mash D. Cytochrome P4502D6 cata-lyzes the O-demethylation of the psychoactive alkaloid ibogaine to 12-hydroxyibogamine. Drug Metab Dispos. 1998;26(8):764-8.
42. Glue P, Winter H, Garbe K, Jakobi H, Lyudin A, Lenagh-Glue Z, Hung C. Influence of CYP2D6 activity on the phar-macokinetics and pharmacodynamics of a single 20 mg dose of ibogaine in healthy volunteers. J Clin Pharmacol. 2015;55(6):680-7.
43. Rezvani A, Overstreet D, Lee Y. Attenuation of alcohol intake by ibogaine in three strains of alcohol-preferring rats. Pharmacol Biochem Behav. 1995;52(3):615-20.
44. Blagojević D, Buzadžić B, Korać B, Saičić Z, Radojičić R, Spasić M, Petrović V. Seasonal changes in the antioxidative defense in ground squirrels (Citelluscitellus): Possible role of GSH-Px. J Environ Pathol Toxicol Oncol. 1998;17(3-4):241-50.
45. Petrović V, Saičić Z, Spasić M, Radojičić R, Buzadžić B. Hor-mones and antioxidant defence. In: Nygaard OF, Lipton AC, editors. Anticarcinogenesis and Radiation Protection 2. New York: Plenum Press; 1991. p. 405-16.