A GREEN SYNTHESIS OF COLLOIDAL SILVER
NANOPARTICLES AND THEIR REACTION WITH OZONE
Franco Cataldo
[a,b]*, Ornella Ursini
[a], Giancarlo Angelini
[a]Keywords: silver nanoparticles; colloidal silver; NaBH4; tannic acid (tannin); ozone; oxidized silver nanoparticles
Colloidal silver nanoparticles were prepared by a conventional reduction of Ag+ ions with NaBH
4 and with a novel approach using tannic acid (tannin) as reducing agent of Ag+ ions. The formation of colloidal silver was followed by electronic absorption spectroscopy monitoring the growth of the surface-plasmon resonance band of the nanoparticles. Colloidal silver in tannin is more stable than that prepared with NaBH4 because tannin exerts also a protective colloid function permitting to reach much higher colloidal silver concentration than in the case of NaBH4. Colloidal silver nanoparticles are readily reactive with ozone producing oxidized silver nanoparticles composed by the mixed oxide Ag2O2 formulated as AgIAgIIIO2. If the ozonization is conducted in gentle conditions the oxidized silver nanoparticles remain as colloidal suspension for a certain time. If instead mechanical shaking is applied, the particles coagulate immediately and separate from the liquid medium as a precipitate.
* Corresponding Authors
E-Mail: [email protected]
[a] CNR–Istituto di Metodologie Chimiche, Area della Ricerca di Montelibretti, Via Salaria Km 29,300, 00016,
Monterotondo, Scalo, Rome, Italy
[b] Lupi Chemical Research srl, Via Casilina 1626A, 00133 Rome, Italy
Introduction
Metal nanoparticles sols such as silver and gold nanoparticles in water and in other media are known since long time as silver and gold colloids.1-6 These colloidal solutions are characterized by their color which today we know as due to surface plasmon resonance whose origin is attributed to the collective oscillation of the free conduction electrons induced by an interacting electromagnetic field form incident photon radiation.7 Another feature of these solutions regards the Tyndall effect which consists in the light scattering caused by the dispersed metal nanoparticles.6 In recent times, the interest on nanomaterials and their applications has re-awakened the attention on metal nanoparticles colloidal dispersion.8-10
The simplest way to produce a silver lyosol is by electrosputtering, a technique involving the submerged electric arc between two silver electrodes submerged into distilled water. The arc vaporizes the electrodes and the metal vapour is quenched under the form of nanoclusters inside the liquid medium surrounding the electrodes.6 The method is general and can be applied also to other metals other than silver. However the lyosol prepared in this way suffers from a certain instability because of the lack of a stabilizing electrolyte or other agent which must be added purposely. Also in recent times variants of the electrosputtering have been proposed involving water-submerged spark discharge11,12 as well as the submerged arc discharge.13
A less common method for the preparation of silver nanoparticles dispersion regards the use of high intensity
ultrasonic waves in order to fragmentate and disperse the metal particles.14 An approach which is not new, since was reported in literature since long time.15
The advent of the radiation chemistry led to the radiolytic reduction in solution of metal salts into colloidal solutions.16-18 This approach is currently in use for the production of metal nanoparticles dispersions.19,20 Photolysis21 and laser ablation are other approaches using electromagnetic radiation to produce metal nanoparticle dispersions in liquids.22
The preferred method for the production of metal colloidal solution in general and silver colloids in particular was and remains the chemical approach.6-10,23-26 Such a method consists in the addition of Ag+ ions to a solution of a reducing agent taking care to work at high dilution. A number of reducing agents are known as effective in the reduction of silver in a colloidal state. Tolaymat et al.8 have even made a complete statistics of the various methods used and among the chemical reduction the preferred approach regards the use of NaBH4 as the reducing agent followed by citrate, amines, formaldehyde and aldehydes, ascorbic acid, sugars and polysaccharides and hydrogen. The advantage of the chemical reduction of silver regards the fact that the reducing agent acts also as a stabilizer of the colloid. It is for example the case of citric acid and citrates or sugars and polysaccharides.8 A typical use of citrate reduction of Ag+ ions regards the preparation of silver nanoparticles useful for surface enhanced Raman scattering application.27
Experimental
Materials and Equipment
Silver nitrate (AgNO3) and sodium borohydride NaBH4 were analytical grades from Sigma-Aldrich. Tannic acid was obtained from Rhiedel de Haen. The electronic absorption spectra were recorded on a Shimadzu UV 2450 spectrophotometer.
Colloidal silver from AgNO3 reduction with NaBH4
Reference colloidal silver solutions were prepared following the procedure reported in ref.24 A solution of NaBH4 2.38x10⁻³ M was prepared and, separately, another solution of AgNO3 1.32x10⁻³ M. Then, 2 to 8 ml of the AgNO3 solution were added to 40 ml of NaBH4 under stirring. After the addition, the stirring was stopped and the electronic absorption spectra of the resulting yellow solutions were recorded. The following solutions were prepared:
#1: [Ag]colloidal = 8.25x10⁻⁵ M = 8.9 mg L-1 Stable
#2: [Ag]colloidal = 1.20x10⁻⁴ M = 12.9 mg L-1 Stable
#3: [Ag]colloidal = 1.72x10⁻⁴ M = 18.6 mg L-1 Unstable
#4: [Ag]colloidal = 2.64x10⁻⁴ M = 28.5 mg L-1 Unstable
The first two appeared indefinitely stable while the last two start to become turbid few hours after preparation and then become completely grey with evident silver sedimentation after 1 day from preparation.
Ozone treatment of the colloidal silver #2
An assay of 20 ml of solution #2 was transferred into a 500 ml flask. The flask was evacuated and the was filled with a mixture of O3 and O2 with the former 5% by mol in the gas phase. The colloidal solution was shaken in ozone and immediately it was bleached from the starting yellow color becoming slightly grey and turbid because of the resulting argentic oxide precipitation. In another test, 20 ml of solution #2 in 500 ml flask with O3/O2 was not shaken at all but just rolled up on the internal surface of the flask. Ozone reacted immediately with the silver particles causing a discoloration from yellow to water-white but this time there was no separation of oxidized silver because the solution was not shaken. However, on standing, after several hours, Ag2O2 separated from the aqueous phase also in this case.
Colloidal silver from AgNO3 and tannic acid
Tannic acid (35 mg) was dissolved in 150 ml of distilled water. From this stock solution 20 ml were diluted with distilled water to a final volume of 60 ml. Then K2CO3 (30 mg) were added to the 60 ml of tannic acid solution. The addition of potassium carbonate causes a slight darkening of the solution. To the 60 ml of tannic acid, the solution of silver nitrate 1.32x10⁻³ M was added. After the addition of
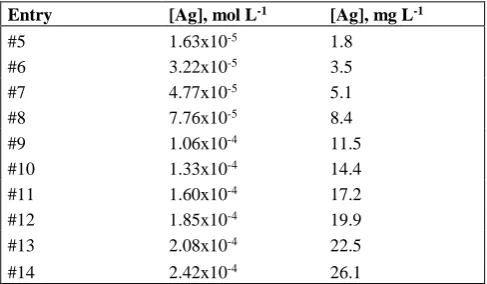
each ml of silver nitrate under stirring the spectrum of the solution was recorded. The following table reports the concentration of colloidal silver [Ag] present in the tannic acid solution after the gradual addition of silver. A gradual darkening of the solution was observed as function of the amount of silver added. The solution became brown and gradually dark-brown.
Table 1. Colloidal silver concentration in tannic acid solution
Entry [Ag], mol L-1 [Ag], mg L-1
#5 1.63x10⁻⁵ 1.8
#6 3.22x10⁻⁵ 3.5
#7 4.77x10⁻⁵ 5.1
#8 7.76x10⁻⁵ 8.4
#9 1.06x10⁻⁴ 11.5
#10 1.33x10⁻⁴ 14.4
#11 1.60x10⁻⁴ 17.2
#12 1.85x10⁻⁴ 19.9
#13 2.08x10⁻⁴ 22.5
#14 2.42x10⁻⁴ 26.1
Ozone treatment of the colloidal silver #14 in tannic acid
The solution #14 of colloidal silver in tannic acid is stable and dark-brown. To run the ozonolysis experiment, 30 ml of the solution #14 was diluted with 30 ml of distilled water. The resulting solution was charged into a 500 ml flask which was evacuated and the O3/O2 mixture was added into the flask which was shaken. This operation causes the immediate discoloration of the solution from brown to transparent but it appeared light turbid and grey for the separation of oxidized silver: Ag2O2. The same ozonolysis experiment was repeated again with a new diluted sample of #14 avoiding, this time, to shake the solution but just rolling the solution on the walls of the flask filled with the O3/O2 mixture. Also in this case the discoloration of the solution was complete without oxidized silver particles separation. Consequently the solution was water-white and not light grey as in the previous case when it was shaken. However, on standing, after several hours, Ag2O2 separated from the aqueous phase also in this case.
Results and Discussion
Colloidal silver from AgNO3 reduction with NaBH4
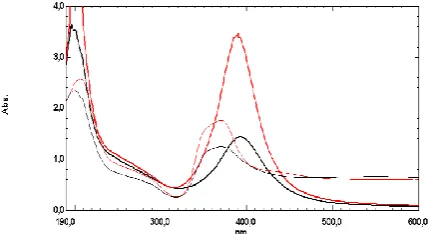
Figure 1. Electronic absorption spectra showing the surface-plasmon resonance of silver nanoparticles obtained by reduction of Ag+ with NaBH
4. The thick black and red curves were recorded respectively on solutions #3 and #4 immediately after preparation. The peaks are located respectively at 392.5 and 389.6 nm. The two solutions are unstable and after few hours from the preparation appear cloudy because of the separation of silver in larger particles. The two thin black and red curves refer to these aged #3 and #4 solutions. Note the growth of the baseline from 400 to 600 nm due to intense light scattering. Note also the alteration of the surface-plasmon resonance spectra which appear blue shifted to 370 nm and irregularly broadened.
However, the two solutions #1 and #2 having an [Ag]colloidal of 83 and 120 μmol L-1 respectively are indefinitely stable while the two solutions #3 and #4 [Ag]colloidal of 172 and 264 μmol L-1 respectively are unstable and after few hours from the preparation appear cloudy because of the separation of silver in larger particles. The two thin black and red curves shown in Fig. 1 were taken after the “ageing” of the #3 and #4 solutions respectively, when silver started to separate under the form of macroscopic particles and to precipitate. The evidence of silver separation from the solution is clearly suggested by the growth of the baseline of Fig. 1 (thin black and red lines) in the spectral range comprised from 400 to 600 nm due to intense light scattering. Note also the alteration of the surface-plasmon resonance spectra which appear blue shifted to 370 nm and irregularly broadened when silver clusters start to precipitate from the formerly colloidal suspension.
Action of O3 on colloidal silver solution prepared from Ag+ and
NaBH4
Metallic silver is reactive with ozone forming argentic oxide30 which is known to be a mixed Ag(I) and Ag(III) oxide31,32 AgIAgIIIO2 = Ag2O2 according to:
2Ag + 2O3 Ag2O2 + 2O2 (1)
Ag2O2 is a black and insoluble compound.30-32 When ozone is added to the colloidal silver nanoparticles its reaction with metallic silver according to the above mentioned reaction (1) leads to the immediate destruction of the surface-plasmon resonance band at 393 nm as shown in Fig. 2.
This is completely in line with the theoretical expectation since that band is due to the interaction between the conduction band electrons of the metal with the incident electromagnetic radiation. Since the metal is oxidized to the oxide Ag2O2, the conduction band electrons are no more available to interact with the electromagnetic radiation with the consequent disappearance of the band at 393 nm.
Figure 2. Electronic absorption spectra of the colloidal silver solution #2 showing the surface-plasmon resonance feature at 393 nm (thick violet curve). The thin red line is the resulting spectrum after the addition of O3 under mechanical shaking. The band at 393 nm is lost and a broad light scattering can be observed by the high baseline between 300 and 600 nm due to the separation of large oxidized silver particles. The thin green curve shows the product derived from the addition of O3 to solution #2 without shaking: the band at 393 nm is lost but the oxidized silver particles do not aggregate and do not precipitate remaining in the colloidal state.
Fig. 2 shows the spectrum of colloidal silver solution #2 before the ozone treatment with the band at 393 nm and after the ozone treatment, when that band disappeared and only a small and broad band at 265 nm can be observed. Fig. 2 documents also the addition of ozone to colloidal silver solution #2 under shaking, then the oxidized silver particles aggregate in larger particles and precipitate forming a turbid solution as testified by the increase of the baseline of the spectrum (red curve of Fig. 2) due to extensive light scattering caused by the separating solid particles. If instead O3 is reacted gently with colloidal silver solution #2 avoiding mechanical shaking, then the colloidal silver particles are oxidized but remain in colloidal suspension as shown by the green curve of Fig. 2 where no increase in the baseline is observed after the disappearance of the 393 nm band suggesting the absence of any aggregation and precipitation of the ozone-oxidized silver particles for a certain time.
Colloidal silver from AgNO3 reduction with tannic acid
Tannic acid or tannin is a essentially an hydroxylated polyphenol. Fig. 3 shows the electronic absorption spectrum of tannic acid solution (thick black line) which is characterized by an absorption maximum at 210 nm followed by the benzenoid band at 275 nm. In basic solution, after the addition of potassium carbonate, the benzenoid band of tannin appears at 323 nm (thick red line). As detailed in the experimental, silver ions were added to the alkalinized tannin solution and the spectra were taken immediately after each Ag+ addition and displayed in Fig. 3.
The growth of the colloidal silver band at about 410 nm (Fig. 3, see arrow pointing upward) is accompanied by the reduction of the intensity of the band at 323 nm due to the tannin (Fig. 3, see arrow pointing downward). The absorbance data at 410 and 323 nm are plotted in Fig. 4 and show the linear response to the Ag+ addition.
Figure 3. Electronic absorption spectra of pure tannic acid (thick black curve), tannic acid in presence of K2CO3 (thick red curve). The addition of silver ions to the tannic acid solution causes a gradual reduction of the band at 323 nm (as indicated by the arrow pointing downward) and the increase of a new band at about 413 nm due to the surface-plasmon resonance of the silver nanoparticles formed by the reduction of Ag+ (as indicated by the arrow pointing upward).
Figure 4. The addition of Ag+ to the alkalinized tannin solution causes a linear grow of the absorbance at about 410 nm due to the formation of metallic silver nanoparticles. At the same time, to the growth of the band at 410 nm corresponds the reduction of the absorbance at 323 nm due to the tannin. Note that the slope of [Ag]410nm ≈ -2[tannin]323nm.
It is curious to note that the slope of [Ag]410nm≈-2[tannin]323nm suggesting a possible stoichiometry between silver reduction and amount of tannin oxidized.
From the absorbance and [Ag]410nm concentration data of Fig. 4 using the Lambert and Beer law:
ε = A/bC (2)
it is possible to calculate the molar extinction coefficient (in L mol-1 cm-1) of the surface-plasmon resonance band of colloidal silver in tannin, being b = 1 cm the optical pathlength and C the concentration in mol L-1 of colloidal silver. All the experimental data of Fig. 4 lead to an ε = 15886 L mol-1 cm-1 (± 5.6%).
Another feature of the reaction between Ag+ and tannin regards the red shift of the surface-plasmon resonance band of the resulting colloidal silver. In fact, after the first silver addition the band of colloidal silver appears at 404 nm and is gradually shifted by the continuous silver ions addition to about 414 nm. These experimental data are shown in Fig. 5 and can be fitted with the power law:
λ = 397.1[Ag]0.0077 (3)
where λ is the position of the surface-plasmon resonance transition peak and [Ag] is the amount in (μmol L-1) of the silver ions added (assuming a compete conversion to colloidal metallic silver). Eq.3 implies that the limiting value of the maximum absorption of the surface-plasmon resonance is about 397 nm for the system silver/tannin and then it is red shifted by the continuous addition of silver.
Figure 5. The addition of Ag+ to tannin causes a gradual red shift of the surface-plasmon resonance of the resulting colloidal silver. This phenomenon is due to the growth of the dimension of the colloidal particles as function of the silver addition.
This phenomenon is due to the growth of the dimensions of the colloidal particles as function of the silver addition and it is well known and has been observed also in other cases of colloidal silver systems.16,20 After all, the continuous addition of Ag+ causes an increase in the dimensions of the colloidal particles which is reflected in the red shift of the surface-plasmon resonance band. Fig 5 shows that large part of the experimental values are comprised between 410 and 413 nm so that the spherical particles of colloidal silver may have a diameter comprised between 10-20 nm.20
The threshold of colloidal instability in the system formed from the reduction of Ag+ with NaBH4 lies above 120 μmol L-1 or above 13 mg L-1 of silver. In the case of silver colloid prepared by the action of tannin on Ag+, we have reached a concentration of colloidal silver of 242 μmol L-1 corresponding to 26 mg L-1 of silver, the double of the previous system without finding a threshold of instability which, evidently lies at higher concentrations. This implies that tannin is not only an effective reducing agent for the production of colloidal silver but it is also a powerful stabilizer of the colloidal silver, in other words it works also as a protective colloid.
Action of O3 on colloidal silver solution prepared from Ag+ and
tannin
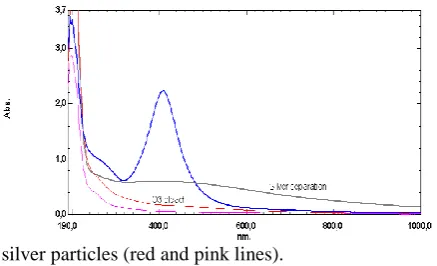
ozonolysis of the silver colloid without shaking leads only to the bleaching of the surface-plasmon resonance band but not to the coagulation and separation of the resulting oxidized
silver particles (red and pink lines).
Figure 6. Electronic absorption spectrum of colloidal silver in tannin (blue curve). The addition of O3 with mechanical shaking causes not only the disappearance of the surface-plasmon resonance band at about 413 nm but the separation of oxidized silver particles (grey line with high baseline and broad peak at about 400 nm). Instead the ozonolysis of the silver colloid without shaking leads only to the bleaching of the surface-plasmon resonance band but not to the coagulation and separation of the resulting oxidized silver particles (red and pink lines).
Conclusions
Tannic acid (tannin) an extract from plants and gall nuts is an almost non-toxic (LD100 = 6.0 g kg-1 per os, mice)29 reducing agent from renewable sources. It is effective in the reduction of Ag+ ions yielding colloidal silver solutions which are very stable even after very long storage time at relatively high silver concentration. A concentration of 242 μmol L-1 corresponding to 26 mg L-1 of silver is completely stable for months and probably higher colloidal siver concentrations can be reached without problems. On the contrary, colloidal silver prepared by a conventional reducing agent like NaBH4 is already unstable at concentrations above 120 μmol L-1 corresponding to 13 mg L-1. It is evident that tannin is not only a reducing agent but it exerts also a protective colloidal function against the colloidal silver particles which are maintained in the colloidal state even at relatively high concentrations. This aspect may be important in the potential use of colloidal silver stabilized with tannin as medicine or as disinfectant and sterilant. The colloidal silver prepared with tannin exhibits the typical surface-plasmon resonance band at about 413 nm with a molar extinction coefficient of 15886 L mol-1 cm-1. A dependence of the surface-plasmon resonance band position in the electronic spectrum with the amount of colloidal silver has been found also in the case of colloidal silver prepared with tannin, as observed also in other systems. The exposure of colloidal silver particles to ozone leads to a quick bleaching of the surface-plasmon resonance band and the solution turns from yellow to water-white. The reason of this is due to the high reactivity of silver with ozone which leads to the formation of Ag2O2.30-32 Consequently, the colloidal silver nanoparticles are converted into oxidized silver nanoparticles once exposed to ozone. If the ozonolysis is conducted in gentle conditions without shaking, the oxidized silver nanoparticles remain in the colloidal suspension for a while. Thus, it is quite easy to prepare a colloidal solution of oxidized silver nanoparticles:
it is only necessary to expose to ozone the colloidal silver particles. If instead the action of ozone on colloidal particles is conducted by shaking the solution with the gas, then the oxidized silver nanoparticles immediately coagulate together and separate from the solution as a dark-grey precipitate.
References
1Lettermoser, A., J. Prakt. Chem.,1903, 68, 357. 2Schaum, K., Lane, H., Kolloid Z.,1921, 28, 243.
3Guthier, A., Huber, J., Kuppinger, O., Ber. Deutsch. Chem. Ges.,
1922, 55, 748.
4Britzinger, H., Kolloid Z.,1937, 78, 22. 5Wiegel, E., Z. Phys.,1954, 136, 642.
6Voyutsky, S. “Colloid Chemistry” Mir Publishers, Moscow, 1978, Chapter 8.
7Link, S. El-Sayed, M.A. J. Phys. Chem., B, 1999, 103, 4212. 8 Tolaymat, T.M., El Badawy, A.M., Genaidy, A., Scheckel, K.G.,
Luxton, T.P., Suidan, M. Sci. Total Environ., 2010,408, 999.
9 Dallas, P., Sharma, V.K., Zboril, R., Adv. Colloid Interface Sci.,
2011, 166, 119.
10Murphy, C.J., Gole, A.M., Hunyadi, S.E., Orendorff, C.J., Inorg.
Chem.2006, 45, 7544.
11Tien, D.C., Tseng, K.H., Liao, C.Y., Tsung, T.T., Med. Eng.
Phys.,2008, 30, 948.
12Tien, D.C., Tseng, K.H., Liao, C.Y., Tsung, T.T., J. Alloys
Compds.,2009, 473, 298.
13Ashkarran, A.A., Current Appl. Phys.,2010, 10, 1442.
14Darroudi, M., Zak, A.K., Muhamad, M.R., Huang, N.M. Hakimi, M. Mater. Lett.,2012, 66, 117.
15Suslik, K. S. “Ultrasound. Its Chemical, Physical and Biological
Effects” VCH Publishers, Weinheim, 1989.
16Henglein, A., Chem. Mater.,1998, 10, 444. 17 Henglein, A., Meisel, D., Langmuir1998, 14, 7392.
18Henglein, A., Langmuir1999, 15, 6738.
19Choi, S.H., Lee, S.H., Hwang, Y.M., Lee, K.P., Kang, H.D.,
Radiat. Phys. Chem.,2003, 67, 517.
20Li, T., Park, H.G., Choi, S.H. Mater. Chem. Phys., 2007, 105, 325.
21Linnert, T., Mulvaney, P., Henglein, A., Weller, H., J. Am. Chem.
Soc.,1990, 112, 4657.
22Darroudi, M., Ahmad, M.B., Zamiri, R., Abdullah, A.H., Ibrahim, N.A., Sadrolhosseini, A.R., Solid State Sci.,2011, 13, 520.
23Guzmán, M.G., Dille, J., Godet, S. Int. J. Chem. Biomol. Eng.,
2009, 2:3, 104.
24Solomon, S.D., Bahadory, M., Jeyarajasingam, A.V., Rutkowsky, S.A., Boritz, C., Mulfinger, L. J. Chem. Educ., 2007, 84, 322.
25Petica, A., Gavriliu, S., Lungu, M., Buruntea, N., Panzaru, C.,
Mater. Sci. Eng. B,2008, 152, 22.
26Rai, M., Yadav, A., Gade, A., Biotechnol. Adv., 2009, 27, 76.
27Lucotti, A., Casari, C.S., Tommasini , M., Li Bassi, A., Fazzi, D., Russo, V., Del Zoppo, M., Castiglioni, C., Cataldo, F., Bottani, C.E., Zerbi, G., Chem. Phys. Lett. 2009, 478, 45.
28Steglich, W., Fugmann, B., Lang-Fugmann, S. (eds.) “Rompp
Encyclopedia of Natural Products” Georg Thieme Verlag,
29Budavari, S. (ed.) “The Merck Index” 12th Ed. Merck Research Laboratories, Whitehouse Station, 1996, p.9221.
30Thompson, N.R., “Silver” Chapter 28 in “Comprehensive
Inorganic Chemistry” edited by Bailar, J.C., Emeleus, H.J.,
Nyholm, R., Trotman-Dickenson, A.F., Pergamon Press, Oxford, 1973, Vol. 3, p. 119.
31Waterhouse, G.I.N., Bowmaker, G.A., Metson, J.B., Appl. Surf.
Sci. 2001, 183, 191.
32Waterhouse, G.I.N., Metson, J.B., Bowmaker, G.A., Polyhedron
2007, 26, 3310.