PROTOTYPE VALIDATION: COMPUTER AIDED
MAMMOGRAM MASS DETECTION AND SEGMENTATION
BY ENHANCED SEGMENTATION APPROACH
Dr.N. Venkatesa Mohan
Senior Assistant Professor Coimabtore Medical College and HospitalCoimabtore, Tamilnadu, India
Dr.Valliappan Raman
LecturerSwinburne University of Technology Sarawak
Kuching, Sarawak, Malaysia
ABSTRACT
Breast cancer is the most common cancer among women in the western world and in Asia, other than skin cancer. It is the second leading cause of cancer death in women, after lung cancer. Screening mammography (x-ray of the breast), is currently the most effective tool for early detection of breast cancer.
Rational and Objective: Detection of suspicious abnormalities (masses) within mammogram is a repetitive and fatiguing task. For every thousand cases analyzed by a radiologist, only 3 to 4 are cancerous and the rest could be overlooked. Therefore the main objective of this paper is to develop a CAD system to identify regions of interest and segment the tumors in digital mammograms. The segmented image is then analyzed for estimating tumor and the results are compared against previously known diagnosis of the radiologist
Materials and Methods: A fully automated Computer aided Detection (CAD) system is developed with main focus is to suppress noise, to enhance contrast between region of interest and background by enhanced segmentation, to extract and select mass\microcalcification features, detect and classify features of mammographic mass lesions and yet accurately detect the presence of breast cancer.
Conclusion: This paper shows the matlab prototype implementation and experimental results of various stages in detection and segmentation of the tumor. The overall segmentation accuracy obtained is 95%. This proposed method appears to be of high clinical significance since mass detection plays an important role in diagnosis of breast cancer.
General Terms
Computer Vision and Pattern Recognition, Medical Imaging,et. al.
Keywords
1.
INTRODUCTION
In many countries, breast cancer represents one of the main causes of death among women [18]. X-ray mammography is an effective diagnosis tool for detecting early-stage breast cancers. However, a heavy workload makes it difficult for radiologists to screen cancer cases efficiently because of observational oversights. The computer-aided diagnosis (CAD) system screens a large number of cases, thereby minimizing these observational oversights [1]. An effective CAD system, that clearly identifies position, size, and staging of lesions in x-ray mammographies, must be evaluated using a large number of reference images with approved diagnostics [2].
The detection of anomalies in mammographic images is made difficult by a great number of structures similar to the pathological ones, related also to tissue density. One of the abnormalities which are often a marker of a tumor is the presence of massive lesions, which are rather large objects with a diameter of the order of the centimeter and variable shapes.
In this paper we focus on segmenting the mass tumor by enhanced segmentation approach. Section 2 explains the background and research objectives are explained in Section 3. Section 4 explains the existing works of image enhancement segmentation and classification. Section 5 explains the proposed methodology to segment the mass tumor. Section 6 explains the feature extraction and selection. Section 7 explains the case base classification of tumor. Section 8 provides the experimental results and prototype validation of tumor segmentation. Finally conclusion is made at the Section 9.
2.
BACKGROUND
Mammography is the technique of choice to detect breast cancer and it is based on the difference in absorption of X-rays between the various tissue components of the breast such as fat, tumor tissue, and calcifications. Mammography has high sensitivity and specificity, even small tumors and micro calcifications can be detected on mammograms. The projection of the breast can be made from different angles. The two most common projections are medio-lateral oblique (side view taken at an angle) and cranio-caudal (top to bottom view), as shown in Figure 1.
Figure 1: Illustrates the Medio lateral and Cranio-caudal view [15]
The two most important signs of breast cancer that can be seen on a mammogram are focal masses and micro calcifications. In this paper we are mainly interested in focal masses. When a mass is present in a breast, a radiologist will estimate its malignancy by looking at the appearance of the lesion and the surrounding tissue. The most important sign of malignancy is the presence of spiculation i.e. spiky lines radiating in all directions from a central region extending into surrounding tissue. Benign masses have sharp, circumscribed borders where malignant masses have slightly jagged or spiculated borders. The objective of the research is to reduce the error of false negatives and false positives. The presented work will detect mass lesions by analyzing a single view of the breast. The first step detects suspicious locations inside the breast area. In the second step the image at these locations is segmented into regions and several features are calculated for each region. These features are being used to determine whether a lesion is benign or malignant. They are also used to eliminate false positive detections.
3.
OBJECTIVE
Primary Objective
To design and implement computer aided masses detection system by machine learning approach
Secondary Objective
To dertermine and validate the prototype
Place of study :Coimbatore Medical college Hospital.
Period of study:2013 - 2015.
Inclusion Criteria
Cases with abnormal shape in the mammogram image analysis society (MIAS) data base
Exclusion Criteria
Cases with microcalcifications and mass lesions.
Number of cases studied:100
a) To design and implement computer aided masses detection system by machine learning approach The implementation of mammogram mases detection component comprises of
Image enhancement: a process of digitization and preprocessing the mammogram to eliminate noise for better visual quality. The image need to be in good quality (finest) for the next component.
Image segmentation: a process to identify accurately each of distinct masses entity. There are 12-18 distinct mass haralic texture features are extracted from the segmented masses. The masses are important element as it input to the decision stage of breast cancer positive.
b) To determine and validate the prototype
The complete prototye is run for validation. It is a physical experimental of the prototype. Tasks include observation from radiologist, comparing from the result of the masses classification with the diagnosis given by the clinical biopsies. At the end we will have percentage of accuracy of the system in all aspect of masses observation the percentage of number of false positive detections, percentage of missing data and uncertainties, percentage of confidency of the classifiers respect to the data and etc.
4.
Literature Survey
Vibha L [9][13], proposes a method for detection of tumor using Watershed Algorithm, and further classifies it as benign or malignant using Watershed Decision Classifier (WDC).Experimental results show that this method performs well with the classification accuracy reaching nearly 88.38%. Serhat Ozekes.et.al [10] proposed to develop a new method for automated mass detection in digital mammographic images using templates. Masses were detected using a two steps process. First, the pixels in the mammogram images were scanned in 8 directions, and regions of interest (ROI) were identified using various thresholds. Then, a mass template was used to categorize the ROI as true masses or non-masses based on their morphologies. Each pixel of a ROI was scanned with a mass template to determine whether there was a shape (part of a ROI) similar to the mass in the template. The similarity was controlled using two thresholds. If a shape was detected, then the coordinates of the shape were recorded as part of a true mass. To test the system’s efficiency, we applied this process to 52 mammogram images from the Mammographic Image Analysis Society (MIAS) database [15]. The results of this experiment showed that using the templates with these diameters achieved sensitivities of 93%, 90% and 81% with 1.3, 0.7 and 0.33 false positives per image respectively. Rabi Narayan Panda.et.al [11], proposed technique is based on a three-step procedure: regions of interest (ROI) specification, two dimensional wavelet transformation, and feature extraction based on OTSU thresholding the region of interest for the identification of microcalcifications and mass lesions. ROIs are preprocessed using a wavelet-based transformation method and a thresholding technique is applied to exclude microcalcifications and mass lesions.
5.
Materials and Method
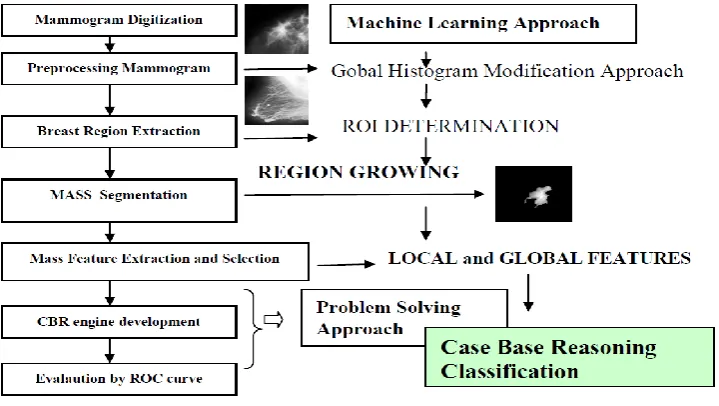
Segmentation is therefore extremely important because the diagnosis of a tumor can strongly depend upon image features [5]. First, the X-ray mammograms are digitized with an image resolution of 100 × 100 μm2 and 12 bits per pixel by a laser film digitizer. To detect microcalcifications on the mammogram, the X-ray film is digitized with a high resolution. Because small masses are usually larger than 3mm in diameter, the digitized mammograms are decimated with a resolution of 400 × 400 mm 2 by averaging 4 × 4 pixels into one pixel in order to save the computation time. After reducing the size of the image, enhancement is done using histogram equalization. After the digitization and enhancement of the X-ray mammograms, breast region is extracted from the decimated image [14] [17] [19]. The proposed methodology of CAD system comprised of machine learning and problem solving approach is shown in the figure 2.
Figure 2: Illustrates the proposed methodology of mass tumor segmentation
Figure 3: Illustrates the enhanced segmentation
5.1
Breast Boundary Detection
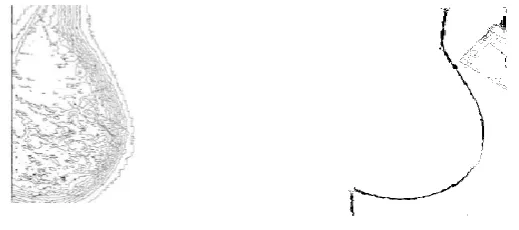
The first task is to extract the breast boundary. The breast region contains the edge outline which has various breast constituents bounded by breast boundary from the location of the background image. The major objective of performing this task is to determine the ROI of the breast region. ROI is important since it gives the focus area for mass segmentation phase in the next section. In extraction of ROI, two tasks are carried out. 1) The first is to detect the breast boundary; 2) The second is to remove the pectoral muscle. The breast boundary extraction is performed as follows: Start with extracting the edges from the output image and identifying the outermost edge line which leads to the edges of the breast. The first step is to look at the starting point for the enhanced image and then scan it from the right side to locate and position the first row in the image which is considered as the starting point of the processing. While processing the scan, look for the surrounding pixels in the clockwise order and compute the pixel with a high priority. Store the traversed pixels in Plotting List where it can be used for drawing boundary of the breast. The Plotting List contains the breast boundary pixels hat are plotted after smoothening for further processing. The pixel surrounded by starting pixel, which is considered as low priority pixel can be stored in Backtrack Stack. It is a list to store the pixels which are not significant for the process, if the traverse processes are reached in a dead stage. If the dead stage is reached, pixel will be removed from Backtrack Stack with less priority of pixel values and continue to proceed the traversal process until it reaches the bottom of the image, which highlights the breast region, the plotting list will keep the storage of all breast boundary pixels for smoothening and further processing to extract the breast boundary. Figure 4 shows the mammogram edge map along with derived breast contour.
Algorithm for Detecting Breast Boundary
Step 1: First to locate leftmost pixel of the breast, left side of images are scanned
Step 2: From the pixels, Vertical line is drawn from top to bottom which represents the boundary. Step 3: Edges are scanned from the right to left side of the image starting from the first row.
Step 4: Black pixels identified indicates the edge path moves the path of pixels by checking all the surrounding pixels and identifies the high priority pixels.
Step 5: If the pixel has low priority, it is stored in backward track. This is used when moving process has no pixels and becomes dead. Step 6: While reaching the dead end, move out from backtrack stack which have
lower priority and continue with moving process
Step 7: Visited pixels are stored in plotted area for drawing the boundary
Step 8: Visit continues to the next neighbouring pixels till it reaches the bottom end of the image.
Step 9: If it cannot reach the bottom of the image, path is cancelled and plot list will be deleted and start repeating it from Step 4. Step 10: First pixel is plotted and curve is drawn between two continuous pixels with certain set of interval, this process is continued till the last pixel is plotted in the plotting list.
5.2
Pectoral Muscle Removal
The second task is to remove the pectoral muscle. After detecting the mammogram edges from the boundary based detection methods, an image with breast region which has some difference from background is obtained. For further processing it is important to extract the breast region by eliminating the pectoral muscle region. When the mammogram images are read from MIAS database, all the images which have pectoral muscles have a unique intensity value that differs from the dense and rest of the fatty tissues of the image. It is also observed that the pectoral muscle located at the top left corner of the breast region (Right pair flipped horizontally during pre-processing) and it traverses from the top margin downward towards the left baseline of the mammogram image forming an inverted triangle. The objective is to identify this triangle from the breast region. First the outermost edge line that constitutes the edge of the Pectoral muscle is identified. It is observed that the largest inverted triangle in the edge map starting from the top margin and ending on the vertical baseline, of the breast region on the left side, is the pectoral region. Secondly the rightmost pixel of the breast region on the right side is identified and vertical line is drawn from the top margin to bottom margin, parallel to the left vertical baseline. Another line is drawn parallel to the top and bottom margin passing through the rightmost pixel of the breast region on the right vertical line and ending on the left vertical baseline. The search can be limited to the obtained rectangle thus reducing the processing time that would have incurred by considering the entire mammogram. It is also observed that almost all, barring a few mammograms, have the pectoral region confined within this rectangle. The results of mammogram edge map along with isolated pectoral boundary of MIAS database is shown in Figure 5.
Algorithm for Removal of Pectoral Muscle
Step 1: First the image is scanned to locate the right pixel of the breast region. Step 2: Vertical line is drawn from top to bottom of pixels in rows and column.
Step 3: In parallel horizontal line is drawn in the top margin where it passes by right row and column of the pixel. Step 4: Right vertical line is passed through the left line of the bottom of the image
Step 5: First row is scanned for the edges from right side to left, where it can form the rectangle.
Step 6: Black pixels will have edge path, move the path of the pixels by identifying the neighboring pixels which has higher priority. Step 7: If the pixel has low priority, it is stored in backward track, this is used when moving process has no pixels and becomes dead. Step 8: While reaching the dead end, move out from backtrack stack which have lower priority and continue with moving process. Step 9: Moving Pixels are stored in the plotting list which can be used pectoral
boundary drawings in later steps.
Step 10: Repeat the moves to next level of pixels when it reaches the left pixel end or the bottom.
Step 11: If rectangle is reached, then moving path is cancelled, stored plot list are removed and start continuing from Step 5. Step 12: If not get the stored pixels from plotting list and start plotting the first pixel.
Figure 5: illustrates the pectoral muscle removal
5.3
Breast region extraction
After the digitization and pre-processing of the X-ray mammograms, breast region Br is extracted from the digitized image. In general, the non-breast region of the digitized mammograms has a very low intensity and a maximum peak in the histogram. The threshold level Bt for the breast region is determined as follows:
t
B
I
max
2
.
5
bg (1)Where
I
max is the pixel intensity at the maximum peak count in the histogram of the decimated image and
bg is a standarddeviation of all pixel values less than
I
max under the assumption that the histogram of the background has Gaussian distribution centered atI
max.5.4
Region Partitioning
The purpose of region partitioning is to apply the different threshold values to each partitioned region. Therefore the region partitioning of the extracted breast region is identified. We adopted Otsu method of region partitioning for extracted breast region.
Assume that x(i, j) is the pixel of an image I at position (i, j) and that the gray level of the image ranges from 0 to L - 1. With a given
threshold t, the image can be partitioned into two regions,
R
0 andR
1. That is, if x (i, j) <= t, then (i, j) =R
0, otherwise, (i, j) ЄR
1.Probability functions of regions
R
0 andR
1.With respect to a given threshold t is given, respectively, as follows:
to x
x
p
t
W
0(
)
(2)
11
1
(
)
L
t x
x
p
t
W
(3)Where p(x) denotes the probability of gray level x in the image I. Gary level means and variances of region
R
0andR
1 is calculated as follows:
t
xp
x
W
t
t
x
0
0
0
(
)
/
t
xp
x
W
t
L t x
1 1 11
(
)
/
(5)
(
)
(
)
/
0(
)
2
0
0 2
0
t
x
t
p
x
w
t
t x
(6)
(
)
(
)
/
1(
)
2 1
1 1 2
1
t
x
t
p
x
w
t
L t x
(7)The in-class variance
w2(
t
)
and the between class variance
b2(
t
)
of these regions are described as:)
(
2
t
w
=W
0(
t
)
02(
t
)
W
1(
t
)
12(
t
)
(8))
(
2
t
b
=W
0(
t
)
W
1(
t
)(
0(
t
)
1(
t
))
2 (9)Therefore by combining the class variances, subjective function is determined and maximized optimum threshold value is calculated. We implemented this classification procedure for region partitioning of the breast region. At first we partition breast region Br in to
two regions i.e. fat region
R
0with gray level [O,T
1-1] and high intensity regionR
1with gray level [T
1, L-1] whereT
1 is obtained from breast region Br using calculated maximized optimum threshold values. Then we recursively partition the high intensity region and assign the regions to fatty and dense regions. Smaller regions are merged to a region enclosing them. After partitioning every pixel value x (i, j) are normalized according to the partitioned regions.5.5
Seed Selection
Selection of seed points is important and will influence the quality of the segmentation. Selecting one point allows only for the growing of one region, multiple points allows multiple regions to be grown. With our focus on breast-background segmentation, it is typical to choose to grow either the background or the breast itself. Therefore we want an initial seed point located in a broadly typical part of the background, or in a broadly typical part of the breast. Selection may be automatic, or may involve inviting the user to select a point. Automatic methods may involve both positional and intensity-based factors, such as selecting a pixel with a characteristic intensity in a region of the image which we know is likely to contain either breast or background.
When the breast region is partitioned into three regions, three sets of seed pixels are selected from the partitioned regions, respectively. Seed selection considers not only local maximum intensity value but also local contrast between a seed pixel and its neighbors. Let us
denote an ascending path P of length l between two normalized pixels
U
s andU
e in a partitioned region, which is a sequence of eight-neighbor connected pixels.Each pixel value
U
pk is the largest pixel within a 3 × 3 window centered atU
pk1 for 1< k <= l. Every pixel in the partitioned regions becomes a start pixel Us of a path and the end pixel Ue largest pixel in its eight neighbors. In order to compute a local contrast at the end pixel Ue, we define an intensity difference at Ue that is the difference between the start pixels us and the end pixel Ue as:Us
U
U
U
D
(
s e)
e
(10)Seed pixels for region growing are selected from the end pixels Ue by considering their normalized intensity and seed contrast value. Therefore seed pixels are selected for each partitioned regions and threshold values are also assigned.
5.6
Region Growing Segmentation
level mapping gives a sign of the switch between the absorption of pixels in the boundary of the current region and the absorption of pixels in the neighboring region. When the grown region size is equal to or greater than a minimum region size with the stopping condition such as speckle noise, touching previous region, new adjacent region, contrast limitation. Once the stopping condition is achieved, region growing is applied and it segmented.
6.
FEATURE EXTRACTION
After segmenting the masses in mammogram, The ROI hunter provides the “regions of interest” without giving further information. To this purpose suitable features should be selected so that a decision making system can correctly classify possible pathological regions from healthy ones. Feature extraction plays a fundamental role in many pattern recognition tasks. In this project 18 Haralick texture features (global and local features) are extracted from the segmented masses, currently nine are shown below. The criteria for the feature selection are based on morphological differences between lesions and healthy regions. In particular, the excessive lengthening is often symptom of absence of pathology while the loss of chaotic dynamics in the lesion structures can mark a tumor. In this paper nine features are extracted from the segmented masses and feed as the input for classification.
7.
CLASSIFICATION
Classifiers play an important role in the implementation of computer-aided diagnosis of mammography. The features or a subset of these features are employed by classifiers to classify mass into benign and malignant. Case Base Classifier is a classifier where the re-use phase can be simplified. The kernel in a Case-Based Reasoning system is the retrieval phase (phase 1). Phase 1 retrieves the most similar case or cases to the new case. Obviously, the meaning of most similar will be a key concept in the whole system. Similarity between two cases is computed using different similarity functions. For our purpose in this paper [14] [17], we use the similarity functions based on the distance concept. The most used similarity function is the Nearest Neighbor algorithm, which computes the similarity between two cases using a global similarity measure. Where Case_x, Case_y are two cases, whose similarity is computed; F
is the number of features that describes the case;
x
iy
i represent the value of the ith feature of case Case_x and Case_y respectively; andw
i is the weight of the ith feature. In this study we test the Minkowsky’s metric for three different values of r: Hamming distance (r = 1), Euclidean distance (r = 2), and Cubic distance (r = 3). This similarity function needs to compute the feature relevance (w
i) for each problem to be solved. Assuming an accurate weight setting, a case-based reasoning system can increase their prediction accuracy rate.8.
EXPERIMENTAL RESULTS
A total of 100 mammograms were considered for this study and experiment is at final stage. Mammogram data's have been taken from the MIAS database of mammograms containing cancerous masses. The mammograms are scanned from X-rays with a maximum resolution of 512x512 pixels. Mammographic image is reduced to an m × n matrix. This matrix contains as many rows, m, as the number of Mass present in the image, and as many columns (n=4) as the number of features that describe one mass. Next, this m × 4 matrix is transformed into a vector. This transformation computes the average value for each column (feature) across all the rows (mass in the image). Finally, the computed vector is labeled using the class (benign or malign) obtained from the diagnosis done by surgical biopsy. We performed two kinds of experiments in order to compare the performance of the different algorithms [14] [17] [19]. First, we maintained the proportion of original images - now, a set of features for each image- as training and test sets proposed by human experts. Thus, we compared the results obtained by other classifiers with those achieved by human experts, and the statistical modeling terms of classification accuracy. We also included in this comparison the true positive (malignant cases) rate of classified examples (sensitivity) and the true negative rate of classified examples (specificity) in below table 1.Figure 6-10 illustrates the results of mammogram mass segmentation by enhanced segmentation method.
100 200 300 400 500 600 700 800 900 1000 100
200 300 400 500 600 700 800 900 1000
20 40 60 80 100 120 20
40
60
80
100
120
20 40 60 80 100 120 20
40
60
80
100
120
20 40 60 80 100 120 20
40
60
80
100
120 20 40 60 80 100 120 20
40
60
80
100
120
Figure6: Illustrates the reduction of image size
STEP 2: Finding pixel with the maximum intensity in the centre point
Figure7: Illustrates the Seed pixel Identification
STEP 3: Automated Region Growing
Figure8: Illustrates the automated region with 4×4 neighborhood algorithm
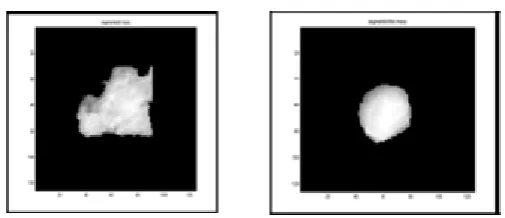
STEP 4: Mass Tumor Extraction
Figure10: Illustrates the benign and malignant mass extraction
Performance results
Table 1:illustrates the Classification Results (Sensitivity & Specificity)
The current results show that accuracy in our classifier schemes is higher than the accuracy obtained by the human experts and the statistical model.
9.
CONCLUSION
The proposed method which is based on several algorithms and combination provides excellent detection of mass tumor which has abnormal regions. The mass detection in mammogram images successfully detects the mass lesions with various contrasts. The strength of the proposed method is that it has automatic seed selection and seed region growing and each partitioned region have its own threshold values. The advantage of these methods is that to overcome the contrast and it is applicable to variation in mass sizes. The results achieved by the proposed method have a reliable detection on the abnormal regions in the mammograms, the proposed algorithm is simple to execute and faster compared to other difficult methods as explained in previous works. The proposed algorithm has been tested on all the mammogram MIAS mini database set. This algorithm could increase the ability of CAD in assisting radiologists in diagnosing breast cancers more accurately and efficiently.
10.
REFERENCES
[1] Landis S. H., Murry T., Bolden S.: Cancer Statistic 1998, CA-A Cancer Clinicians, 48, 6-30, 1998.
[2] Bird R. E., Wallance T. W. and Yankaskas B.C.: Analysis of Cancers missed at Screening Mammography, Radiology, 184, 613-617, 1992
Variant Not
Classified
SENSITIVITY %
SPECIFICITY
%
ACCURACY%
HAMMING 0.00 96 94 94.5%
CUBIC 0.00 90.1 93.5 92%
EUCLIDEAN 0.00 94.6 96.8 95%
[3] W. Zhang et.al,: An improved shift-invariant artificial neural network for computerized detection of clustered microcalcifications in digital mammograms, Medical Physics., vol. 23, pp. 595-601,(1998).
[4] S. M. Lai, X. Li, and W. F. Bischof,: On techniques for detecting circumscribed masses in mammograms, IEEE Transactions on Medical Imaging, vol. 8, pp. 377-386,(1989).
[5] N.Otsu,: A threshold selection method from gray-level histograms, IEEE Trans System Man Cabernet SMC-9, Pg 62–66, (1979).
[6] N.Petrick, H et.al,: Combined adaptive enhancement and region growing segmentation of breast masses on digitized mammograms, Medical Physics., Vol. 26, pp.1642-54, 1999.
[7] Tarassenko L., Hayton P., Cerneaz N., and Brady M.:Novelty detection for the identification of masses in mammograms, Fourth International Conference on Artificial Neural Networks, Cambridge, 442-447,1995.
[8] U. Bottigli, D.Cascio, F. Fauci, B. Golosio, R. Magro, G.L. Masala, P. Oliva, G. Raso, and S.Stumbo: Massive Lesions Classification using Features based on Morphological Lesion Differences, Proceedings of World Academy of Science, Engineering and Technology Volume 12 March 2006.
[9] Vibha L, Harshavardhan G M.: LESION DETECTION USING SEGMENTATION AND CLASSIFICATION OF MAMMOGRAMS, Proceedings of 25th IASTED Conference on AI and its Applications", Austria, Feb 2007
[10] SerhatOzekes, Onur Osman, A.YilmazÇamurcu.: Mammographic Mass Detection Using a Mass Template, Korean Journal of Radiology 6[4], December 2005
[11] Rabi Narayan Panda, Dr. BijayKetanPanigrahi, Dr. ManasRanjanPatro. : Feature Extraction for Classification of Microcalcifications and Mass Lesions in Mammograms, International Journal of Computer Science and Network Security, VOL.9 No.5, May 2009
[12] R.M. Haralick, K. Shanmugam, I.K. Denstein.: Textural Features for Image Classification, IEEE transactions on systems, man and cybernetics, vol. 3(6), 610-621, 1973.
[13] Giulia Rabottino, Arianna Mencattini, Marcello Salmeri, Federica Caselli, Roberto Lojacono: Mass Contour Extraction in Mammographic Images for Breast
[14] Cancer Identification, 16th IMEKO TC4 Symposium, Exploring New Frontiers of Instrumentation and Methods for Electrical and Electronic Measurements, Florence, Italy, 2008
[15] Raman Valliappan and Putra Sumari: Digital Mammogram Segmentation: An Initial Stage, in 4th IASTED International conference on Advanced Computing Science and Technology, Langawi, Malaysia, 2008.
[16] Mammogram Image Analysis Database, UK.
[17] Mohammed J. Islam et.al.: Computer-Aided Detection and Classification of Masses in Digitized Mammograms Using Artificial Neural Network, Lecture Notes in Computer Science, Volume 6146/2010, 327-33, 2010.
[18] Raman Valliappan, Putra Sumari and ManadavaRajeswari.: A Theoretical Methodology and Prototype Implementation for Detection Segmentation Classification of Digital Mammogram Tumor by Machine Learning and Problem Solving Approach. ISSN (Online): 1694-0814, IJCSI, Vol. 7, Issue 5, September 2010.
[19] National Cancer Patient Registry, Malaysia.
[20] Raman, V., Sumari, P., & Then, P, Matab Implementation and Results of Region Growing Segmentation Using Haralic Texture Features on Mammogram Mass Segmentation. In Advances in Wireless, Mobile Networks and Applications, 293-303. Springer Berlin Heidelberg, 2011.
[21] Ferlay J,Soerjomataram I, Ervik M, Cancer incidence and mortality worldwide: IARC Cancer Base No. 11[M/OL]. Lyon: Agency for Research on Cancer, 2013.
[22] Cancer statistics review, 1975–2011. Bethesda MD National Cancer Institute. 5. Chang Y, Hou-Jin C, Yong-Yi Y, Feng LY, Zhong HZ, et al, Microcalcification clusters processing in mammograms based on relevance vector machine with adaptive kernel learning. ActaPhysicaSinica 62: 088702, 2013.
[24] Rouhi R, Jafari M,Kasaei S, Keshavarzian P , Benign and malignant breast tumors classification based on region growing and CNN segmentation. Expert Systems with Applications 42: 990-1002, 2015.
![Figure 1: Illustrates the Medio lateral and Cranio-caudal view [15]](https://thumb-us.123doks.com/thumbv2/123dok_us/7832546.2089437/2.595.178.417.442.515/figure-illustrates-medio-lateral-cranio-caudal-view.webp)