Hydrogeoelectrical evaluation of groundwater flow pattern in a Basement Complex terrain,
Southwest Nigeria
Omowumi Ademila, Blessing Saloko
Department of Earth Sciences, Adekunle Ajasin University, Akungba-Akoko, Nigeria
Corresponding Author Email: omowumi.ademila@aaua.edu.ng
https://doi.org/10.18280/eesrj.050102 ABSTRACT
Received: 28 January 2018 Accepted: 7 February 2018
Heavy reliance on groundwater for potable water and increasing groundwater contamination from human activities in Supare Akoko has prompted this research work. The study examined the pattern of groundwater movement by combining hydrogeologic measurements and electrical resistivity survey in the area in order to identify the groundwater converging centres and to locate appropriate dumpsites. The hydrogeologic measurements involved static water levels measurement of 40 hand-dug wells while the electrical resistivity investigation involved a total of 40 geoelectric soundings using the Schlumberger electrode configuration. The results of the hydrogeologic measurements were presented as maps of 3-D surface elevation, static water elevation, groundwater head and groundwater vector. These maps revealed that groundwater flows from central, western and southeastern regions to the southwestern and northeastern parts of the area. Two types of aquifer, which are the weathered layer aquifer and weathered/fractured (unconfined) aquifer with resistivity values of 62 – 332 Ωm and 207 – 989 Ωm respectively, were delineated from the geoelectric parameters of the study area. Aquifer layer resistivity map revealed that groundwater flow directions are from the west and north into other parts of the area, towards the southwestern and northeastern parts. The values of the aquifer characteristics obtained were in the range of 2.88 – 437.4 m2/day for transmissivity, 1.2 – 40.5 m/day for hydraulic conductivity and 0.001 – 0.016 mS/m for electrical conductivity. The distribution of transmissivity values suggests the state of different aquifer systems in the area. These values when compared with international standards showed that the water in the aquifer is of high quality and yield from which long pumping can be maintained due to its capacity to regain water within a short period of time. A water scheme is proposed in the groundwater converging centres of the area to provide enough water for the people in the area. It is therefore recommended that dumpsites should be placed within the southern parts of the area in order to avert groundwater contamination. The inhabitants of the town must also be enlightened on the importance of ensuring a clean and hygienic environment around the source of their water to avoid associated health problems.
Keywords:
hydrogeologic measurement, electrical resistivity, groundwater flow pattern, groundwater head, transmissivity, aquifer
1. INTRODUCTION
Water is a major source of life due to its importance to man, plants and animals to survive, without which existence on earth would not be possible. Access to potable water is also a basic requirement for economic development. The safest kind of water supply is the use of groundwater due to the fact that it is less contaminated compared to surface water. It is not usually static but flows through saturated soils and rock masses. The ease with which water can flow through a rock mass depends on a combination of the size of the pores and degree to which they are interconnected [12]. Detailed knowledge and understanding of the groundwater flow patterns is essential to investigating the groundwater potential of an area, finding out the pattern of distribution of contaminants in order to offer dependable recommendations in locating good sites for waste disposal, distribution of vegetation and dam site for agricultural and industrial purposes.
Groundwater moves from areas of higher elevation or higher pressure/hydraulic head (recharge areas) to areas of
lower elevation or lower pressure/hydraulic head [4]. It usually flows towards and eventually drains into streams, lakes, rivers, seas, ponds and boreholes. The flow of groundwater in aquifer does not always reflect the flow of water on the surface. It is necessary to know the direction of groundwater flow to determine the recharge zones and make sure that human activities in the area do not pose threat to the quality of the groundwater to enable a sustainable use of the resources. The study area is a residentially developing area with attendant growing population arising from the establishment of the State University near the town. Unfortunatelly, water supply by the water corporation is not readily available. The inhabitants only rely on the surface water sources and groundwater extracted from hand dug wells as supplements. The surface water from streams, rivers and hand dug wells most of which are shallow and vulnerable to contamination. Groundwater developments therefore constitute a viable option for potable water provisions as citizens require access to significant quantities and high quality groundwater supply for their daily activities.
Environmental and Earth Sciences Research Journal
Vol.5, No.1, March, 2018, pp. 7-14
Groundwater applications of near-surface geophysics include mapping the depth and thickness of aquifers, mapping aquitards or confining units, locating preferential fluid migration paths and mapping contamination to the groundwater. Electrical method has proved particularly applicable to groundwater studies as the geological formation properties that are critical to hydrogeology can be correlated with electrical signatures. Geoelectrical resistivity method involving vertical electrical sounding has been used extensively to explore for groundwater and to determine the subsurface geologic sequences. Aquifer thickness, the size and degree of interconnection of pore spaces within the aquifer material affect estimation of groundwater resources and the ability of an aquifer to store and transmit groundwater [2], [17]. Using this method, depth and thickness of various subsurface layers and their water yielding potentials can be deduced. It also widely used to investigate aquifer boundaries and its location [1]; hydraulic conductivity [18]; transmissivity
[10]; groundwater contamination [7]. Groundwater is transmitted through a deep aquifer comprising unconsolidated weathered materials that form the overlying mantle or regolith [11]. The difference between the measured depth and the static water level gives the drawdown values used in estimating transmissivity. [15] applied the Singh method to calculate the parameters of confined aquifers and discovered that the transmissivity of the Kabul basin in Afghanistan was 94.16 m2/day. They reported that the method shows high reliability. Failure of boreholes and increasing groundwater contamination from shallow hand-dug wells in Supare Akoko have prompted this research as no detailed geophysical investigation for mapping groundwater flow pattern has been carried out in the area. Therefore, evaluation of groundwater flow direction at the area was done in order to identify the converging centres which are high groundwater yield zones and to locate appropriate dumpsites to avert contamination.
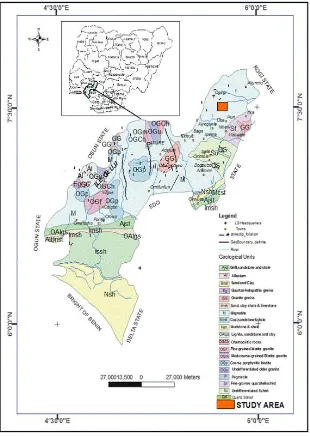
Figure 1. Geological map of Ondo State showing the study area
2. DESCRIPTION OF THE STUDY AREA (GEOLOGY AND HYDROGEOLOGY)
The study area is located within the North Senatorial district
a mean annual rainfall of over 1500 mm. The area is also characterized with a fairly uniform temperature and high relative humidity [13]. The inhabitants of this town are mainly indigenous of the town, students and government workers. This restricts their occupation mainly to farming, schooling and civil service. The area is drained by River Oyinmo, River Oyan and River Ose which are seasonal. The two rivers dominate the drainage system of the study area and it’s mainly dendritic. The area is moderately to highly undulating with an average surface elevation of about 359 m.
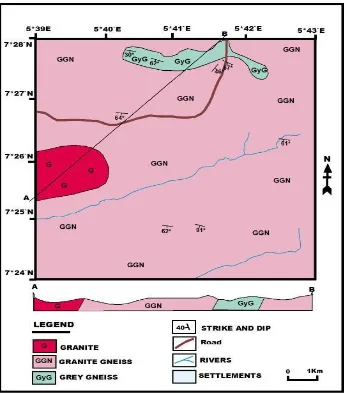
The area falls within the Precambrian Basement Complex rocks of southwestern Nigeria. It is underlain by migmatite-gneiss-quartzite complex with the granite gneiss being the major rock unit (Fig. 2) with minor amount of porphyritic granite and grey gneiss. Grey gneiss in the study area varies from light to dark grey. The granite rocks are of the older
granite suite. Sources of surface water supply to the study area are River Oyinmo, River Oyan and River Ose and their major tributaries. In basement complex area, groundwater is contained within the weathered and or fractured/jointed basement columns. The unconfined nature and the near- surface occurrence of the aquifer system makes it vulnerable to surface/near surface pollutants from waste dumpsites.
The increasing population, rapid expansion of town and inappropriate dumping of wastes into streams, rivers, water bodies and some parts of the study area could lead not only to pollution of groundwater resources but also soil pollution. Soil pollution may have negative effects on people living on it, roots of plants that penetrate into it and animals that move around over it, especially, when the groundwater flow direction of the underlying aquifers is not regarded.
Figure 2. Geological map of Supare Akoko
3. MATERIALS AND METHODS
Sampling sites for the hydrogeologic measurements were chosen with the aim of measuring static water levels from which static water elevations could be inferred. Static water level measurements of 40 hand-dug wells were taken across the study area. The depths to the water levels in the wells within the study area were measured with the aid of a water meter. A global positioning system (GPS) device was used at
delineated.
A total of 40 geoelectric soundings were carried out across the study area with a digital read-out ABEM SAS 1000 terrameter, using Schlumberger electrode array with half current electrode spread (AB/2) varying from 1 m to 65 m to 100 m depending on space availability and depth to bedrock. The vertical electrical sounding (VES) stations were placed near the hand-dug wells to enhance interpretation. The apparent resistivity values computed were plotted against the electrode spacing on a bi-log graph scale. The geoelectric sounding data were interpreted manually using the conventional partial curve matching technique involving the use of theoretical and auxiliary curves to obtain the initial model parameters [8], [9]. The geoelectric parameters (resistivities and thicknesses) were further refined using a forward modeling computer algorithm, WinRESIST Version 1.0 [20] to obtain the true resistivity and thickness of the various layers. The results were presented as curves distribution chart, map of aquifer layer elevation and map of aquifer layer resistivity.
4. DETERMINATION OF AQUIFER PARAMETERS FROM VES RESULTS
A geoelectric layer is characterized by layer resistivity (ρ) and thickness (h). Other parameters like transmissivity, Tri, hydraulic conductivity (K) and longitudinal conductance (S) can be derived from the respective resistivity and thickness of the ith layer. The layer transmissivity, is given as
Tri = Ki hi,
where Ki is the hydraulic conductivity of the ith layer of thickness hi. The relationship between aquifer transmissivity Tri and transverse resistance R and that between Tri and longitudinal conductance, S has been derived analytically by [14] as follows:-
Tri = Kσ, R = KS/σ (1)
According to [14], in areas where the geologic setting and water quality do not vary greatly the product Kσ remains fairly constant. The current flow through the pore space is conducted electrolytically through the interstitial fluid; hence electricity is controlled more by porosity and water than by the resistivity of the rock matrix. Thus, electrical path is similar to hydraulic path at the pore level and resistivity values should reflect this [10]. According to [10], groundwater should follow the path of least resistance; hence, aquifer resistivity values could be used to determine groundwater flow direction. Longitudinal conductance (S), gives a measure of the impermeability of a layer and it is given as:-
S = hi/ρi (2)
The relationship between aquifer resistivity, aquifer thickness and aquifer longitudinal conductance were derived using the following equation,
ρa = ha/Sa (3)
This is an equation derived by [3] for reducing multi-layers aquifer resistivities to a single representative resistivity value (ρa).
5. RESULTS AND DISCUSSION
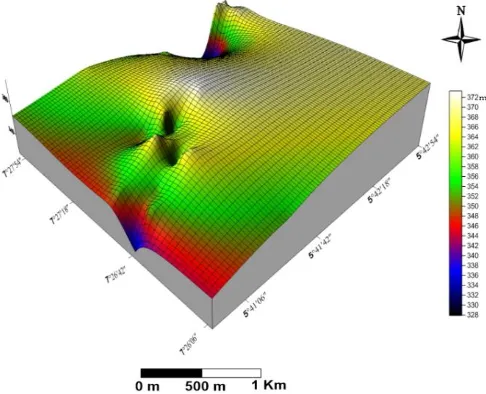
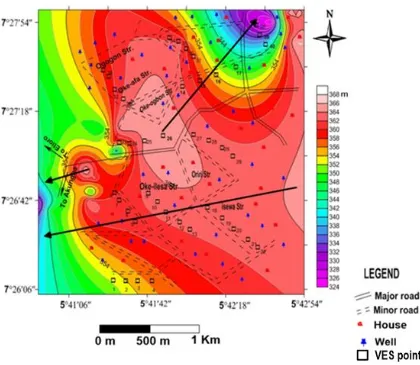
The 3-D surface elevation map (Fig. 3) and static water elevation map (Fig. 4) revealed the topography disposition of the area, the depressions are diagnostic of groundwater collecting centers within the study area. The static water elevation across the area ranged from 326 to 372 m. The Rivers (Oyinmo, Oyan and Ose) drain the area in the West-East direction at both the northern and southern parts of the area. The channels of these rivers constitute the lowest portion of the area which is indicative of the discharge zones in the area. Water usually flows from recharge areas to the discharge areas. Recharge areas are usually in topographical high places, while discharge areas are located in topographical lows [5], [6]. Areas around Oke-Ilesa and Oriri Street corresponding to topographic highs are expected to form recharge zones. There is usually a deep unsaturated zone between the water table and the land surface in the recharge areas. On the other hand in the discharge areas, the water table is either close to or at the land surface. In the field, vegetation and surface water can sometimes be used to locate discharge area which may manifest in the form of a spring, lake, seep or stream [5], [16]. Figures 5 (Groundwater head map of the study area) and 6 (Groundwater vector map) generated from the hydrogeologic measurement across the study area also showed recharge and discharge areas across the study area. The groundwater head map (Fig. 5) revealed that groundwater occurs at greater depth within central part, western and south eastern regions and occurs at shallow depth at the southwestern and the northeastern regions. This may be as a result of the outcropping basement rock and relative lower ground surface elevation along River Oyan at the north-eastern part of the study area. The presence of stream and river network is indicative that the zone corresponds to a discharge zone. Also, the groundwater vector map (Fig. 6) shown as vector grids revealed the groundwater flow direction with arrows showing the flow movement from higher elevation to lower elevation areas. Therefore based on the flow direction of groundwater in the study area, the converging zones (discharge areas) are high groundwater potential zones.
Figure 5. Groundwater head map of the study area
Figure 7. Curve types frequency distribution in the study area
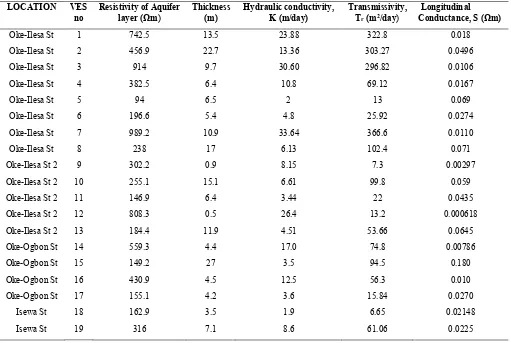
The summary of aquifer characteristics of the sounding stations is presented in Table 1. The transmissivity of the aquifers ranges from 2.88 – 437.4 m2/day and the hydraulic conductivity of the aquifers ranges from 1.2 – 40.5 m/day (Table 1). The distribution of transmissivity values suggests the state of different aquifer systems in the area. The transmissivity values indicate that long pumping can be maintained in the area. It also shows that the aquifers are high yielding and they can regain water within a short period of time. The aquifer electrical conductivity in the range 0.001 – 0.016 mS/m is below the limit of 250 µS/cm recommended by the United State Environmental Protection Agency [19] and indicates that the quality of groundwater in the area is high.
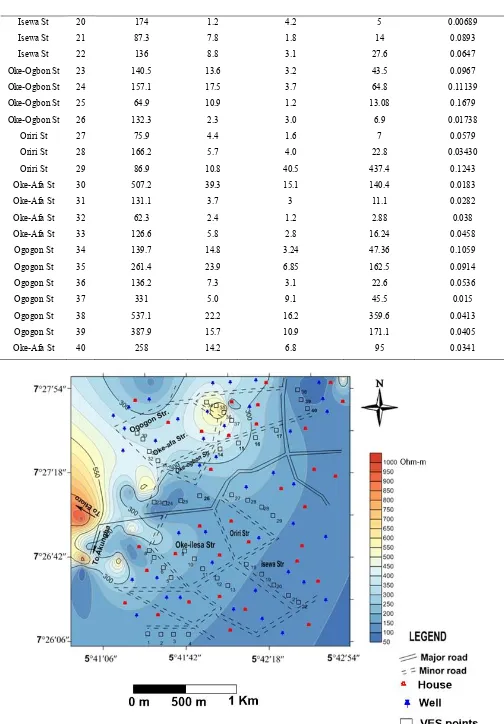
The sharp variations in resistivity values of some parts of the study area could be attributed to the inhomogeneous nature of the aquifers in the area and the water quality within the aquifers. Figure 7 shows the geoelectric curve type distribution in the study area. The VES curve types obtained include H, KH, Q, A, QH, HK, HA and K with the H-type (40%) dominating. Three to four subsurface geologic layers were delineated in the study area. These include the top soil, weathered layer, partially weathered/fractured basement and fresh basement with resistivity ranging from 30 –1710 Ωm, 62 –332 Ωm, 207 –989 Ωm and 1046 –4753 Ωm respectively. Two types of aquifers, which are the weathered layer aquifer and weathered/fractured (unconfined) aquifer were delineated. The weathered aquiferous layer is underlain by conductive layer composed of clay, sandy clay and clayey sand with resistivity values ranging from 62 to 332 Ωm while the other aquifer is composed of sandy clay, clayey sand and sand with resistivity values ranging between 207 to 989 Ωm, which is typical of the basement complex terrain. This is in agreement with the geology of the area that groundwater is contained within the weathered and or fractured/jointed basement columns which shows the unconfined nature of the aquifer system. The aquifer layer resistivity map (Figure 8) shows that resistivity values range from 50 – 1000 Ωm across the study area. The aquifer resistivity is high at the west and the northern part of the area with resistivity values above 350 Ωm. Groundwater flows within aquifer from higher resistivity to lower resistivity zones [10]. It could be deduced that groundwater flow from the west and northern regions of the area to other parts of the area, majorly towards the southwestern and northeastern parts.
Table 1. Summary of aquifer characteristics for all the sounding stations
LOCATION VES no
Resistivity of Aquifer
layer (Ωm)
Thickness (m)
Hydraulic conductivity, K (m/day)
Transmissivity, Tr (m2/day)
Longitudinal Conductance, S (Ωm)
Oke-Ilesa St 1 742.5 13.5 23.88 322.8 0.018
Oke-Ilesa St 2 456.9 22.7 13.36 303.27 0.0496
Oke-Ilesa St 3 914 9.7 30.60 296.82 0.0106
Oke-Ilesa St 4 382.5 6.4 10.8 69.12 0.0167
Oke-Ilesa St 5 94 6.5 2 13 0.069
Oke-Ilesa St 6 196.6 5.4 4.8 25.92 0.0274
Oke-Ilesa St 7 989.2 10.9 33.64 366.6 0.0110
Oke-Ilesa St 8 238 17 6.13 102.4 0.071
Oke-Ilesa St 2 9 302.2 0.9 8.15 7.3 0.00297
Oke-Ilesa St 2 10 255.1 15.1 6.61 99.8 0.059
Oke-Ilesa St 2 11 146.9 6.4 3.44 22 0.0435
Oke-Ilesa St 2 12 808.3 0.5 26.4 13.2 0.000618
Oke-Ilesa St 2 13 184.4 11.9 4.51 53.66 0.0645
Oke-Ogbon St 14 559.3 4.4 17.0 74.8 0.00786
Oke-Ogbon St 15 149.2 27 3.5 94.5 0.180
Oke-Ogbon St 16 430.9 4.5 12.5 56.3 0.010
Oke-Ogbon St 17 155.1 4.2 3.6 15.84 0.0270
Isewa St 18 162.9 3.5 1.9 6.65 0.02148
Isewa St 20 174 1.2 4.2 5 0.00689
Isewa St 21 87.3 7.8 1.8 14 0.0893
Isewa St 22 136 8.8 3.1 27.6 0.0647
Oke-Ogbon St 23 140.5 13.6 3.2 43.5 0.0967
Oke-Ogbon St 24 157.1 17.5 3.7 64.8 0.11139
Oke-Ogbon St 25 64.9 10.9 1.2 13.08 0.1679
Oke-Ogbon St 26 132.3 2.3 3.0 6.9 0.01738
Oriri St 27 75.9 4.4 1.6 7 0.0579
Oriri St 28 166.2 5.7 4.0 22.8 0.03430
Oriri St 29 86.9 10.8 40.5 437.4 0.1243
Oke-Afa St 30 507.2 39.3 15.1 140.4 0.0183
Oke-Afa St 31 131.1 3.7 3 11.1 0.0282
Oke-Afa St 32 62.3 2.4 1.2 2.88 0.038
Oke-Afa St 33 126.6 5.8 2.8 16.24 0.0458
Ogogon St 34 139.7 14.8 3.24 47.36 0.1059
Ogogon St 35 261.4 23.9 6.85 162.5 0.0914
Ogogon St 36 136.2 7.3 3.1 22.6 0.0536
Ogogon St 37 331 5.0 9.1 45.5 0.015
Ogogon St 38 537.1 22.2 16.2 359.6 0.0413
Ogogon St 39 387.9 15.7 10.9 171.1 0.0405
Oke-Afa St 40 258 14.2 6.8 95 0.0341
6. CONCLUSION
Major concern for quantity and quality groundwater has prompted investigation of the pattern of groundwater movement in the study area. The results of the hydrogeologic measurements and aquifer characteristics from geophysical data showed that groundwater within the study area flows from the centre, western and southeastern regions to the southwestern and northeastern parts of the area. These groundwater converging centres are high groundwater potential zones viable for groundwater development with high yield. Two types of aquifers, which are the weathered layer aquifer and weathered/fractured (unconfined) aquifer were delineated. This is in agreement with the geology of the area that groundwater is contained within the weathered and or fractured/jointed basement columns which shows the unconfined nature of the aquifer system. The transmissivity of the aquifers ranges from 2.88 – 437.4 m2/day and the hydraulic conductivity of the aquifers ranges from 1.2 – 40.5 m/day. The transmissivity values indicate that heavy pumping can be maintained in the area, as the aquifer can regain water within a short period of time. A water scheme to provide potable water for the people of the area is therefore proposed at these groundwater converging centres. This study displayed the applicability of geoelectric sounding in determining groundwater flow pattern in areas where there are little or no well from where hydrogeologic measurement could be made due to the correlation between their results. It is recommended that dumpsites should be placed within the southern parts of the area in order to minimize groundwater contamination. Also, regular monitoring of groundwater sources in the area should be carried out to prevent contamination of groundwater flow.
REFERENCES
[1] Al-Garni MA, Hassanein H, Gobashy M. (2006). Geophysical investigation of groundwater in Wadi lusab, Haddat ash sham area. Makkah al-mukarramah, Arab Gulf Journal of Scientific Research 24(2): 83-93. [2] Anomohanran O. (2013). Geophysical investigation of
groundwater potential in Ukelegbe, Nigeria. Journal of Applied Sciences 13: 119-125.
[3] Bhattacharya PK, Patra HP. (1968). Direct current geoelectric sounding, elsevier publishing company. Amsterdam, 135.
[4] Delleur JW. (1999). Handbook of Groundwater Engineering. In: J.W. Delleur (eds) Elementary Groundwater Flow and Transport Processes.
[5] Fetter CW. (2007). Applied Hydrogeology, 2nd ed. C.B.S. Publishers and Distributors, New Delhi India, 550, pp. 161-201.
[6] Gaarg SK. (2003). Physical and Engineering Geology, 4th Edition. Khana Publishers, 2-B Market, Nai Sarak, Delhi, pp. 330-351.
[7] Kaya GK. (2001). Investigation of groundwater contamination using electric and electromagnetic methods at open waste-disposal site, a case study from Isparta. Turkey, Environmental Geology 40: 725-731. [8] Keller GV, Frischknecht FC. (1966). Electrical method
in geophysical prospecting. Pergamon Press. Oxford, p. 523.
[9] Koefoed O. (1979). Geosounding Principles 1. Resistivity sounding measurements. Elsevier Science Publishing Company, Amsterdam.
[10] Kossinski WK, Kelly WE. (1981). Geoelectric sounding for predicting aquifer properties. Groundwater 9(2): 163-171.
[11] Morrisson BL, Lawrence ARL, Chilton PJC, Adams B, Calow RC, Klinck BA. (2003). Groundwater and its susceptibility to degradation: A global assessment of the problem and options for management. Early Warning and Assessment Report Series, RS. 03–3. Nairobi, Kenya: United Nations Environment Programme, p. 126. [12] Neilson DM. (1991). Groundwater Monitoring. Lewis
Publishers, Chelsea, Michigan, p. 717.
[13] Nigeria Meteorological Agency, (NIMET). (2007). Daily weather forecast on the Nigerian Television Authority, Nigerian Metrological Agency. Oshodi, Lagos, Nigeria.
[14] Niwas S, Singhal DI. (1981). Estimation of aquifer transmissivity from Dar Zarouk parameters in porous media. Journal of Hydrology 50: 393-399.
[15] Rajasekhar P, Vimal KP, Mansoor M. (2014). Determination of confined aquifer parameters by Sushil k. Singh method. American International Journal of Research Science, Technology, Engineering and Mathematics 5: 158-163.
[16] Singhal BBS., Singhal DC. (1986). Evaluation of Aquifer Parameters and Well Characteristics in fractured rock formation on Karnataka India University of Rookee, Rookie India, 351-363.
[17] Tizro TA, Voudouris KS, Kamali M. (2014). Comparative study of step drawdown and constant discharge tests to determine the aquifer transmissivity: The Kangavar aquifer case study, Iran. Journal of Water Resources and Hydraulic Engineering 3: 12-21. [18] Troisi S, Fallicos C, Straface S, Migliari E. (2000).
Application of kriging with external drift to estimate hydraulic conductivity from electrical resistivity data in unconsolidated deposits near Montato Uffugo, Italy. Hydrogeology Journal 8: 356-367.
[19] United States Environmental Protection Agency Drinking Water Standards and Health Advisories USEPA. Washington, DC. 2012. EPA 822-S-12-001. [20] Vander Velper BPA. (2004). Win resist version 1.0