© 2020 by the Serbian Biological Society How to cite this article: Jamali A, Sohrabi Y, Siose Mardeh A, HoseinpanahiF. 71 Morphological and yield responses of 20 genotypes of bread wheat to drought
stress. Arch Biol Sci. 2020;72(1):71-9.
Morphological and yield responses of 20 genotypes of bread wheat to drought stress
Ali Jamali, Yousef Sohrabi*, Adel Siose Mardeh and Farzad Hoseinpanahi
Department of Agronomy and Plant Breeding, Faculty of Agriculture, University of Kurdistan, Kurdistan, Iran
*Corresponding author: [email protected]
Received: November 28, 2019; Revised: December 17, 2019; Accepted: December 18, 2019; Published online: January 9, 2020
Abstract: The aim of this study was to select wheat genotypes most resistant to drought stress. The experiment was con-ducted at the research farms of the Faculty of Agriculture, Kurdistan University, Sanandaj, Iran, during 2014-2015 and 2015-2016. A randomized complete block design with three replicates using 20 genotypes of rain-fed wheat was applied. Cluster analysis of different wheat genotypes segregated the genotypes into 3 groups. Comparison between the groups in the first crop year revealed that the second and third groups exhibited the highest rate of radiation-use efficiency (RUE), and the first group had the lowest. Grain yield was highest in the third group and lowest in the first group, with an average of 219.87 g/m2 and 173.40 g/m2, respectively. In the second crop year, the highest rate of RUE was reported in the first group and lowest in the second and third groups. The highest grain yield was observed in the second group and the lowest in the third group (315.40 g/m2 and 253.75 g/m2, respectively). Based on the results of the biplot, high-yield genotypes in the first year of cultivation included G14 (263.00 g/m2), G20 (264.50 g/m2), G18 (214.00 g/m2) and G19 (222.50 g/m2). Based on the results obtained by cluster and PCA analysis under stress conditions, we concluded that several traits play a role in determining the grain yield of wheat.
Keywords: cluster analysis; principal component analysis; RUE; bread wheat; drought stress
INTRODUCTION
Drought is the most important limiting factor of wheat production across the world [1]. Drought stress in plants occurs when the transpiration rate from leaf surfaces is higher than water uptake by roots. Ter-minal drought that occurs during post-anthesis sig-nificantly reduces wheat grain yield due to induced grain abortion, and it affects grain filling, resulting in shriveled grain and a reduced grain yield [2]. Drought stress influences seed germination, seedling growth, dry matter partitioning and root growth, root depth and extension [3]. Grain yield in wheat mainly cor-relates with yield components and it has been reported that any reduction in a yield component leads to a reduction in the final yield. In Iran, the wheat grain filling period usually experiences drought stress [4]. Solar radiation is considered to be an environmen-tal resource for stable and effective crop production. Indeed, there is a positive relationship between crop yield and light absorption. Hence, crop yield can in-crease with increasing light use efficiency [5].
To study the yield and yield components of wheat grain, quantifiable traits such as grain number and weight and/or physiological components such as bio-mass and harvest index (HI) can be measured. Wheat grain yield has a strong relationship with grain number [7]. In some regions, especially in recent decades, grain weight has had an important role in the increase of wheat grain yield [8]. Grain number is mainly deter-mined by the number of surviving florets within spike-lets in parenthesis [9]. Spikelet dry weight of wheat is expressed as a function of spikelet growth duration, crop growth rate and biomass partitioning to spikes; the increase in any one of these traits in parenthesis aids spikelet growth and production of live florets [10]. Farnia and Tork [11] reported that drought stress nega-tively affected the yield of grain components, such as the number of ears per m2, 1000-kernel weight and
other traits such as 1000-kernel weight [12]. Fischer [10] pointed to a strong relationship between grain per m2 and total dry matter in wheat under drought stress
condition. Accordingly, It was shown that the end of season drought reduced grain yield [12].
Improvement of wheat yield has traditionally re-lied on direct selection for agronomic traits. There-fore, wheat breeders are always looking for sources that will contribute to improved grain yield. It is in-creasingly important to identify stable and high-yield wheat genotypes, considering the increase in world population and its demand for food, especially in de-veloping countries. Adding to the urgency of finding drought-resistant wheat is the water deficit in arid and semi-arid regions of world, and the long-term stress in these regions, including Iran. Therefore, this study was conducted to investigate the effect of some mor-phological and physiological traits on grain yield, with the aim of identifying the best genotype(s) in terms of grain yield and yield stability. To address this, 20 genotypes of bread wheat were studied under drought stress conditions in the province of Kurdistan.
MATERIALS AND METHODS Study site and experimental design
The experiment was conducted at the research farms of the Faculty of Agriculture, Kurdistan University, Sanandaj, Iran (35°37' N, 47°22' E, 1494 m a.s.l.) dur-ing two consecutive growdur-ing seasons, 2014-2015 and 2015-2016, October-June. A randomized complete block design with three replicates was used, and 20 genotypes of rain-fed wheat (Supplementary Table S1) were tested and compared under stress conditions. The meteorological characteristics of the study region are given in Supplementary Table S2.
Field preparation and plot establishment
Each experimental plot consisted of six rows, 6 m in length and 20 cm apart. Seeds were sown at a density of 400 seeds/m2 on November 20, 2014 and 2015.
Fer-tilizer recommendations were based on the results of soil analysis from experimental farms in Kurdistan. The amount of fertilizer used before sowing was about 50 kg N (urea) and 50 kg P (ammonium phosphate)/ha, (with potassium (K) being plentiful in the soil in Iran).
Measuring light absorption percentage and radiation-use efficiency (RUE)
In order to determine the percentage of light received by wheat, the light above and under the canopy was measured with a tube photometer (model LICOR-LI-250A) at five stages for each treatment. For each growth stage, light absorption percentage was deter-mined using the equation 1 [13]:
where Iabs=light absorption percentage, I0=light above canopy, I=light under canopy.
Radiation-use efficiency (g/Mj) was obtained via the slope of the linear regression between total biomass (g/m2) and total photosynthetically active
radiation absorbed by the plants canopy during the growing season [14].
Leaf relative water content (RWC)
Leaf relative water content was measured at solar noon on ten flag leaves at two growth stages (late booting, early grain filing). Ten leaves were cut from each plot at 8.00 a.m., weighed immediately (to obtain the fresh weight or FW), floated in the dark for 24 h to achieve and measure turgidity (turgid weight or TW), then oven-dried at 105°C for 24 h and weighed again (to obtain the dry weight or DW).
The water saturation deficit (WSD) of leaves was calculated as follows:
WSD=[(TW-FW)/(TW-DW)]×100%.
The relative water content (RWC) was calculated as follows:
RWC (%)=(FW-DW)/(TW-DW)×100.
Agronomic traits
At the end of the growing season (250 days after plant-ing on June 28), the final harvest was performed by harvesting the four middle rows once they reached physiological maturity. The plants within a 1-m2 area
were separated and washed with deionized distilled water. Root traits such as root length and root dry weight (RDW) were measured. The yield components such as ear per m2 and grain per ear were calculated
by counting the grains per ear. Grains were separated from the rest of the plant parts and grain yield and 1000-kernel weight were determined by weighing 1000 grains harvested in the 1-m2 area from each plot.
In order to determine the biologic yield, the wheat shoots were dried and the harvested plants of each plot (1 m2) were weighed on a digital scale. The dried
plants with grain yield represented the biologic yield. Harvest index was calculated according to the follow-ing formula:
Harvest index (%)=(Grain yield/Biologic yield)×100.
Statistical analysis
For all data, analysis of variance (ANOVA) was per-formed to test for differences between genotypes [15]. Differences among treatments were analyzed by a least significant difference (LSD) test at p≤0.05. Principal component analysis (PCA) was performed to visualize the similarities or differences in all traits under differ-ent drought stress (i.e. the first and second crop year), using SAS. The results of this analysis are presented as bi-plots. Clustering was performed in S-PLUS ver. 6.1 software (Insightful Corporation, USA) using Ward’s hierarchical approach based on the minimum vari-ance linking method with Euclidean distvari-ance as the similarity measure. Prior to cluster analysis, the semi-nal root data were standardized by subtracting the values for each genotype from the overall mean, then dividing by the standard deviation.
RESULTS
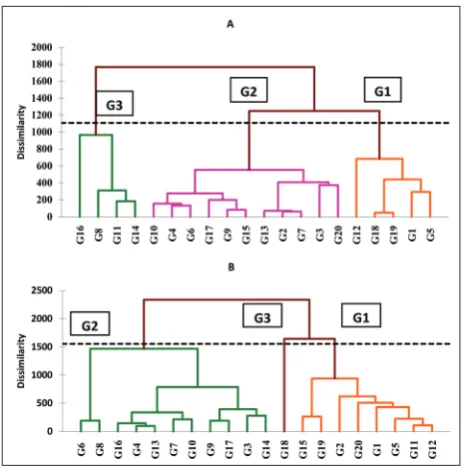
The results from the Bartlett test showed that for most of the studied traits there was a significant difference between the two crop years, hence the statistical analyses were performed on each crop year separately. Cluster analysis of the first year divided the 20 wheat genotypes into 3 groups as follows: 5, 11 and 4 geno-types in groups 1, 2 and 3, respectively (Fig. 1). In the second year, the genotypes formed three groups with 8, 11, and 1 genotype, respectively.
First crop year: mean comparison for cluster groups
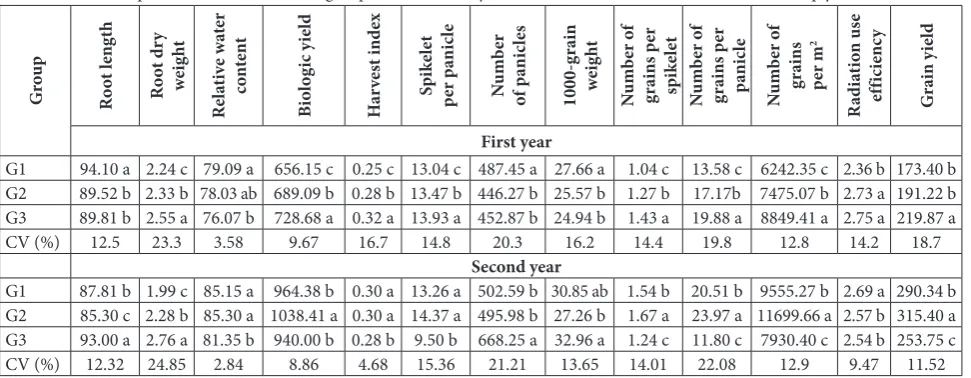
The mean comparison between the cluster analysis groups is shown in Table 1. The highest root length in the first group was 94.1 cm. Root length in the sec-ond and third groups did not differ significantly. The highest and lowest root DW was in the third and first group, respectively. RWC in the first group (79.09%) was as high as that in the second group (78.03%). The third cluster had the lowest relative water content (76.07%) and the highest biologic yield (728.6 g/m2).
The biological yield was lowest (656.1 g/m2) in the
third group. The highest and lowest HI was observed in groups 3 and 1, respectively. Spikelet per panicle was highest (13.93) in the third group and lowest in the first group (13.04). In addition, the highest and lowest number of panicles was observed in the third and first groups (13.93 and 13.04, respectively). The results of the mean comparison showed that the highest number of panicles was in the first group (487.45/m2) and
cantly different than the second group. The highest number of grains per spikelet was observed in the third group (1.43) and the lowest in the first group (1.04). The highest number of grains per panicle was observed in the third group (19.88) and the lowest in the first group (13.58). The highest and lowest number of grain per square meter was for the third (8849.41/m2) and
first (6242.35/m2) group, respectively. The rate of RUE
was similarly high in the second and third groups, and lowest in the first group. Grain yield was highest in the third group (219.87 g/m2) and lowest in the first group
(173.4 g/m2), which was not significantly different than
the second group (191.22 g/m 2).
Second crop year: mean comparison for cluster groups
Based on the results of the mean comparison between different groups, the highest root length was observed in the third group (93.0 cm) and lowest in the second group (85.3 cm; Table 1). The highest and lowest RDW was observed in the third (2.76 g) and first (1.99 g) group, respectively. The highest RWC was observed in the second group (85.3%), which was not significantly different than the first group (85.15%), and the lowest in the third group (81.35%). The highest biologic yield was in the second group (1038.41 g/m2) and the lowest
in the third group (940.0 g/m2), which was not
sig-nificantly different than the first group (964.38 g/m2).
There was no difference between the first and second
groups in terms of HI, which was 30% in both groups. The lowest HI (28%) was observed in the third group. The highest spikelet per panicle was in the first and second groups (14.37), and the lowest in the third group (9.5). The highest number of panicles was in the third group (668.25) and the lowest in the first (502.59) and the second (495.98) groups. The highest 1000-grain weight was seen in the third group (32.96 g) and the lowest in the second group (27.26 g). The number of grains per spikelet was highest in the sec-ond group (1.67) and lowest in the third group (1.24). The highest number of grains per panicle was in the second group (23.97) and was lowest in the third group (11.80). The number of grains per square meter was highest in the second group (11699.66/ m2) and lowest
in the third group (7930.40/m2). The rate of RUE was
highest in the first group (2.69) and lowest in the sec-ond and third groups (2.57 and 2.54, respectively). The grain yield was highest in the second group (315.40 g/m2) and lowest in the third group (253.75 g/m2).
Principal component analysis
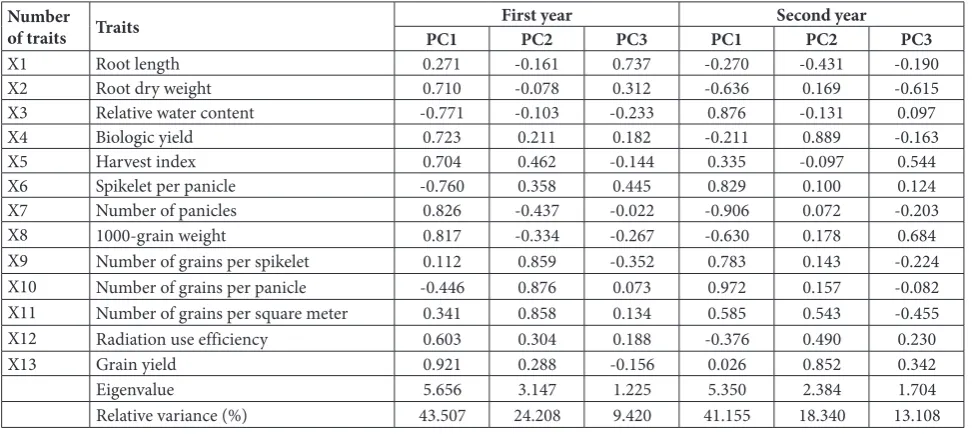
The results of the PCAbased on all traits are shown in Table 2. In the first year there were 3 components with eigenvalues greater than 1: the first, second and third components had eigenvalues of 5.65, 3.14 and 1.22, respectively. Together, these 3 components accounted for 77.13% of the total variance. Individually, the first, second and third components had a relative variance Table 1. Mean comparison between different groups of cluster analysis based on different studied traits at two crop years.
Grou p Ro ot le ng th Ro ot dr y we ig ht Re la tiv e wa te r co nt ent Bio lo gic y ie ld H ar ves t ind ex Spi ke le t pe r p ani cl e N umb er of p ani cl es 1000-g ra in we ig ht N um be r o f gr ains p er sp ik el et N um be r o f gr ains p er pa ni cl e N um be r o f gr ains per m 2 Radi at io n us e ef fic ien cy G ra in y ie ld First year
G1 94.10 a 2.24 c 79.09 a 656.15 c 0.25 c 13.04 c 487.45 a 27.66 a 1.04 c 13.58 c 6242.35 c 2.36 b 173.40 b G2 89.52 b 2.33 b 78.03 ab 689.09 b 0.28 b 13.47 b 446.27 b 25.57 b 1.27 b 17.17b 7475.07 b 2.73 a 191.22 b G3 89.81 b 2.55 a 76.07 b 728.68 a 0.32 a 13.93 a 452.87 b 24.94 b 1.43 a 19.88 a 8849.41 a 2.75 a 219.87 a
CV (%) 12.5 23.3 3.58 9.67 16.7 14.8 20.3 16.2 14.4 19.8 12.8 14.2 18.7
Second year
G1 87.81 b 1.99 c 85.15 a 964.38 b 0.30 a 13.26 a 502.59 b 30.85 ab 1.54 b 20.51 b 9555.27 b 2.69 a 290.34 b G2 85.30 c 2.28 b 85.30 a 1038.41 a 0.30 a 14.37 a 495.98 b 27.26 b 1.67 a 23.97 a 11699.66 a 2.57 b 315.40 a G3 93.00 a 2.76 a 81.35 b 940.00 b 0.28 b 9.50 b 668.25 a 32.96 a 1.24 c 11.80 c 7930.40 c 2.54 b 253.75 c
CV (%) 12.32 24.85 2.84 8.86 4.68 15.36 21.21 13.65 14.01 22.08 12.9 9.47 11.52
of 43.5%, 24.20% and 9.42%, respectively. For the first component, the traits with the highest load factor in-cluded RDW, RWC, biologic yield, HI, spikelet per panicle, number of panicles, 1000-grain weight, RUE and grain yield. For the second component, the traits with the highest load factor were the number of grains per spikelet, the number of grains per panicle and the number of grains per m2. Root length had the highest
factor load in the third component.
The results of the PCA based on all the traits were slightly different in the second year. The first 3 com-ponents with an eigenvalue greater than 1 were 5.35, 2.38 and 1.7, respectively. In total, the 3 components contributed to 72.60% of the total variance. The first component had the highest variance (41.15%) and the second and third had variances of 18.34% and 13.10%, respectively. In the first component, the traits with the highest load factor were RDW, RWC, spike-let per panicle, the number of panicles, 1000-grain weight, the number of grains per spikelet, the number of grains per panicle and the number of grains per m2.
In the second component, the traits with the highest load factor included biologic yield and grain yield. In the third component, RDW, HI and 1000-grain weight had the highest load factor.
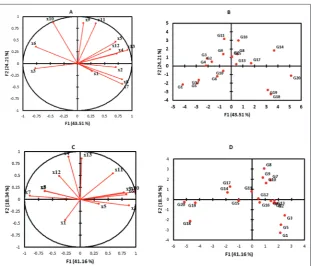
Based on the bi-plot chart of the first year (Fig. 1), genotypes G14, G16, G17, G13, G15, G7 and G8 formed one group. Moreover, grain yield, biologic yield, RUE, HI, number of grains per m2 and the number of
grains per spikelet were classified into 1 group, which was strongly associated with genotypes G14, G16, G17, G13, G15, G7 and G8. Genotypes G11, G9, G3, G2 and G4 formed another group, which was strongly related to the number of grains per panicle and spikelet per panicle. Genotypes G10, G6, G12, G5 and G1 formed an adjacent group and were associated with the relative water content. Genotypes G20, G18 and G19 formed 1 group based on the first and second components, and had a strong association with root length, RDW, the number of panicles and 1000-grain weight.
The results of the bi-plot were somewhat different in the second year. Genotypes G8, G9, G7, G10 and G12 formed one group, which was strongly associated with grain yield, the number of grains per m2, the
number of grains per spikelet, spikelet per panicle and the number of grains per panicle. Genotypes G11, G17 and G14 formed another group that was strongly asso-ciated with biologic yield, RUE, 1000-grain weight and the number of panicles. RDW, RWC and HI formed 1 group that had a strong relationship with genotypes G1, G2, G3, G4, G5, G6, G13 and G16.
DISCUSSION
Based on the meteorological results, rainfall was lower and temperature was higher in the first crop year as compared to the second year. Therefore, the higher yields in the second year of cultivation may be the
Table 2. Results of principal component analysis based on different studied traits in two crop years.
Number
of traits Traits PC1 First yearPC2 PC3 PC1 Second yearPC2 PC3
X1 Root length 0.271 -0.161 0.737 -0.270 -0.431 -0.190
X2 Root dry weight 0.710 -0.078 0.312 -0.636 0.169 -0.615
X3 Relative water content -0.771 -0.103 -0.233 0.876 -0.131 0.097
X4 Biologic yield 0.723 0.211 0.182 -0.211 0.889 -0.163
X5 Harvest index 0.704 0.462 -0.144 0.335 -0.097 0.544
X6 Spikelet per panicle -0.760 0.358 0.445 0.829 0.100 0.124
X7 Number of panicles 0.826 -0.437 -0.022 -0.906 0.072 -0.203
X8 1000-grain weight 0.817 -0.334 -0.267 -0.630 0.178 0.684
X9 Number of grains per spikelet 0.112 0.859 -0.352 0.783 0.143 -0.224
X10 Number of grains per panicle -0.446 0.876 0.073 0.972 0.157 -0.082
X11 Number of grains per square meter 0.341 0.858 0.134 0.585 0.543 -0.455
X12 Radiation use efficiency 0.603 0.304 0.188 -0.376 0.490 0.230
X13 Grain yield 0.921 0.288 -0.156 0.026 0.852 0.342
Eigenvalue 5.656 3.147 1.225 5.350 2.384 1.704
result of increased precipitation – and hence water availability – during the plant growth period. More-over, higher temperatures can lead to more evapo-transpiration, which could expose the plant to higher tension. Indeed, many researchers have shown that drought stress causes loss of yield [16,17].
As the moisture content of the soil decreases, this leads to protoplasm release along with reduced cell swelling; cell size and cell division rate tend to decrease dramatically, resulting in a decrease in the growth and photosynthetic rate of the plant [18]. Wa-ter deficit affects not only the dry weight of the plant but also reduces the number of seeds and panicles [19]. Moreover, drought stress conditions cause the plant to produce a cellular inflammation response [18]. Therefore, drought conditions increase meta-bolic activity, growth rate and developmental rate of the root, such that the root increases the absorption of nutrient ions. In addition, by increasing the
tur-gor, the energy available through photosynthesis also increases [20]. Taken together, this highlights that under drought stress and subopti-mal conditions of cellular inflam-mation, the distribution of food to the root is increased compared to the stem, hence the plant will not be able to provide the carbo-hydrates needed for continued growth.
The effects of traits on grain yield in the second year were not similar to those of the first year, likely because of the im-proved environmental conditions (higher precipitation and lower temperatures). In drought stress conditions (the first crop year), the HI had a positive correlation with grain yield, though this was not the case under normal condi-tions (the second crop year). This could indicate that plants prefer to invest in seed yields under stress conditions in order to increase the chances of survival of the next generation, which would explain why the HI was high under stress conditions [21]. By increasing the amount of relative water content, the apertures of the plant could open more causing wa-ter loss. This would ultimately reduce the grain yield. This result was not observed in the second crop year when the amount of water was not limited. Increas-ing the amount of RWC also increases the amount of CO2 available to the plant, resulting in higher pho-tosynthetic production. In general, the RWC was lower in low-stress conditions (first year of cultiva-tion) compared to normal conditions (second year of cultivation). A number of researchers have shown that exposing plants to drought stress causes reduced stomatal conductance and subsequently the RWC and photosynthesis also decreases [22,23]. A sharp decrease in stomatal conductance with little variation in RWC indicates that rooting signals from drought stress conditions are the cause of stomatal closure and decreased photosynthesis. This chemical signal is the same as abscisic acid [24]. In another study, Ouyang et Fig. 2. Biplot of the first and second components at different crop years related to different
wheat genotypes. A and B – first year; C and D – second year. X1: Root Length; X2: Root dry weight; X3: Relative water content; X4: Biologic yield; X5: Harvest index; X6: Spikelet; X7: Number of panicles; X8: 1000-grain weight; X9: Number of grains; X10: Number of grains; X11: Number of grains (m2); X12: Radiation use efficiency; X13: Grain yield; G1:
al. [25] observed that stressed plants had significant-ly lower stomatal conductivity than irrigated plants, which reduced leaf transpiration in drought condi-tions. In addition to the production of abscisic acid in the root and its transfer to the leaves, the closure of stomata under stress conditions also reduces the potential for inflammation in the leaf, and is likely to be effective through the production of abscisic acid produced in the leaf itself [26].
Correlation analysis revealed a significantly posi-tive correlation between grain yield and RDW that was likely the result of the plant improving its root system in drought conditions (the first crop year), hence increasing its dry weight. Ideally, the drought-tolerant plant would devote more of its photosynthetic production to the accumulation of dry matter in the root to preserve material in the stem and areal part, since it will retain its ability to absorb more water from the soil [27]. Considering that one of the main methods used by plants against drought stress is to increase RDW, this trait can be a suitable criterion for identifying tolerant genotypes from susceptible genotypes [28]. The groups that had high yield under drought stress conditions (the first crop year) corre-lated with root length, hence the genotypes with lower root length obtained higher yields. In addition, RDW was found to be higher in this group than in other groups. It seems that under stress conditions, tolerant genotypes obtained a higher yield by increasing RDW and decreasing root length.
In the second year, RDW was not positively corre-lated with yield because there was no moisture content in the second year, hence the plants were not required to invest in the root system. Researchers have shown that there is a positive and significant relationship be-tween RDW and grain yield of plants under water def-icit conditions [20,29,30]. However, the RUE differed between the first and second crop years. Moreover, the use of light in different wheat genotypes was dif-ferent. It seems that the difference in photosynthetic efficiency of cultivars can differentiate the behavior of cultivars in different weather conditions, consistent with the results of several other researchers [31,32]. Sinclair and Muchow [33] reported that the effect of light consumption is more influenced by plant genet-ics. We observed high variation in the efficiency of light consumption among different genotypes.
Biplot results of the first crop year showed that the high-yield genotypes, including G14 (263.00 g/ m2), G20 (264.50 g/m2), G18 (214.00 g/m2) and G19
(222.50 g/m2), were more strongly correlated with
traits x4, x13, x12, x5, x1, x7, x8, x2 and x10. This result indicates that high yield in drought stress condi-tions can be achieved by improving these traits. In the second year of cultivation, the high-yield genotypes included G7 (356.42 g/m2) and G9 (356.75 g/m2),
which were highly correlated with x11 trait. These results indicate that under stress conditions – as in the first crop year – more traits play a role in contributing to the grain yield of wheat. In addition, the superior genotypes demonstrated the highest rates of RUE in yield, suggesting the importance of this trait. Specifi-cally, the mean RUE rate in the first (2.64) and second (2.61) years showed that wheat genotypes had higher RUE in stress conditions. Indeed, the amount of light absorbed and the dry matter produced by plants has been shown to be reduced in drought stress conditions [34]. Under drought stress conditions, reduced water availability decreases cell growth and subsequently re-duces the leaf area index, the proportion of dry matter and consumption of light [35]. Nevertheless, the bi-plot results highlight that RUE is not the only effective factor in grain yield among the superior genotypes. Overall, grain yield is dependent on many additional factors to induce stress tolerance.
CONCLUSION
Our results revealed a high degree of variation be-tween different wheat genotypes in terms of how their traits responded to drought stress conditions. More-over, the various wheat genotypes were exposed to dif-ferent weather conditions in the first and second crop years, grain yield and other measured traits were also influenced by the environment. In the first year of cul-tivation, there were 4 genotypes (G14, G20, G18, and G19) that had the highest yield (263.00 g/m2, 264.50 g/
m2, 214.00 g/m2, 222.50 g/m2, and 222.50 g/m2,
respectively), and are suitable for cultivation in a drought-exposed environment. Results from the PCA showed that the traits x4, x13, x12, x5, x1, x7, x8, x2 and x10 had a strong association with these 4 genotypes. In the second year, 2 different genotypes (G7 and G9) had higher yields (356.42 g/m2 and
cultiva-tion in normal condicultiva-tions. PCA showed that the trait x11 was strongly related to these genotypes. Overall, the quantitative traits screened here can be used to improve the grain yield of wheat genotypes in future breeding programs.
Funding: All funding for this study was covered by the PhD stu-dent, Mr. Ali Jamali.
Author contributions: Ali Jamali designed, performed the ex-periments and wrote the manuscript. Yousef Sohrabi, the cor-responding author, supervised the experiments and managed the design, writing and revision of the manuscript. Adel Siose Mardeh performed the data analysis. Farzad Hoseinpanahi contributed to the draft of the manuscript.
Conflict of interest disclosure: The authors declare no competing financial interest, the authors declare no conflict of interest.
REFERENCES
1. Rana RM, Rehman SU, Ahmed J, Bilal M. A comprehen-sive overview of recent advances in drought stress tolerance research in wheat (Triticum aestivum L.). Asian J Agri Bio. 2013;1(1):29-37.
2. Learnmore M, Shimelis H, Dube E, Laing MD, Tsilo T. Breeding wheat for drought tolerance: Progress and tech-nologies. J Integ Agri. 2016;15(5):935-43.
3. Lonbani M, Arzani A. Morpho-physiological traits associ-ated with terminal drought stress tolerance in triticale and wheat. Agro Res. 2011;9(1-2):315-29.
4. Vafa P, Naseri R, Mordi M. The effect of drought stress on grain yield, yield Components and protein content of durum wheat cultivars in Ilam Province, Iran. Int J Biol Bio-mol Agri Food Biotech Eng. 2014;8(6):631-6.
5. Saeidi M, Abdoli M. Effect of drought stress during grain filling on yield and its components, gas exchange variables, and some physiological traits of wheat cultivars. Agri Sci Tech. 2015;17(4):885-95.
6. Zhang Zh, Christensen M, Nan Zh, Whish J, Bell L, Wang J, Wang Zh, Sim R. Plant development and solar radiation interception of four annual forage plants in response to sowing date in a semi-arid environment. Ind Crop Prod. 2019;131:41-53.
7. Sanchez-Garcia M, Royo C, Aparicio N, Martin-Sanchez JA, Alvaro F. Genetic improvement of bread wheat yield and associated traits in Spain during the 20th century. J Agri Sci.
2013;151:105-18.
8. Wu W, Li C, Ma B, Shah F, Liu Y, Liao Y. Genetic progress in wheat yield and associated traits in China since 1945 and future prospects. Euphytica. 2013;196(2):155-68.
9. Gonzalez-Navarro OE, Griffiths S, Molero G, Reynolds MP, Slafer GA. Dynamics of floret development determining differences in spike fertility in anelite population of wheat. Field Crop Res. 2015;172:21-31.
10. Fischer RA. Wheat physiology: a review of recent develop-ments. Crop Pasture Sci. 2011;62(2):95-114.
11. Farnia A, Tork A. Changes in yield and yield components of wheat cultivars underwater stress condition. Int J Life Sci. 2015;9(5):103-107.
12. Sadok W, Schoppach R, Ghanem ME, Zucca C, Sinclair TR. Wheat drought-tolerance to enhance food security in Tuni-sia, birthplace of the Arab Spring. Eur J Agro. 2019;107:1-9. 13. Gardner F, Pearce R, Mitchell RL. Physiology of crop plants.
Ames: Iowa State University Press;1985. 325p.
14. Bange, MP, Hawwer GL, Rickert KG. Effect of leaf nitrogen on radiation use efficiency and growth of sunflower. Crop Sci. 1997;37:1201-7.
15. Keshavarz H, Sadegh Ghol Moghadam R. Seed priming with cobalamin (vitamin B12) provides significant protection against salinity stress in the common bean. Rhizosphere. 2016;3:143-9.
16. Wang JY, Xiong YC, Li FM, Siddique KH, Turner NC. Effects of drought stress on morpho-physiological traits, biochemi-cal characteristics, yield, and yield components in different ploidy wheat: A meta-analysis. Adv Agro. 2017;143:139-73. 17. Abdel-Motagally FMF, El-Zohri M. Improvement of wheat
yield grown under drought stress by boron foliar appli-cation at different growth stages. J Saudi Soc Agri Sci. 2018;17(2):178-85.
18. Nelissen H, Sun XH, Rymen B, Jikumaru Y, Kojima M, Take-bayashi Y, De Block J. The reduction in maize leaf growth under mild drought affects the transition between cell divi-sion and cell expandivi-sion and cannot be restored by elevated gibberellic acid levels. Plant Biotech. 2018;16(2):615-27. 19. Quinones C, Mattes N, Faronilo J. Jagadish KS. Drought
stress reduces grain yield by altering floral meristem devel-opment and sink size under dry-seeded rice cultivation. Crop Sci. 2017;57(4):2098-108.
20. Fang Y, Du Y, Wang J, Wu A, Qiao S, Xu B, Chen Y. Moder-ate drought stress affected root growth and grain yield in old, modern and newly released cultivars of winter wheat. Front Plant Sci. 2017;8:672-80.
21. Polania JA, Poschenrieder C, Beebe S, Rao IM. Effective use of water and increased dry matter partitioned to grain contribute to yield of common bean improved for drought resistance. Front Plant Sci. 2016;7:660-7.
22. Bota J, Tomás M, Flexas J, Medrano H, Escalona JM. Differ-ences among grapevine cultivars in their stomatal behavior and water use efficiency under progressive water stress. Agri Water Manag. 2016;16:91-9.
23. Zandalinas SI, Mittler R, Balfagón D, Arbona V, Gómez‐ Cadenas A. Plant adaptations to the combination of drought and high temperatures. Physiol Plantarum. 2018;162(1):2-12. 24. Reynolds MP, Mujeeb-Kazi A, Sawkins M. Prospects for
utilising plant-adaptive mechanisms to improve wheat and other crops in drought- and salinity-prone environments. Annual Appl Biol. 2005;146:239-59.
25. Ouyang W, Struik PC, Yin X, Yang J. Stomatal conductance, mesophyll conductance, and transpiration efficiency in relation to leaf anatomy in rice and wheat genotypes under drought. J Exp Bot. 2017;68(18):5191-205.
27. Avila R, Magalhaes PC, Alvarenga AA, Lavinsky ADO, Cam-pos CN, Souza TC, Gomes Junior CC. Drought-tolerant maize genotypes invest in root system and maintain high harvest index during water stress. Embrapa Milho e Sorgo-Artigo em periódico indexado (ALICE). 2017;15(3):450-60. 28. Belachew K Y, Nagel KA, Fiorani F, Stoddard FL. Diversity
in root growth responses to moisture deficit in young faba bean (Vicia faba L.) plant. Peer J. 2018;6:e4401.
29. Atta BM, Mahmood T, Trethowan TM. Relationship between root morphology and grain yield of wheat in north-western NSW. Australia. Aust J Crop Sci. 2013;7(13):2108-13. 30. Kanbar A, Toorchi M, Shashidhar H. Relationship between
root and yield morphological characters in rainfed low land rice (Oryza sativa L.). Cereal Res Commun. 2009;37(2):261-8. 31. Greaves GE, Yu-Min WANG. The effect of water stress on
radiation interception, radiation use efficiency and water use efficiency of maize in a tropical climate. Turkish J Field Crop. 2017;22(1):114-25.
32. Adeboye OB, Schultz B, Adekalu KO, Prasad K. Impact of water stress on radiation interception and radiation use effi-ciency of soybeans (Glycine max L. Merr.) in Nigeria. Brazil-ian J Sci Tech. 2016;3(1):15-24.
33. Sinclair TR, Muchow RC. Radiation use efficiency. Adv Agro. 1999;65:215-65.
34. Flexas J, Medrano H. Energy dissipation in C3 plants under drought. Func Plant Biol. 2002;29 (10):1209-15.
35. Medrano H, Tomás M, Martorell S, Flexas J, Hernández E, Rosselló J, Bota J. From leaf to whole-plant water use effi-ciency (WUE) in complex canopies: limitations of leaf WUE as a selection target. Crop J. 2015;3(3):220-8.
Supplementary Material