ISSN: 2349-4468
International Journal of Advances in Management, Economics and Entrepreneurship
Available online at:
www.ijamee.info
RESEARCH ARTICLE
Growth and Prospects of Leasing Industry in Bangladesh: A Study Based
on Performance Evaluation of Selected Leasing Firms
Chowdhury Sarahat S*
Department of Business Administration, East West University Plot A/2, Jahurul Islam City, Aftabnagar, Dhaka 1212, Bangladesh
*Corresponding Author: E-mail:[email protected]
Abstract
In a developing country like Bangladesh, the growth of leasing industry signals a remarkable change in the source of industrial and agricultural financing. As opposite to the traditional source of funds obtained from commercial banks and stock markets, many large scale businesses have become more dependent on leasing companies to obtain the required financing to continue business smoothly. Thus, the leasing business in Bangladesh has become more and more popular day by day. The journey of leasing business has started in Bangladesh in the early 80s. After commencement the leasing corporations play a vital role in the economic development of the country. Therefore an attempt has been made through this study to explore the leasing industry in Bangladesh, by analyzing the financial performance of selected leasing companies based on growth percentage and ratio analyses of some company specific variables. Also the paper tried to shed light on the determinants of net profitability of the selected leasing companies through regression analysis and thus tried to focus on the future prospects of leasing industry in Bangladesh.
Keywords: Leasing companies, Deposit, Loan, Net profit, Bangladesh.
Introduction
Leasing in its simplest form is a means of delivering finance, with leasing broadly defined as “a contract between two parties where one party (the less or) provides an asset for usage to another party (the lessee) for a specified period of time, in return for specified payments.” Leasing, in effect, separates the legal ownership of an asset from the economic use of that asset. Leasing is a medium-term financial instrument for the procurement of machinery, equipment, vehicles, and/or properties. Leasing provides financing of assets-equipment, vehicles-rather than direct capital. Leasing is based on the proposition that profits are earned through the use of assets, rather than from their ownership. It focuses on the lessee‟s ability to generate cash flow from business operations to service the lease payment, rather than on the balance sheet or past credit history. This is why leasing is particularly advantageous for new, small and medium-size businesses that do not have a lengthy credit history or a significant asset base for collateral. Furthermore, the lack of a collateral requirement with leasing offers an important advantage in countries with weak business environments, particularly those
with weak creditors‟ rights and collateral laws and registries, for instance, in countries where secured lenders do not have priority in the case of default.
lessees are not specialists in finance or equipment acquisition; leasing companies specialize in finance, credit and equipment acquisition and disposal (equipment dealing). In effect, both the supplier and the lessee are “outsourcing” certain portions of their business to a service provider that also happens to have a certain capacity to borrow and lend money.
Leasing in Emerging Economies
Emerging economies face several challenges, including the need for investment. This is compounded by an under-capitalized banking system that is only able to offer its potential clients a limited range of products. In turn, small and medium-size companies possess insufficient collateral or credit history to access more traditional bank finance. This results in a shortage of credit available to domestic entrepreneurs. Thus, development of the leasing sector as a means of delivering finance increases the range of financial products in the marketplace and provides a route for accessing finance to businesses that would otherwise not have it, thus promoting domestic production, economic growth, and job creation.
Bangladesh is a developing country, but the national calamity and political unrest sluggish the industrial growth as well as economic growth of the country. In spite of all these hindrance the growth of leasing companies is a significant indication of our bright prospects. The traditional sources of funds of our country in the financial market are – the Commercial Banks and the stock exchange. But these sources are not enough to effectively meet the growing demand of capital investments for industrialization of the country. At the backdrop of such scenario, leasing companies came forward in the 80s to serving as an alternative source of financing. The leasing sector has contributed significantly in spite of many constrains like tremendous competition with the banking sector of the country, challenges and regulatory changes (withdrawal of depreciation allowance) which are affecting adversely on the business. With the Challenges of time, the overall growth of the leasing business, achieved through diversification of products and services and aggressive marketing, is remarkable. During the year 2008they have executed leases and disbursed loan aggregating Tk.39.59 billion, which is around33% growth compared to its previous year.Lease financing, as organized in Bangladesh, operates with the following objectives: (a) to assist the development and promotion of productive enterprises by providing equipment lease financing and related services;
(b) to assist in balancing, modernization, replacement and expansion (BMRE) of existing enterprises; (c) to extend financial support to small and medium scale enterprises; (d) to provide finance for various agriculture equipment; and (e) to activate the capital market by operating as managers to the issue, underwriters, or portfolio managers. The functions of a lease business include lease financing, short-term financing, house building financing, and merchant banking and corporate financing. In this last group of functions, the leasing business in Bangladesh moved away from regular leasing activities and is now involved in stock-market related activities such as issue management, underwriting, trust management, private placement, portfolio management, and mutual fund operation. Broad capital market operations of the lease financing institutions include bridge financing, corporate counseling mergers and acquisition, capital restructuring, financial engineering, and lease syndication. Prominent among the sectors of the economy that now receive lease financing services are textiles, apparels and accessories, transport, construction and engineering, paper and printing, pharmaceuticals, food and beverage, chemicals, agro-based industries, telecommunications, and leather and leather products. Thus, the leasing business has proliferated significantly to support the growth of the overall economy. Based on this remarkable development of leasing industry of Bangladesh, we have attempted to analyze the performance of leasing industry of Bangladesh during the period 2007 to 2011 through this article.
The rest of the article is structured as follows: Section 2 builds on the literature review, detailing work done previously on prospects of leasing businesses, their growth and constraints; Section 3 explains the objective of this paper. Section 4 explains the data and research methodology that are utilized in this paper, Section 5 reports the findings of this paper along with the analysis and Section 6 recommends and concludes, referring to fields to work on in future.
Literature Review
considerations, the latter being one of the main reasons that larger companies chose leasing. Results also show that leasing allows smaller companies to survive as small, less profitable companies are more likely to lease than cash generating firms. The leasing companies have provided good returns and have contributed to the development of the host countries. They mobilized substantial funds from commercial sources-in one case, over 100 times the amounts provided over the years by IFC itself. They effectively allocated resources to private enterprises and contributed to the development of domestic capital markets. And they responded to two of IFC's special concerns-assisting small businesses, and assisting small or low-income countries, like Botswana, Malawi, and Bangladesh. The FASB recognized this growth and commented as follows:
“Leasing as a means of acquiring the right to use property has proliferated markedly throughout the post-war period. But it was the decade of the 1960s that saw the greatest expansion, not only in the volume of leasing transactions, but also seen the variety of application and degree of sophistication of the techniques employed. During the period, according to some estimates, leasing grew at an average annual rate of between 15 percent and 20 percent. It was estimated that over Tk. 11 billion in new equipment was leased in 1974 and that by the end of 1975 equipment on lease would be Tk. 100 billion”.
The development of leasing companies has been hindered by the absence of appropriate rules. The leasing companies can‟t spread its operation due to the unawareness about the lease financing among the manufacturers, traders and service companies. The leasing companies do not get funds from Government at lower rate of interest. Other problems include repossession problem, default culture, intense competition from traditional financing source and competition among leasing firms. Khaleda [2] observed that cost of fund is high in case of leasing firms in comparison with their counterparts i.e. banks and other financial institution. In Bangladesh the leasing companies faced competition from two areas (a) competition from traditional source financing and (b) competition from leasing companies. The major DFIs who provide term lending are all owned by government and majority of population still maintain their banking transaction with commercial banks, and Banerjee and Mamun [3] showed that weighted average cost of fund for the leasing companies is always positioned much higher than that of
banks. According to their study, cost of funds for leasing companies varied between 8.4 to 15.3 percent while that of banks was between 8.5 to 9.5 percent, which is almost half of that of leasing corporations.
Choudhury [4] argued leasing sector needs more attention both from Bangladesh Bank and Ministry of Finance so that they may have access to low cost credit lines for carrying on the leasing business with the objective to contribute to the overall industrial growth of the economy. Operation by banks in what have been traditional non-banking areas is often questioned by NBFIs although both can act as complementary to each other rather than being competitors.
Bangladesh Lease and Finance Companies Association (BLFCA) alleged that commercial banks of the country are engaged in non-bank finance activities within the existing banking rules, which is posing difficulties for non-bank financial institutions. This is because by having access to cheaper rate funds, banks have a comparative advantage over NBFIs that does not ensure proper competition for both. Again, it is argued that if banks continue in the leasing business then the default culture of the banking system may also infect the leasing industry [5].
Chen [6] has observed that commercial banks worldwide are directly or indirectly involved in activities such as leasing, hire purchase, term lending, house financing and capital market operation. In developed countries commercial banks are also actively involved in different activities other than banking. In Turkey, banks are empowered to arrange lease finance by virtue of special laws relating to this particular activity. Following the deregulation of the local banking system as well as diversification of business, a number of banks in Taiwan established their own independent leasing companies. In India, commercial banks are permitted to transact leasing business through subsidiaries. In Bangladesh, commercial banks started their leasing operation effectively in 1995 [3].
corporations, should do so through opening lower subsidiaries so that a level playing field for leasing corporations can be maintained.
Objectives of the Study
The objectives of the study are as follows:
To appraise the financial performance & identify the determinants of Net Income of Leasing Corporations in Bangladesh
To Identify the problems of Leasing Corporations in Bangladesh
To suggest remedial measures to the development of Leasing Corporations in Bangladesh
Research Methodology
Scope of the Study
We concentrate our study to evaluate the performance of Dhaka Stock Exchange listed leasing companies during the year 2007 to 2011. At present there are seven specialized leasing companies which are enlisted in Dhaka Stock Exchange and we have included all those companies for our study. The selected companies are: Industrial Development Leasing Company of Bangladesh Limited (IDLC), Bay Leasing and Investment Limited (BLIL), International Leasing and Financial Services Limited (ILFSL), United Leasing Company Limited (ULCL), Peoples‟ Leasing and Financial Services Limited (PLFSL), First Lease International Limited (FLIL) and Premier Leasing International Limited (PLIL). Sampling Procedures
The research is based on the published financial statements. Companies listed in DSE under the „Financial Institutions‟ industry is considered as the population for the study. Out of 22 listed financial companies, we have selected those companies whose major activities consists of lease financing, which is reflected by the word “Leasing” in the name of the companies. Only seven companies (32%) are chosen as the sample for the study. Thus, the sampling methodology was purposive. The relevant data and information were collected from annual reports of respective leasing companies, Bangladesh Bank, Bangladesh Securities and Exchange Commission, Bangladesh Leasing and Finance Companies Association, Bangladesh Bureau of Statistics, Ministry of Finance and websites of relevant corporations in Bangladesh. In this article we have analyzed the different data of leasing corporations in Bangladesh during the period 2007-2011. For evaluating these corporations‟ performance, these data has been analyzed through the various statistical measures like
growth percentage, multiple regression, square of correlation coefficient (r2), correlation matrix etc. Research Design
This paper has evaluated the performance of leasing business in Bangladesh in two parts. Firstly, some company specific variables like branches, employees, deposits, lease, loan & advances, investments, total operating income, total operating expenses, net profit, EPS, NAV have been chosen to analyze the performance of the selected leasing firms through various statistical measures like growth percentages, comparison of ratios etc. Secondly, a multiple regression model has been develop to identify the relationship of the determinants of net income, as it is a major indicator of company profitability. This paper also focus light to diagnose any multi-collinerity of the selected parameters.
Specification of Regression Model Dependent and Explanatory Variable
Firm‟s profitability is measured by Net income and the explanatory variables chosen for the study are branches, deposits, lease and advances, total operating income and total operating expenses. We have tried to observe whether the leasing firm‟s profitability is influenced by these factors or some other parameters are influencing the firm‟s profitability.
Measurement of Variables with Operational Definition
Measurement of data is very important to select the statistical tools to be used and to understand the suitability of the tools. Due to the typical nature of leasing business, it is also important to define the selected variables operationally so that no confusion arises among the readers. Thus, the following model is considered for testing the relationship assumed in the study.
Net Income (Y) = α + β1Branch + β2Deposit +
β3Loan + β4 OpInc + β5 Opexp (1)
Here,
Y= Net incomeα = Constant
β1 = Coefficient of Branchβ2= Coefficient of Deposit
β3=Coefficient of Lease, Loan and Advancesβ4 =
Coefficient of Operating Income β5 = Coefficient of Operating Expense
Results
relationship of the variables which are chosen as
determinants of leasing firms‟ profitability. Analyzing the Performance Based on Growth Rates and Ratios of Company Specific Variables
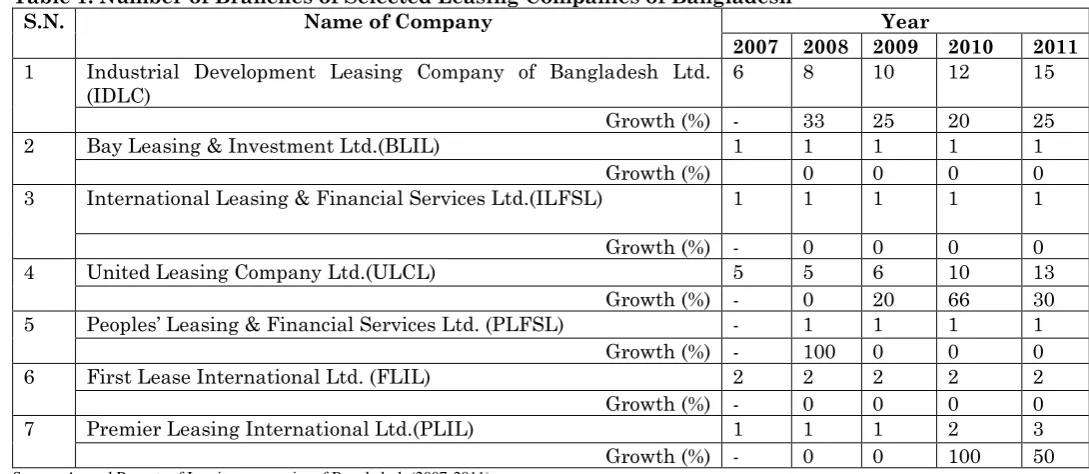
Table 1: Number of Branches of Selected Leasing Companies of Bangladesh
S.N. Name of Company Year
2007 2008 2009 2010 2011 1 Industrial Development Leasing Company of Bangladesh Ltd.
(IDLC) 6 8 10 12 15
Growth (%) - 33 25 20 25
2 Bay Leasing & Investment Ltd.(BLIL) 1 1 1 1 1
Growth (%) 0 0 0 0 3 International Leasing & Financial Services Ltd.(ILFSL) 1 1 1 1 1
Growth (%) - 0 0 0 0
4 United Leasing Company Ltd.(ULCL) 5 5 6 10 13
Growth (%) - 0 20 66 30
5 Peoples‟ Leasing & Financial Services Ltd. (PLFSL) - 1 1 1 1
Growth (%) - 100 0 0 0
6 First Lease International Ltd. (FLIL) 2 2 2 2 2
Growth (%) - 0 0 0 0
7 Premier Leasing International Ltd.(PLIL) 1 1 1 2 3
Growth (%) - 0 0 100 50
Source: Annual Reports of Leasing companies of Bangladesh (2007-2011)
Table 1 shows the growth of branches. The growth of branches was the highest in 2008 for PLFSL and in 2010 for PLIL, which was 100% in both the year for both the companies. On the other hand, the growth of branches of BLIL, ILFSL, and FLIL were stagnate during 2007 to 2011. For IDLC 33%
growth has been observed for branch expansion in 2007 which was reduced to 20% in the year 2010. IDLC has the highest number of branches of 15 in 2011. ULCL and PLIL did not increase their number of branches during 2007 and 2008, where in subsequent years they have opened up branches slowly.
Table 2: Number of Employees of Selected Leasing Companies of Bangladesh
SN Name of Company Year
2007 2008 2009 2010 2011
1 Industrial Development Leasing Company of Bangladesh
Ltd.(IDLC) 168 207 335 486 559
Growth (%) - 23.21 61.84 45.07 15.02
2 Bay Leasing & Investment Ltd.(BLIL) 28 33 31 32 36
Growth (%) - 17.86 (6.06) 3.22 12.5 3 International Leasing & Financial Services Ltd.(ILFSL) 42 50 54 56 58
Growth (%) - 19.04 8 3.70 3.57
4 United Leasing Company Ltd. (ULCL) 89 128 127 175 196
Growth (%) - 43.82 (0.78) 37.79 12 5 Peoples‟ Leasing & Financial Services Ltd.(PLFSL) 44 60 64 69 76 Growth (%) - 36.36 6.67 7.81 10.14
6 First Lease International Ltd.(FLIL) 22 22 42 65 80
Growth (%) - 0 90.91 54.76 23.07
7 Premier Leasing International Ltd.(PLIL) 36 39 35 62 89
Growth (%) - 8.33 (10.26) 77.14 43.54
Source: Annual Reports of Leasing Companies of Bangladesh (2007-2011)
Table 2 shows the growth of employees. IDLC‟s manpower strength was highest in 2011, which were 559. On the other hand, the highest growth rate in manpower strength was observed by FLIL
Table 3: Deposits of Selected Leasing Companies of Bangladesh (Million BDT)
SN Name of Company Year
2007 2008 2009 2010 2011
1 Industrial Development Leasing Company of Bangladesh
Ltd.(IDLC) 8092 8779 10360 13001 17639
Growth (%) - 8.49 18.01 25.49 35.67
2 Bay Leasing & Investment Ltd.(BLIL) 1379 1431 1503 827 1038
Growth (%) - 3.77 5.31 (44.97) 25.51 3 International Leasing & Financial Services Ltd.(ILFSL) 3834 4518 7175 8407 7939 Growth (%) - 17.84 58.81 17.83 (5.56)
4 United Leasing Company Ltd.(ULCL) 3528 3740 4314 4511 5098
Growth (%) - 6.01 15.35 4.57 13.01
5 Peoples‟ Leasing & Financial Services Ltd.(PLFSL) 1450 2087 2957 4911 5848 Growth (%) - 43.93 41.68 66.08 19.07
6 First Lease International Ltd.(FLIL) 236 266 389 414 955
Growth (%) - 12.71 46.24 6.42 130.67 7 Premier Leasing International Ltd.(PLIL) 1391 1850 2166 2276 2589 Growth (%) - 32.998 17.081 5.07 13.75
Source: Annual Reports of Leasing Companies of Bangladesh (2007-2011)
Table 3 shows the growth of deposits. During 2007 to 2011 every year the deposit of IDLC, ULCL, PLFSL, FLIL and PLIL has been increased from the previous year. The total
amount of deposit was highest for IDLC, which was BDT 17639 million in the year 2011, whereas the highest growth in deposit was observed for FLIL in the year 2011 which was 130.67%.
Table 4: Total Lease, Loan and Advances of Selected Leasing Companies of Bangladesh (Million BDT)
SN Name of Company Year
2007 2008 2009 2010 2011
1 Industrial Development Leasing Company of Bangladesh
Ltd. (IDLC) 12081 14008 15078 21214 26357
Growth (%) - 15.95 7.64 40.69 24.24
2 Bay Leasing & Investment Ltd. ( BLIL) 2366 2527 3437 3585 3969
Growth (%) - 6.80 36.01 4.31 10.71
3 International Leasing & Financial Services Ltd. (ILFSL) 3395 3122 3421 3010 2729
Growth (%) - 0.76 16.63 (12.01) (9.33)
4 United Leasing Company Ltd. (ULCL) 7175 7264 7212 7595 7866
Growth (%) - 1.24 (0.72) 5.31 3.57
5 Peoples‟ Leasing & Financial Services Ltd. ( PLFSL) 3527 5137 7412 12313 13803
Growth (%) - 45.65 44.29 66.12 12.10
6 First Lease International Ltd.(FLIL) 1123 1168 1327 1715 2642
Growth (%) - 4.01 13.61% 29.23 54.05
7 Premier Leasing International Ltd. (PLIL) 3422 4350 4522 3752 4273
Growth (%) - 27.12 3.95 (17.03) 13.88
Table 4 shows the growth of lease, loan and advances by leasing companies of Bangladesh. It has been observed from the table that in most of the years during 2007 to 2011, disbursement of lease, loan and advances has been increased from
the previous year in IDLC, BLIL, ULCL, PLFSL FLIL and PLIL. However, the growth rate pattern is not steady. It shows a fluctuating trend for the lease, lean and advances of the selected leasing companies in Bangladesh.
Table 5: Loan to Deposit Ratio of Selected Leasing Companies of Bangladesh (Times)
SL Name of Company Year
2007 2008 2009 2010 2011
1 Industrial Development Leasing Company of
Bangladesh Ltd.(IDLC) 1.493 1.596 1.455 1.63 1.49
3 International Leasing & Financial Services
Ltd.(ILFSL) 0.886 0.691 0.477 0.3850 0.3475
4 United Leasing Company Ltd.(ULCL) 2.033 1.942 1.671 1.68 1.54
5 Peoples‟ Leasing & Financial Services Ltd.(PLFSL) 2.432 2.4614 2.506 2.51 2.36 6 First Lease International Ltd.(FLIL) 4.7584 4.391 3.411 4.14 2.77 7 Premier Leasing International Ltd.(PLIL) 2.460 2.351 2.087 1.62 1.63
Source: Annual Reports of Leasing Companies of Bangladesh (2007-2011)
Table 5 shows growth of loan to deposit ratio of leasing companies of Bangladesh. It has been observed from the table that IDLC, BLIL, ULCL has disbursed more than one and a half times loans compared to their deposits, whereas PLFSL,
FLIL and PLIL have disbursed loan more than two times of their deposit base. The highest loan to deposit ratio was observed for FLIL in the year 2007 which was more than four times.
Table 6: Investments of Selected Leasing Companies of Bangladesh (Million BDT)
SN Name of Company Year
2007 2008 2009 2010 2011
1 Industrial Development Leasing Company of Bangladesh
Ltd.(IDLC) 437 350.5 532.8 575.50 550.69
Growth (%) - (19.79) 52.01 8.01 (4.31)
2 Bay Leasing & Investment Ltd.(BLIL) 580 408 750.6 986 1170
Growth (%) - (29.66) 83.97 31.36 49.08
3 International Leasing & Financial Services Ltd.(ILFSL) 1164 1679 1773.5 1766 1098
Growth (%) - 44.24 5.63 (0.423) (37.83)
4 United Leasing Company Ltd.(ULCL) 165 105 75 158 92
Growth (%) - (36.36) (28.57) 110.66 (41.77)
5 Peoples‟ Leasing & Financial Services Ltd.(PLFSL) 250 161 611 1208 818
Growth (%) - (35.60) 279.50 97.71 (32.28)
6 First Lease International Ltd.(FLIL) - 98 58 84 76
Growth (%) - 100 (40.81) 44.83 (9.52)
7 Premier Leasing International Ltd.(PLIL) 6 43 548 263 229
Growth (%) - 616.67 27.44 52 (12.93)
Source: Annual Reports of Leasing Companies of Bangladesh (2007-2011)
Table 6 shows the growth of investment in government securities and others. ILFSL made the highest amount of investment in 2009 which was BDT 1773.5 million, where as in 2008 PLIL had experienced about 617% growth in their investment from the previous year. No investment
was made by FLIL in the year 2007. It has also been observed from the table that the growth rate pattern of investment made by the leasing companies was not steady, it shows a fluctuating trend for all the selected leasing companies.
Table 7: Total Operating Income of Leasing Companies of Bangladesh (Million BDT)
SN Name of Company Year
2007 2008 2009 2010 2011 1 Industrial Development Leasing Company of Bangladesh Ltd.(IDLC) 883 1179 1913 3047 2160
Growth (%) - 33.52 62.26 59.28 29.11
2 Bay Leasing & Investment Ltd.(BLIL) 417 484 706 1334 779
Growth (%) - 16.06 45.86 88.95 (41.60)
3 International Leasing & Financial Services Ltd.(ILFSL) 1035 1264 1672 2273 2083
Growth (%) - 22.13 32.28 35.94 (8.35)
4 United Leasing Company Ltd.(ULCL) 387 419 447 590 633
Growth (%) - 8.27 6.68 31.99 7.28
5 Peoples‟ Leasing & Financial Services Ltd.(PLFSL) 273 412 598 1386 1026
Growth (%) - 50.92 45.15 131.77 (25.94)
6 First Lease International Ltd.(FLIL) 185 250 246 314 377
Growth (%) - 35.13 (1.6) 27.64 20.06
7 Premier Leasing International Ltd.(PLIL) 149 162 198 280.4 281.8
Growth (%) - 8.72 22.22 41.61 0.50
Table 7 shows total operating income of leasing company of Bangladesh. It has been observed that every year during 2007 to 2010, total operating income of IDLC, BLIL, ILFSL, ULCL, PLFSL and FLIL and PLIL has been increased from previous year. However, in the year 2011, the total
operating income of all the selected leasing companies reduced in the year 2011 except ULCL, FLIL and PLIL. The most like reason is the stock market crash in 2010 that affected all the institutions.
Table 8: Total operating expenditure of selected leasing companies of Bangladesh (In Million BDT)
SN Name of Company Year
2007 2008 2009 2010 2011
1 Industrial Development Leasing Company of Bangladesh
Ltd.(IDLC) 272 353 489 966 913
Growth (%) - 29.78 38.53 97.54 5.48
2 Bay Leasing & Investment Ltd.(BLIL) 12 14 32 44 56
Growth (%) - 16.67 128.57 37.5 27.27 3 International Leasing & Financial Services Ltd.(ILFSL) 920 1083 1365 1436 1933 Growth (%) - 17.72 26.03 5.20 34.61
4 United Leasing Company Ltd.(ULCL) 729 116 145 174 229
Growth (%) - (84.09) 25.00 20 31.61 5 Peoples‟ Leasing & Financial Services Ltd.(PLFSL) 49 62 81 133 142 Growth (%) - 26.53 30.65 64.19 6.76
6 First Lease International Ltd.(FLIL) 109 145.5 145.2 141 249
Growth (%) - 33.49 (0.21) (2.89) 76.59
7 Premier Leasing International Ltd.(PLIL) 67 61 63 142 94
Growth (%) - (8.96) 3.28 125.39 (33.80) Source: Annual Reports of Leasing Companies of Bangladesh (2007-2011)
Table 8 shows total operating expenditure of leasing company of Bangladesh. It has been observed that the amount of total operating expenditure incurred by the leasing firms was significantly different. The amount of total operating expenditure for BLIL, PLFSL and PLIL
was less than BDT 100 million whereas the amount exceeded more than BDT 100 million for other firms. The highest amount of operating expenditure was incurred by ILFSL in the year 2011, which was BDT 1933 million.
Table 9: Total Operating Expenditure/Total Operating Income Ratio of Leasing Companies of Bangladesh
SN Name of Company Year
2007 2008 2009 2010 2011
1 Industrial Development Leasing Company of Bangladesh
Ltd.(IDLC) 30.80 29.94 25.56 31.70 42.27
2 Bay Leasing & Investment Ltd.(BLIL) 9.76 25.00 16.49 3.29 7.19 3 International Leasing & Financial Services Ltd.(ILFSL) 88.89 85.68 81.64 63.18 92.79
4 United Leasing Company Ltd.(ULCL) 78.30 27.68 32.44 29.49 36.17
5 Peoples‟ Leasing & Financial Services Ltd.(PLFSL) 17.95 15.05 13.55 9.59 13.84
6 First Lease International Ltd.(FLIL) 58.92 88.18 85.92 44.90 66
7 Premier Leasing International Ltd.(PLIL) 44.97 37.65 31.82 50.64 33.35
Table 9 shows total operating expenditure/total operating income ratio. It has been observed that the ratio IDLC, BLIL, PLFSL and PLIL was less than fifty percent during the period 2007 to 2011, which indicated that these companies‟ operating expenditures were half or less than half of their
total operating income. On the other hand, for ILFSL, FLIL and ULCL this ratio was higher than fifty percent throughout the year 2007 to 2011. It indicates that these companies operating expenditure level is higher compared to other leasing firms.
Table 10: Net Income of Leasing Companies of Bangladesh (In Million BDT)
SN Name of Company Year
2007 2008 2009 2010 2011
2 Bay Leasing & Investment Ltd.(BLIL) 79 45 157 615 263 Growth (%) (43.04) 248.89 291.72 (57.23) 3 International Leasing & Financial Services Ltd.(ILFSL) 118 113 205 343 (56.58) Growth (%) 0 (4.24) 81.42 67.32 (116.49)
4 United Leasing Company Ltd.(ULCL) 179 123 143 153 162
Growth (%) 0 (31.28) 16.26 6.99 5.88 5 Peoples’ Leasing & Financial Services Ltd.(PLFSL) 81 148 179 185 356 Growth (%) 0 82.72 20.95 3.35 92.43
6 First Lease International Ltd.(FLIL) 89.67 79.9 102.7 117.8 172.2
Growth (%) 0 (10.90) 28.54 14.70 46.18
7 Premier Leasing International Ltd.(PLIL) 50 61 45 47 74
Growth (%) 0 22.00 (26.23) 4.44 57.45
Source: Annual Reports of Leasing Companies of Bangladesh (2007-2011)
Table 10 shows the amount of net income earned by the leasing companies and their growth rate. It has been observed that during 2007 to 2011, all the leasing firms have experienced net profit from their operation except ILFSL. ILFSL have experienced a net loss of BDT 56.58 million from
their operation in the year 2011. However, the growth rate of the net income shows a fluctuating trend for all the leasing companies. The highest amount of net profit was earned by IDLC in the year 2010 which was BDT 1327 million.
Table 11: Earnings Per Share of Leasing Companies of Bangladesh (In BDT)
SN Name of Company Year
2007 2008 2009 2010 2011
1 Industrial Development Leasing Company of Bangladesh Ltd. (IDLC) 126.22 162.55 273.96 22.12 5.05 Growth (%) 22.02 28.78 68.54 (91.57) (77.17) 2 Bay Leasing & Investment Ltd. (BLIL) 77.31 44.14 76.78 11.2 2.77 Growth (%) 84.55 (42.91) 73.95 (85.41) (75.26)
3
International Leasing & Financial Services Ltd.(ILFSL) 59.25 44.68 70.49 6.74 (0.56) Growth (%) 4.89 (35.39) (12.96) (90.43) (108.31)
4 United Leasing Company Ltd. (ULCL) 68.63 66.25 61.41 7.16 2.31
Growth (%) 16.95 (15.99) 5.93 (88.34) (67.73) 5 Peoples’ Leasing & Financial Services Ltd. (PLFSL) 40.33 35.53 4.94 7.47 2.76 Growth (%) (8.05) (22.07) 38.95 51.21 (63.05)
6 First Lease International Ltd. (FLIL) 59 53.38 45.3 3.45 1.64
Growth (%) 28.65 (9.53) (15.14) (92.38) (52.46) 7 Premier Leasing International Ltd. (PLIL) 14.77 13.50 19.53 3.15 0.76 Growth (%) (25.40) (15.17) 55.87 83.87 (75.87)
Source: Annual Reports of Leasing Companies of Bangladesh (2007-2011)
Table 11 shows the earnings per share of the leasing corporations of Bangladesh. It is observed from the table there is no consistent pattern of EPS of all the selected leasing companies except for IDLC. In most of the time during 2007 to 2011 the EPS of all the leasing companies shows a
fluctuating trend. Only IDLC shows a consistent pattern of their EPS and their EPS shows an increasing trend during 2007 to 2011. In 2009 IDLC has achieved highest growth rate of 68.59% for their EPS.
Table 12: NAV per share of leasing companies of Bangladesh ( In BDT)
SN Name of the Company Year
2007 2008 2009 2010 2011
1 Industrial Development Leasing Company of Bangladesh Ltd. (IDLC) 582.35 644.58 797.70 61.50 40.21
2 Bay Leasing & Investment Ltd. (BLIL) 370.29 414 394 40.67 31.42
3 International Leasing & Financial Services Ltd.(ILFSL) 301.08 299.31 317.70 24.89 12.08
4 United Leasing Company Ltd. (ULCL) 473.87 496.26 478.00 30.7 19.42
5 Peoples’ Leasing & Financial Services Ltd. (PLFSL) 154.89 145.66 170.75 30.95 20.44
6 First Lease International Ltd. (FLIL) 283.26 272.77 284.17 19.68 17.38
7 Premier Leasing International Ltd. (PLIL) 127.89 127.19 135.15 14.91 11.87
Table 12 shows net asset value per share of leasing companies in Bangladesh. NAV per share was highest for IDLC throughout the year 2007 to 2009 compared to other leasing firms. During these periods the NAV per share for PLFSL and PLIL were lowest, which were less than BDT 200/= compared to other leasing firms. However, NAV per share for all the selected corporation had faced a significant drop down during the years 2010 and 2011 for the 2010 stock market crash. This macroeconomic factor systematically affected all the companies‟ performance.
Examining the Relationships
In this section, the net income values of selected companies are regressed with the chosen parameter values to examine the possible relationship among them. The chosen parameters are branch, deposits, lease, loan and advances,
operating income and operating expenses. Dependent variable is the Net income. The target of the study is to examine whether these parameters affect net income.
The fit of a multiple regression model can be judged in various ways, for example, calculation of the multiple correlation coefficients or by the examination of residuals. Table 13 includes some statistics to specify the fit of the model. A measure of the fit of the model is provided by the multiple correlation coefficients, R, defined as the correlation between the observed values of the response variable and the values predicted by the model. The value of R2 gives the proportion of the variability of the response variable accounted for by the explanatory variables.
Table 13: Multiple regression model summary
Model R R Square Adjusted R Square Std. Error of the
Estimate
1 .911 .830 .801 116.1987
a Predictors: (Constant), DEPOSIT, BRANCH, LOAN, OPINC, OPEXP b Dependent Variable: NETINCOM
Table 13 includes the multiple correlation coefficient, R, its square, R2, and an adjusted version of this coefficient as summary measures of model fit. The multiple correlation coefficient R = 0.911 indicates that there is high correlation exists between the net income and those predicted by the regression model. In terms of variability in observed level of net income accounted for by our fitted model, this amounts to a proportion of R2 = 0.830, or 83%. Since by definition R2 will increase when further terms are added to the model even if these do not explain variability in the population, the adjusted R2 is an attempt at improved estimation of R2 in the population. The index is
adjusted down to compensate for chance increases in R2, with bigger adjustments for larger sets of explanatory variables.
Use of this adjusted measure leads to a revised estimate that 80.1% of the variability in level of sophistication in the population can be explained by the explanatory variables. The table also provides an estimate of the standard deviation of the error term (under „std. error of the estimate‟). Here we estimate the mean absolute deviation as 116.1987, which is small considering that the range of variables under study.
Table 14: ANOVA
Model Sum of
Squares df Mean Square F Sig.
1 Regression 1911732.092 5 382346.418 28.317 .000
Residual 391562.030 29 13502.139
Total 2303294.122 34
a Predictors: (Constant), BRANCH, DEPOSIT, LOAN, OPINC OPEXP b Dependent Variable: NETINCOM
Table 14 represents the ANOVA table. The ANOVA table also provides an F-test for the null hypothesis that none of the explanatory variables are related to disclosure index, or in other words, that R2 is zero. In our test, we can see that the F stat is 28.317. Assuming a significance level of 5% (α = 0.05), the critical F is 4.74. In our sample,
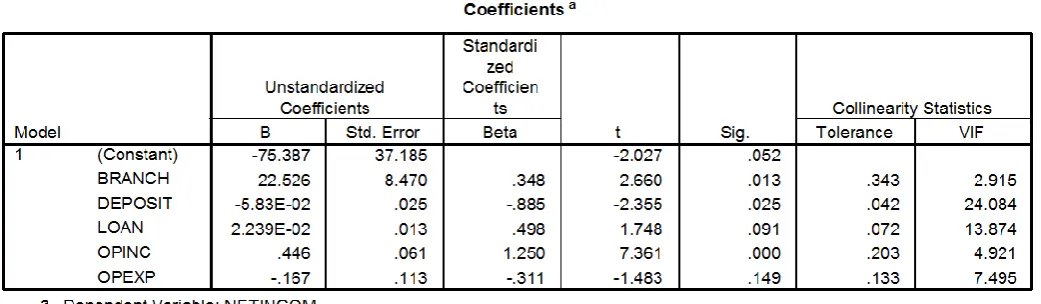
Table 15: Beta coefficients
The beta coefficient as mentioned in Table15 also justifies that all of the explanatory variable becomes significant.
Having concluded that all our independent variables have an impact on our dependent variable, we need to understand if our independent variables are correlated with each other. When independent variables are related with each other, it represents multi-collinearity. In table 15, the last two columns relate to collinearity. The first column defines tolerance. Tolerance is measured as 1 – R2 (where R2 measures the amount of variance in the independent variable in the multiple regression explained by a combination of all the other independent variables). Therefore, a small value of tolerance (normally below 0.10) is a cause of concern since it signifies that a large part of the variance in the independent variable can be explained by the other independent variables
(and therefore the independent variables can be correlated). The other column under collinearity relates to VIF – variance inflation factor. It is calculated as 1 /tolerance. As a rule of thumb, a VIF of greater than 10 indicates a strong chance of collinearity.
From the table, we can notice the variables DEPOSIT and LOAN both have a tolerance level below 0.10 and a VIF of greater than 10. For DEPOSIT, a tolerance value of 0.04 indicates that only 4% of the variation in DEPOSIT cannot be explained by the other independent variables in the model. Similarly for the variable LOAN, a tolerance value of 0.07 indicates that only 7% variation in LOAN cannot be explained by the other independent variables. Hence, DEPOSIT and LOAN needs further investigation since they represent multi-collinearity.
Table 16: Collinearity diagnostics
Colline arity Diagnos ticsa
4.782 1.000 .01 .01 .00 .00 .00 .00
.649 2.714 .00 .08 .00 .01 .01 .07
.350 3.698 .65 .03 .00 .00 .00 .01
.153 5.585 .03 .56 .00 .05 .08 .07
5.476E-02 9.344 .02 .26 .04 .07 .90 .13
1.146E-02 20.423 .28 .06 .95 .87 .00 .72
Dimension 1
2 3 4 5 6 Model 1
Eigenvalue
Condition
Index (Cons tant) BRANCH DEPOSIT LOAN OPINC OPEXP
Varianc e Proportions
Dependent Variable: NETINCOM a.
Table 16 represents data for collenearity diagnostics. From the colinearity Diagnostic table, we can see that we have a very low eigenvalue for
dimension 5 (we are considering dimension 5 because we have five independent variables).
eigenvalue and high condition index indicate
problems of multi-collinearity are present in our sample. Multi-collinearity is pretty evident from the coefficient correlation table also
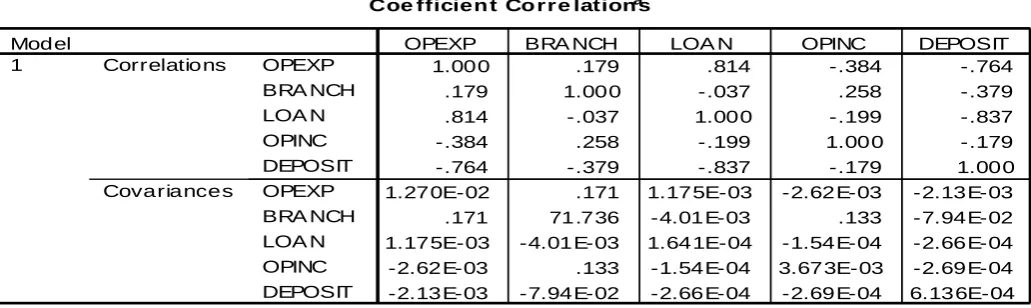
Table 17: Coefficient correlations
Coe fficien t Co r r e lation sa
1.000 .179 .814 -.384 -.764
.179 1.000 -.037 .258 -.379
.814 -.037 1.000 -.199 -.837
-.384 .258 -.199 1.000 -.179
-.764 -.379 -.837 -.179 1.000
1.270E-02 .171 1.175E-03 -2.62E-03 -2.13E-03
.171 71.736 -4.01E-03 .133 -7.94E-02
1.175E-03 -4.01E-03 1.641E-04 -1.54E-04 -2.66E-04
-2.62E-03 .133 -1.54E-04 3.673E-03 -2.69E-04
-2.13E-03 -7.94E-02 -2.66E-04 -2.69E-04 6.136E-04
OPEXP BRA NCH LOA N OPINC DEPOSIT OPEXP BRA NCH LOA N OPINC DEPOSIT Correlations
Covariances Model
1
OPEXP BRA NCH LOA N OPINC DEPOSIT
Dependent V ariable: NETINCOM a.
Normally, any correlation coefficient more than 0.7 or less than -0.7 is a cause of concern. As mentioned above, we can see, there is correlation between DEPOSIT and LOAN as well as correlation of OPEXP with DEPOSIT and LOAN (however, to the contrary the table shows weak correlation between OPINC with DEPOSIT and LOAN). DEPOSIT and LOAN have a negative correlation of -0.837 (naturally, more loans, less deposits and vice versa) while the correlation between OPEXP with LOAN is 0.814 (more loans, more operating expenditure and vice versa) while with DEPOSIT the correlation coefficient is -0.764 (more deposit, less operating expenditure). All of these variables are used to measure net income. However, because of multi collinearity, we cannot measure the correct impact of changes in these variables on net income that we could measure if we consider these variables individually to asses each of these variables impact on net income.
Findings and Conclusion
It is reflected from the analysis that almost every year most of the companies under study have opened new branches. IDLC had the highest number of branches in the year 2011, which were 15. However, all the companies should open up more new branches to provide more comprehensive services to the entrepreneurs of Bangladesh. The leasing companies have created employment opportunities. However, from the analysis we have found that both the leasing companies are still not able to attract the labor pool that they supposed to. This is because still now peoples in Bangladesh are more familiarize with traditional financial institutions like banks and a significant portion of fresh graduates prefer to do jobs in banks compared to leasing companies. Another reason is their employee
retention packages of most of the firm under study (except IDLC) are not so attractive compared to banks. Skilled and trained human resource is considered as an important component for the development of any institution. Due to the recent growth of leasing corporations, availability of experienced manpower is a challenge for this industry.
The supply shortage of efficient resource personnel has been leading to a significant increase in the compensation package, which is also a cause of concern for leasing corporations. The industry experts believe that although there remains enormous growth opportunity the market is still quite small and scope of work for skilled personnel is very limited compared to that of banks. This makes the competent personnel to switch from leasing corporations to other institutions after a certain period implying low retention rate of skilled human resource. If the leasing firms can create systems which will attract more talented and skilled workforce, then this industry can grow faster.
It can be assumed from this analysis that people feel less confident in keeping their savings as deposits in leasing companies. The general preference of people for depositing their saving is banks. In this regard, the leasing firms under study have to manage their funds properly and invest in assets by minimizing the risk. Also they can design and develop new schemes for deposits which will adapt to the needs of savers.
It is reflected from our analysis that all the firms under study have distributed more lease, loan and advances compared to their deposit base under study. The loan to deposit ratio also revealed this point. This is indeed a very important difference from leasing companies and the traditional commercial banks, whose loan is based on their deposits. As stated earlier, the principal sources of fund for leasing corporations are loan from banks and deposits from institutions and individuals. But these corporations face comparative disadvantage in collecting funds compared to the banks because leasing corporations cannot collect short term (less than one year) deposits from individuals due to the central bank‟s restriction, and again deposits in leasing corporations are perceived to be less safe to the public. Default -culture, which has plagued the country's banking sector, could threaten the leasing companies also.
A substantial portion of the money advance to the users could become either doubtful or bad. In this regard leasing companies need to manage their lease, loan and advances portfolio very efficiently and cautiously. Leasing corporations are permitted to undertake a wide array of activities and should therefore not confine themselves to a limited number of products only. Almost all the leasing companies concentrated on equipment leases to BMRE (Balancing, Modernization, Replacement and Expansion) units only. New industrial units were hardly brought under the purview of leasing facilities. This implies that the new customer base has not been created and the growth of industrial entrepreneurship could not be facilitated through these corporations‟ financing packages. Diversifying the product range is a strategic challenge for leasing corporations in order to become competitive in the rapidly growing market.
The total operating income and the total operating expenditure table shows that after 2010 most of the companies operating income were declined or they have increased at a declining rate. This is due to the 2010 stock market crash by which overall all the companies‟ performance was affected. But the operating expenditure of
all the firms were incurred , it is reflected by the total operating income/ operating expenditure ratio that some of the leasing companies under study had incurred as much high as 80% and above operating expenditure to carry on their operations. ILFSL has the highest total operating expenditure/ total operating income ratio which was 93% in the year 2011. This is indeed a very important fact to consider about. Because for all the firms, it is reflected in the study that the expenditure level could not be minimized significantly compared to the reduction in total operating income. As a result, the profitability (measured by net income and EPS) of all the firms under study are affected. The net income of all the leasing companies under study showed a fluctuating trend from 2007-2010, but after 2010 IDLC, BLIL, ULCL had faced a decline growth rate in their net income, whereas ILFSL had incurred net loss in the year 2011. All the firms EPS shows a fluctuating trend from the year 2007 till the year 2009. In the year 2010, EPS of IDLC, BLIL, ILFSL, ULCL shows a declining growth rate, whereas all the firms EPS showed a declining growth rate in the year 2011. NAV per share was highest for IDLC throughout the year 2007 to 2009 compared to other leasing firms. During these periods the NAV per share for PLFSL and PLIL were lowest, which were less than BDT 200/= compared to other leasing firms. However, NAV per share for all the selected corporation had faced a significant drop down during the years 2010 and 2011 for the 2010 stock market crash. This macroeconomic factor systematically affected all the companies‟ performance.
which will help them to sustain for a long period of time.
The leasing is becoming more and more competitive because of the new leasing companies are entering the market. Still there remains a lot of scope which these firms can explore. The political stability and overall economic development is an essential precondition of the smooth growth of this sector. If these two preconditions can be met, the leasing sector of Bangladesh would be able to perform strong role in our industrial development. The government should also focus on leasing sector as a prominent source of financing in addition to commercial banks and other financial institutions and thus
they (government) should more extends facilities for the overall growth of this sector. Moreover, the leasing firms should come up to give more precise ideas and knowledge about lease among general public. In addition to these, they should also focus on their individual performance and should try to overcome the problems and challenges that they are facing for operating their business. We are quite optimistic that if the given suggestions of this paper are implemented by the leasing firms, as well as by the government, then the leasing firms may be able to overcome its present problems and may contribute in the rapid development of the agricultural and industrial sector of Bangladesh [9-21].
References
1.
Lasfer
MA,
Levis M (1998) The Determinants of the Leasing Decision of
Small and Large Companies,
European Financial Management, 4:159-184.2. Khanam K (1995) Lease financing practices in Bangladesh: A case study of IDLC. Dhaka University Journal of Business Studies, 16 (2):225-237.
3.
Banerjee PK, Mamun A
A (2003), “Lease Financing in Bangladesh”, BIBM Research Paper.4. Choudhury AJ (1999) Progress and Prospects of Non-Banking Financial Institutions in Bangladesh. Bank Parikrama, 14(1):188-189. 5. Choudhury AQ (2001) Leasing in
Bangladesh-Problems and Prospects, The Daily Star, April 4, 2001.
6. Chen YC (2001) Lease Financing in Taiwan, In Lisa Paul ed.: World Leasing Yearbook 2001, UK: Adrian Hornbrook.
7. Jamal SH (2004) Banking and Leasing Complementary to Each Other, published in BLFCA Year Book 2004.
8. Sarker M (2004) Managing a Non-Banking Financial Institutions – Some Issues of Concern, published in BLFCA Year Book 2004.
9. Annual Report (2007-2011), Industrial Development Leasing Company of Bangladesh Ltd.
10. Annual Report (2007-2011) Bay Leasing & Investment Ltd.
11. Annual Report (2007-2011) International Leasing & Financial Services Ltd.
12. Annual Report (2007-2011) United Leasing Company Ltd.,
13. Annual Report (2007-2011) Peoples‟ Leasing &Financial Services Ltd.
14. A
nnual Report (2007-2011) First Lease International Ltd.
15. Annual Report (2007-2011) Premier Leasing International Ltd.
16. Asian Leasing Association (1998), “Asian Leasing Convention”, Dhaka, 1998
17. Bangladesh Leasing and Finance Companies Association (BLFCA) Year Book (Various Issues)
18. http://www.lawyersnjurists.com/articles- reports-journals/bank-and-financial- institutes/financial-sectors-bangladesh-contribution-leasing-sector/
19. Research Report (Stamford Conn., FASB 1981). The Economic Effects on Lessees. FASB Statement No. 13.
20. Research Report (Stamford Conn., FASB, 1979) Accounting for Sales with Leasebacks. Statement of Financial Accounting Standard No. 28.