The handle
http://hdl.handle.net/1887/28524
holds various files of this Leiden University
dissertation
Author
:
Djaberi, Roxana
Title
: Cardiovascular risk assessment in diabetes
in Diabetes
Cover design: Katherine Kudo, Kudo Design, New Zealand Layout: Gildeprint, Enschede, The Netherlands
Printed by: Gildeprint, Enschede, The Netherlands
ISBN: 978-94-6108-731-7
in Diabetes
PROEFSCHRIFT
ter verkrijging van
de graad van Doctor aan de Universiteit Leiden, op gezag van Rector Magnificus prof. mr. C.J.J.M. Stolker, volgens besluit van het College voor Promoties ter verdedigen
op donderdag 4 september 2014, klokke 15.00 uur
door
Roxana Djaberi
prof. dr. J.J. Bax
Co-promotor: dr. J.H.A. Scholte
Overige leden: dr. P.R.M. van Dijkman (Bronovo ziekenhuis) prof. dr. A.M. Pereira
prof. dr. A.J. Rabelink
prof. dr. C.J. Tack (Radboud Universitair Medisch Centrum)
Chapter 1 General introduction 11
Part I Coronary artery disease in adiposity and in diabetes
Chapter 2 Relation of epicardial adipose tissue to coronary atherosclerosis 25
Am J Cardiol 2008; 102:1602-1607
Chapter 3 Reduced plasma adiponectin is associated with extent, degree and morphology of coronary artery disease in asymptomatic
patients with type 2 diabetes 39
Submitted
Chapter 4 Differences in atherosclerotic plaque burden and morphology between type 1 and 2 diabetes as assessed by multislice
computed tomography 63
Diabetes Care 2009; 32:1507-1512
Chapter 5 Endothelial dysfunction in diabetic patients with abnormal myocardial perfusion in the absence of epicardial obstructive
coronary artery disease 79
J Nucl Med 2009; 50:1980-1986
Part II Cardiovascular risk assessment in diabetes
Chapter 6 Non-invasive cardiac imaging techniques and vascular tools for the assessment of cardiovascular disease in type 2 diabetes mellitus 101
Diabetologia 2008; 51:1581-1593
Chapter 7 Usefulness of carotid intima-media thickness in patients with diabetes mellitus as a predictor of coronary artery disease 129
Chapter 8 Increased carotid intima-media thickness as a predictor of the presence and extent of abnormal myocardial perfusion in
type 2 diabetes 145
Diabetes Care 2010; 33:372-374
Chapter 9 Relationship between vascular stiffness and stress myocardial perfusion imaging in asymptomatic patients with diabetes 155
Eur J Nucl Med Mol Imaging 2011; 38:2050-2057
Chapter 10 Incremental value of coronary artery calcium score over micro-albuminuria to predict myocardial ischemia in asymptomatic
patients with type 1 diabetes 173
Submitted
Chapter 11 Comparative performance of risk stratification tools for predicting functionally relevant coronary artery disease in
asymptomatic type 2 diabetes 191
Submitted
Part III Microvascular disease
Chapter 12 Non-invasive assessment of microcirculation by sidestream dark field imaging as a marker of coronary artery disease in
diabetes 209
Diab Vasc Dis Res 2013; 10:123-134
Summary and Conclusions 231
Samenvattingen en Conclusies 239
Publications 247
Acknowledgements 251
InTRoDuCTIon
Diabetes is a group of metabolic diseases characterized by hyperglycemia. It affects approximately 3% of the population worldwide (1). The criteria for the diagnosis of diabetes have been proposed by the American Diabetes Association (2) and comprise the presence of one of the following conditions: 1. symptoms of diabetes with a concurrent casual plasma glucose of ≥11.1 mmol/l, 2. a fasting plasma glucose concentration of ≥7.0 mmol/l or 3. a two hour glucose post-load level of ≥11.1 during an oral glucose tolerance test.
Several pathogenic processes are involved in the development of diabetes (3,4). The vast majority of patients with diabetes fall into two broad etiopathogenic categories: type 1- and type 2 diabetes. In type 1 diabetes hyperglycemia is caused by an absolute insulin deficiency, and can be identified by serological evidence of a pathologic autoimmune process in the pancreatic islets and by genetic markers (4). The far more prevalent type 2 diabetes, which accounts for 90-95% of cases, encompasses individuals who have insulin resistance and often have relative (rather than absolute) insulin deficiency. Type 2 diabetes is frequently associated with overweight and other components of metabolic syndrome (hypertension and dyslipidemia).
In diabetes, cardiovascular disease constitutes a major cause of morbidity and mortality (5). Long term complications include microvascular impairment in organs (e.g. eyes, heart, kidneys and nerves), as well as macrovascular injuries of the cerebral, coronary and peripheral arterial vasculature.
PATHoPHysIoloGy of CoRonARy ARTERy DIsEAsE In DIAbETEs
The pathophysiology of atherosclerosis in type 1 diabetes has not been fully elucidated (10). However, current thinking supports a model similar to type 2 diabetes in which hyperglycemia, glycation, and oxidation products cause endothelial dysfunction, pro-inflammatory, and pro-thrombotic changes. Also, endothelial and smooth muscle dysfunction can be a precursor for hypertension, which is in turn a major risk factor for CAD. Lipoprotein disturbances are less apparent in type 1 diabetes.
nATuRE of CAD In DIAbETEs
CAD in diabetic patients is suggested to be distinct from the non-diabetic patients (11). In type 2 diabetes, evaluation of atheroscleotic plaques in post-mortem studies as well as patients undergoing coronary atherectomy suggest more diffuuse CAD, more vulnerable eccentric plaques, with greater inflammatory cell infiltration (12). However, prior studies often have selection biases, as they are event or procedure driven. Even less information is available concerning CAD in type 1 diabetes (10). A detailed investigation of the nature of CAD, in a representative general population of type 1- and type 2 diabtetes is therefore warranted.
RIsk of CAD In DIAbETEs
diabetes is not the equivalent of previous myocardial infarction with respect to future risk of CAD.
Nevertheless, the incremental risk of CAD in diabetes is high and confers worse prognosis. As compared to the general population, the risk of CAD events is two to four fold in type 2 diabetes. Simillar risk has been reported men with type 1 diabetes (hazard ratio 3.0) (17). Whereas a relative higher risk of CAD events has been observed in women with type 1 diabetes (hazard ratio 7.6). Considering the wide ranging inter-individual variability the question remains how to identify the high-risk diabetic patient.
RIsk sTRATIfICATIon foR CAD In DIAbETEs
In diabetes, a wide ranged routine screening strategy of all patients by non-invasive cardiac imaging does not seem cost-effective, and was not shown to influence treatment or outcome (18). A pivotal role could be expected for hyperglycemia in development of vascular damage. Nevertheless, epidemiological evidence does not directly link the level of glycemic control (hemoglobin A 1C) or the duration of hyperglycemia with CAD events. Also, an expert based suggestion by the ADA/AHA in 2000 to consider the presence of ≥ two additional cardiovascular risk factors as a threshold for increased risk of CAD has not been confirmed. This selection strategy was shown to be ineffective in the DIAD study (6), wherein 41% of asymptomatic diabetic patients with abnormal myocardial perfusion did not have ≥ two risk factors.
The clinical utility of risk prediction models may also be limited. The Framingham score has been shown to underestimate event rates in diabetes as compared to the general population (19). Prospective evaluation of the diabetes specific UKPDS suggested less underestimation, but showed a poor relation between actual and predicted CAD events on an individual basis. The SCORE and DECODE models incorporate diabetes in a categorical fashion and do not discriminate risk level in presence of diabetes.
It is assumable that direct estimation of atherosclerosis by means of surrogate markers may provide more accurate risk stratification for the prevalence and incidence of CAD. Indeed, an increased carotid intima media thickness (CIMT) and increased vascular stiffness as assessed by pulse wave velocity (PWV), have been observed in diabetic patients with established CAD (20,21). In a limited number of studies an increased CIMT has also been related with a higher incident rate of CAD events (22,23). However the relation of surrogate markers with silent CAD has not been evaluated in an overall asymptomatic population of diabetic patients. Furthermore, the incremental value of these markers above age and modified risk models, for the prediction of prevalent CAD and CAD events has not been evaluated.
for CAD, could be distinguished, prior to evident atherosclerosis and treated more aggressively. In addition, application of a biomarker may provide a more general estimation of atherosclerotic risk, opposing diagnostic techniques which are often restricted to a certain aspect of vascular disease or a specific organ. On the other hand, clinical utility of biomarkers is often limited by their low specificity. Research to attain a single biomarker with sufficient sensitivity as well as specificity for early recognition of atherosclerosis in various sub-populations continues.
Considering the growing number of patients with diabetes, an optimal risk stratification strategy for the selection of the high-risk diabetic patient should convey a number of characteristics to enable wide range implementation: sufficient sensitivity and specificity, low costs and limited side-effects (e.g. radiation) as well as a non-invasive nature.
DIAbETEs CARDIovAsCulAR RIsk MAnAGEMEnT: DIACARM
The diabetes cardiovascular risk management (DIACARM) project is a clinical protocol founded on a cooperation of the departments of endocrinology, cardiology, nephrology, radiology and nuclear medicine at the Leiden University Medical Center. Herein, asymptomatic patients with type 1- or type 2 diabetes, who visit the diabetes outpatient clinic are referred to the cardiology department for a cardiac risk stratification.
Patient with Diabetes
Inclusion in DIACARM
Cardiovascular symptoms Rose questionnaire Physical examination Clinical risk scores
Cardiac ultrasound Myocardial perfusion imaging CT coronary angiography
Vascular profile? Cardiac function? Indication of coronary artery disease? Need for cardiac catheterization? Revascularization?
Diabetes Guidelines
Diabetes Guidelines Blood pressure Cardiovascular outpatient clinic
Total cholesterol LDL HDL Triglycerides
Lipids
Inflammation parameters Coagulation parameters DNA storage
Non-invasive vascular measurements Cardiac imaging techniques
Extensive plasma analysis
objECTIvE AnD ouTlInE of THE THEsIs
The primary objective of the thesis is to evaluate and compare various techniques and strategies for risk stratification of CAD in asymptomatic patients with diabetes.
REfEREnCEs
1. Wild S, Roglic G, Green A, Sicree R, King H. Global prevalence of diabetes: estimates for the
year 2000 and projections for 2030. Diabetes Care. 2004; 27:1047-1053.
2. Report of the Expert Committee on the Diagnosis and Classification of Diabetes Mellitus.
Diabetes Care. 1997; 20:1183-1997.
3. Chaisson JL, Rabasa-Lhoret R. Prevention of type 2 diabetes: insulin resistance and beta-cell
function. Diabetes. 2004; 53 Suppl 3:S34-S38.
4. Faideau B, Larger E, Lepault F, Carel JC, Boitard C. Role of beta-cells in type 1 diabetes
pathogenesis. Diabetes. 2005; 54 Suppl 2:S87-S96.
5. Morrish NJ, Wang SL, Stevens LK, Fuller JH, Keen H. Mortality and causes of death in the
WHO Multinational Study of Vascular Disease in Diabetes. Diabetologia. 2001; 2: S14–S21.
6. Wackers FJ, Young LH, Inzucchi SE, Chyun DA, Davey JA, Barrett EJ, Taillefer R, Wittlin
SD, Heller GV, Filipchuk N, Engel S, Ratner RE, Iskandrian AE; Detection of Ischemia in Asymptomatic Diabetics Investigators. Detection of silent myocardial ischemia in asymptomatic diabetic subjects: the DIAD study. Diabetes Care. 2004; 27:1954-1961.
7. Scholte AJ, Schuijf JD, Kharagjitsingh AV, Dibbets-Schneider P, Stokkel MP, Jukema JW,
van der Wall EE, Bax JJ, Wackers FJ. Different manifestations of coronary artery disease by stress SPECT myocardial perfusion imaging, coronary calcium scoring, and multislice CT coronary angiography in asymptomatic patients with type 2 diabetes mellitus. J Nucl Cardiol. 2008; 15:503-509.
8. Creager MA, Lüscher TF, Cosentino F, Beckman JA. Diabetes and vascular disease: pathophysiology, clinical consequences, and medical therapy—part I. Circulation. 2003; 108:1527–1532.
9. Tan KC, Chow WS, Ai VH, Metz C, Bucala R, Lam KS. Advanced glycation end products and
endothelial dysfunction in type 2 diabetes. Diabetes Care. 2002; 25:1055–1059.
10. Retnakaran R, Zinman B. Type 1 diabetes, hyperglycaemia, and the heart. Lancet. 2008; 371:1790-1799.
11. Silva JA, Escobar A, Collins TJ, Ramee SR, White CJ. Unstable angina. A comparison of angioscopic findings between diabetic and nondiabetic patients. Circulation. 1995; 92:1731-1736.
12. Burke AP, Kolodgie FD, Zieske A, Fowler DR, Weber DK, Varghese PJ, Farb A, Virmani R. Morphologic findings of coronary atherosclerotic plaques in diabetics: a postmortem study. Arterioscler Thromb Vasc Biol. 2004; 24:1266-1271.
13. Haffner SM, Lehto S, Rönnemaa T, Pyörälä K, Laakso M. Mortality from coronary heart disease in subjects with type 2 diabetes and in nondiabetic subjects with and without prior myocardial infarction. N Engl J Med. 1998; 339:229-234.
14. Bulugahapitiya U, Siyambalapitiya S, Sithole J, Idris I. Is diabetes a coronary risk equivalent?
15. Cano JF, Baena-Diez JM, Franch J, Vila J, Tello S, Sala J, Elosua R, Marrugat J; REGICOR and GEDAPS Investigators. Long-term cardiovascular risk in type 2 diabetic compared with nondiabetic first acute myocardial infarction patients: a population-based cohort study in southern Europe. Diabetes Care. 2010; 33:2004-2009.
16. Buse JB, Ginsberg HN, Bakris GL, Clark NG, Costa F, Eckel R, Fonseca V, Gerstein HC, Grundy S, Nesto RW, Pignone MP, Plutzky J, Porte D, Redberg R, Stitzel KF, Stone NJ; American Heart Association; American Diabetes Association. Primary prevention of cardiovascular diseases in people with diabetes mellitus: a scientific statement from the American Heart Association and the American Diabetes Association. Circulation. 2007; 115:114-126.
17. Soedamah-Muthu SS, Fuller JH, Mulnier HE, Raleigh VS, Lawrenson RA, Colhoun HM. High risk of cardiovascular disease in patients with type 1 diabetes in the U.K.: a cohort study using the general practice research database. Diabetes Care. 2006; 29:798-804. 18. Young LH, Wackers FJ, Chyun DA, Davey JA, Barrett EJ, Taillefer R, Heller GV, Iskandrian
AE, Wittlin SD, Filipchuk N, Ratner RE, Inzucchi SE; DIAD Investigators. Cardiac outcomes after screening for asymptomatic coronary artery disease in patients with type 2 diabetes: the DIAD study: a randomized controlled trial. JAMA. 2009; 301:1547-1555.
19. Coleman RL, Stevens RJ, Retnakaran R, Holman RR. Framingham, SCORE, and DECODE risk equations do not provide reliable cardiovascular risk estimates in type 2 diabetes. Diabetes Care. 2007; 30:1292-1293.
20. Lee CD, Folsom AR, Pankow JS, Brancati FL, Atherosclerosis Risk in Communities (ARIC) Study Investigators. Cardiovascular events in diabetic and nondiabetic adults with or without history of myocardial infarction. Circulation. 2004; 109:855–860.
21. Hatsuda S, Shoji T, Shinohara K, Kimoto E, Mori K, Fukumoto S, Koyama H, Emoto M, Nishizawa Y. Regional arterial stiffness associated with ischemic heart disease in type 2 diabetes mellitus. J Atheroscler Thromb. 2006; 13:114-121.
22. Bernard S, Sérusclat A, Targe F, Charrière S, Roth O, Beaune J, Berthezène F, Moulin P. Incremental predictive value of carotid ultrasonography in the assessment of coronary risk in a cohort of asymptomatic type 2 diabetic subjects. Diabetes Care. 2005; 28:1158–1162. 23. Yamasaki Y, Kodama M, Nishizawa H, Sakamoto K, Matsuhisa M, Kajimoto Y, Kosugi
Relation of Epicardial Adipose Tissue to Coronary Atherosclerosis
Roxana Djaberi, Joanne D. Schuijf, Jacob M. van Werkhoven, Gaetano Nucifora, J. Wouter Jukema, Jeroen J. Bax.
AbsTRACT
InTRoDuCTIon
The relation between abdominal adipose tissue and predisposition to coronary artery disease (CAD) has been well established. Recent data suggest that epicardial adipose tissue (EAT) may also be associated with CAD. In particular, a local inflammatory effect has been suggested since EAT directly surrounds the coronary arteries.1,2 To date, several
modalities have been applied to quantify EAT. Ahn et al observed a good correlation between EAT thickness as determined on echocardiography and the presence of angiographic CAD.3 However, assessment of EAT by echocardiography is limited to
measurements of thickness of the adipose tissue on the free wall of the right ventricle. As a result, contradictory results have been reported by other investigators.4 multislice
computed tomography may provide a more accurate and reproducible quantification of EAT due to its higher spatial resolution. In addition the technique allows quantification of peri-coronary fat thickness and total EAT volume.5 Reproducibility of volumetric
EAT measurements have shown to be superior to thickness measurements.5 Two
recent studies have evaluated the association between EAT assessed by multislice computed tomography and coronary artery calcium (CAC) scores. A positive association was observed between EAT quantity and coronary calcium.6,7 However, the direct
relationship between EAT quantity assessed by MSCT and the presence of coronary atherosclerosis has not been analyzed thus far. This study explores the relation between EAT volume assessed by MSCT and the presence of coronary atherosclerosis. The association between EAT volume and CAC scores and with the presence and degree of coronary atherosclerosis was determined.
METHoDs
The study population consisted of 190 patients who were clinically referred for non-invasive multislice computed tomographic (MSCT) coronary angiography for the evaluation of CAD. Standard exclusion criteria for MSCT coronary angiography were ventricular and supraventricular arrhythmia and contraindications for the use of iodinated contrast media. In addition patients with poor image quality (n=6) and previous cardiac surgery were excluded from the study.
80–100 ml, depending on the total scan time, and a flow rate of 5 ml/s, followed by a saline solution flush of 50 ml. Automated bolus-tracking in the aortic root was used for the timing of the scan. Images were acquired with simultaneous electrocardiogram registration during a single breath hold of approximately 10 seconds. Images were reconstructed in the cardiac phase showing least motion artifacts. In general, the end-diastolic phase was used. However, additional reconstructions were made throughout the entire cardiac cycle if necessary. Reconstructed images were transferred to remote workstations (Advantage, GE Healthcare, USA; and Vitrea 2, Vital Images, USA) for post-processing.
The CAC score was assessed with the application of dedicated software (Vitrea2, Vital Images, USA). Coronary calcium was identified as a dense area in the coronary artery exceeding the threshold of 130 Hounsfield units (HU). An overall Agatston score was registered for each patient.
All coronary angiograms were evaluated by 2 experienced observers. The presence of coronary atherosclerosis was assessed by scrolling through axial images, followed by visual assessment of curved multiplanar reconstructions in at least 2 orthogonal planes. Patients were classified as having 1. no atherosclerosis 2. non-obstructive atherosclerosis (luminal narrowing <50% in diameter) 3. obstructive atherosclerosis (luminal narrowing ≥50%) in a single vessel or 4. obstructive atherosclerosis in the left main and/or multiple vessels.
EAT was quantified using dedicated software (Advantage, GE Healthcare, USA) using the same ECG-gated MSCT reconstructions. EAT was defined as the adipose tissue between the surface of myocardium and the epicardium. Short axis reconstruction slices (3 mm thickness) were created semi-automatically ranging from the surface of epicardium at the apex to a cut-off point at the center of the left atrium for each patient. The number of slices ranged between 35 and 40 per heart. The outer border of epicardium was traced manually on each slice. The total volume within the selected areas (in ml) was produced automatically by the computer software program by adding up the EAT areas and taking the slice thickness into account. Hounsfield Units ranging from -250 to -30 were assigned to isolate adipose tissue within the total selected volume. Adipose tissue within the selected volume was then automatically quantified by the software (Figure 1).
To evaluate the relationship between coronary atherosclerosis and EAT volume, the study population was classified into four groups according to the results of the invasive MSCT angiography: patients with normal coronary arteries, patients with non-obstructive atherosclerosis, patients with non-obstructive atherosclerosis in a single coronary artery and patients with obstructive atherosclerosis in the left main coronary artery and/ or multiple vessels. Average EAT volume and standard deviation were calculated for each group, and the independent T-test was applied to evaluate the difference in mean EAT volume between the groups. Using ROC analysis a cut-off value was chosen for EAT volume. Subsequently sensitivity and specificity for predicting coronary atherosclerosis were calculated. Univariate analysis of baseline characteristics was performed to identify potential predictors of coronary atherosclerosis. Hazard ratios were calculated with 95% confidence interval as an estimate of the risk associated with coronary atherosclerosis. To determine the independent predictors of atherosclerosis, multivariate analysis of risk factors with p ≤0.05 in the univariate analysis was performed which corrected for the baseline characteristics with p ≤0.05 in the univariate analysis.
REsulTs
Patient characteristics are provided in Table 1. Mean age of the study population was 56 years (± 12). The majority of patients were male (55%).
Mean CAC score was 358 ± 906 in the total population. CAC was absent or ≤10 in 71 patients (37%) and >10 in 119 patients (63%). Within this group, 45 patients (24%) had a CAC score in the range 11-100, 33 patients (17%) had a CAC score in the range 101-400 and 41 patients (22%) had a CAC score >101-400. MSCT coronary angiography showed normal coronaries in 76 patients (40%). A total of 45 patients (24%) had non-obstructive atherosclerosis (luminal narrowing <50%), and obstructive coronary atherosclerosis
Table 1. Characteristics of the study population (n=190)
Age (years) 56 ± 12
Men 104 (55%)
Body Mass Index (kg/m2) 27 ± 4
Smokers 51 (27%)
Family history of Coronary Artery Disease 87 (46%)
Hypercholesterolemia* 143 (75%)
Hypertension** 134 (71%)
Diabetes Mellitus 20 (11%)
Data are averages ± standard deviation or numbers of patients (%).
Y = 0.025x + 77 R = 0.33 P = 0.002
0 500 1000 1500 2000 2500 3000 0 50 100 150 200 250 300
Coronary artery calcium scores (Agaston)
EA T vo lu me (m l) 2B
0-10 11-100 101-400 >400
Coronary artery calcium scores (Agaston)
0 50 100 150 200 250 300 EA T vo lu me (m l)
P < 0.001
P = NS P = NS
2C
59±27 94±35 103±40 102±44
0-10 >10
Coronary artery calcium scores (Agaston) 50 100 150 73 200 EA T v ol um e (m
l) 77%Sensitivity
23% 30%
70% Specificity 2D
No Athero-sclerosis Athero-sclerosis <50% Athero-sclerosis >50% Single vessel sclerosis Athero->50% LM and/or Multi-vessel 63±31 94±36 102±37 101±50
0 50 100 150 200 250 300 EA T vo lu me (m l)
P < 0.001
P = NS P = NS
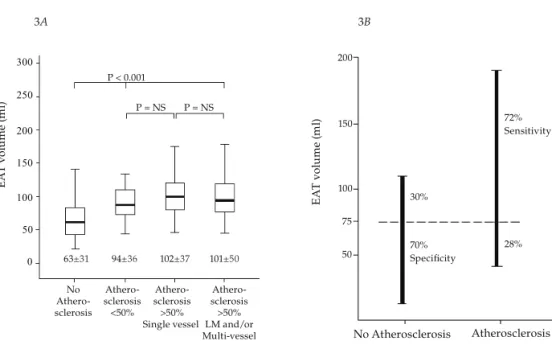
3A No Atherosclerosis 50 100 150 75 200 EA T vo lu me (m l) 72% Sensitivity 28% 30% 70% Specificity Atherosclerosis 3B
figure 3. Relationship between EAT volume and coronary atherosclerosis. (A) Mean EAT volume in patients with no atherosclerosis, non-obstructive atherosclerosis, obstructive single vessel atherosclerosis and obstructive left main and/or multi-vessel atherosclerosis. (B) Sensitivity and specificity of EAT volume with a cut-off value of 75 ml for predicting coronary atherosclerosis were 72% and 70%, respectively.
Table 2. Predictors of Atherosclerosis
univariate Analysis Multivariate Analysis
Characteristic HR (95% CI) P value HR (95% CI) P value
EAT volume 1.03 (1.02-1.05) <0.001 1.03 (1.01-1.05) 0.001
Age 1.10 (1.06-1.13) <0.001 1.05 (1.00-1.09) 0.03
Hypertension 0.09 (0.04-0.22) <0.001 0.12 (0.03-0.45) 0.002
Hypercholesterolemia 0.09 (0.03-0.25) <0.001 0.06 (0.01-0.24) <0.001
Body Mass Index (kg/m2) 1.11 (1.03-1.20) 0.01 1.04 (0.91-1.18) 0.56
Diabetes Mellitus 1.58 (0.62-4.00) 0.34 -
-Smoking 0.79 (0.40-1.56) 0.46 -
-Family history of
cardiovascular disease 1.18 (0.63-2.19) 0.61 -
-Male gender 1.06 (0.59-1.89) 0.86 -
defined as luminal narrowing ≥ 50% was observed in 69 patients (36%). Obstructive single vessel atherosclerosis was observed in 43 patients (22%) and 26 patients (14%) had obstructive left main and/or multi-vessel atherosclerosis.
EAT volume ranged between 15 ml and 267 ml with an average of 84 ± 41 ml. EAT volume showed a tendency to increase with coronary calcium (r=0.33, p=0.002) (Fig 2A). Indeed, average EAT volume was significantly higher in patients with a CAC score >10 (100 ml ± 40) as compared to patients with calcium scores ≤10 (59 ml ± 27), (P<0.001) (Fig 2B). Mean EAT volume did not differ significantly between patients with a CAC score 11-100 (94 ml ±35), CAC score 101-400 (103 ml ± 40) and those with a CAC score >400 (102 ml ± 44) (Figure 2B). Using ROC analysis a cut-off value of 73 ml was identified for EAT volume. This cut-off value yielded a sensitivity and specificity of respectively 77% and 70% for predicting a calcium score >10 (Fig 2C).
In patients with normal coronaries mean EAT volume (63 ml ± 31) was significantly lower than in those with atherosclerosis (99 ml ± 40), (P<0.001) (Fig 3A). However, quantity of EAT did not significantly differ between patients with non-obstructive and obstructive coronary atherosclerosis (P= 0.29). In patients with obstructive atherosclerosis no significant difference was observed in mean EAT volume between patients with single vessel atherosclerosis (102 ml ± 37) as compared to those with left main and/or multi-vessel atherosclerosis (101 ml ± 50) (P=0.95) (Fig 3A). ROC analysis resulted in a sensitivity and specificity of respectively 72% and 70% with an EAT cut-off volume of 77 ml, for predicting coronary atherosclerosis (Fig 3B).
In a univariate model, age, EAT volume, BMI, hypercholesterolemia and hypertension were shown to be predictors of coronary atherosclerosis (Table 2). After adjustment for age, BMI, hypertension and hypercholesterolemia in a multivariate model, EAT volume remained a significant predictor of coronary atherosclerosis (Table 2).
DIsCussIon
In the present study a relation was shown between EAT volume and the presence of CAC and atherosclerosis. Mean EAT volume was significantly higher in patients with CAC and/or coronary atherosclerosis on MSCT angiography in comparison to those with normal coronaries. Importantly, EAT volume was shown to be an independent predictor of coronary atherosclerosis.
Most previous studies which have examined the relationship between CAD and EAT have used echocardiography for the quantification of EAT. Thus far, results of these studies have been controversial. Ahn et al studied the association between thickness of EAT on the free wall of the right ventricle and CAD in patients who underwent conventional coronary angiography due to chest pain.3 A positive association was found between
≥50%) and with the number of coronary arteries with significant stenosis. In contrast, analysis by Chaowalit and colleagues in 139 patients who were referred for conventional coronary angiography did not show a significant correlation between EAT thickness and the number of atherosclerotic coronary segments.4 The discrepancy between these
findings may be due to the limitations of echocardiography in quantification of EAT including inaccuracy of measurements due to lower resolution (especially in adiposity) while also difficulties in the delineation of EAT and pericardial fat may be frequently encountered.8 In addition, echocardiographic estimation of EAT quantity is limited to the
measurement of the EAT thickness on the free wall of the right ventricle, whereas it has been shown that the pattern of distribution of EAT surrounding the myocardium may vary significantly amongst individuals.9 It is therefore likely that EAT thickness on the
free wall of the right ventricle may not always be a reliable and accurate representative of total EAT quantity.
Multislice computed tomography provides an accurate and reproducible quantification of EAT due to its high temporal and spatial resolution. Quantification of both peri-coronary fat thickness and total EAT volume are possible.5 Reproducibility of volumetric
EAT measurements has been shown to be superior to thickness measurements.5 Two
previous studies have analyzed the association between EAT assessed by MSCT using CAC as a marker of atherosclerosis. De Vos et al. studied the relation between peri-coronary fat thickness assessed by MSCT and CAC scores in a female population and found a graded relationship.7 Similarly, in a substudy of the Framingham Heart
investigation (n=1155 individuals) EAT volume was shown to be associated with CAC.6
The results of the current study are in line with these investigations. Additionally, in the current study the presence and extent of coronary atherosclerosis was directly assessed by MSCT angiography and studied in relation to the quantity of EAT volume. We observed significantly higher mean volume of EAT in patients with coronary calcifications. Importantly mean EAT volume was also significantly higher in patients with coronary atherosclerosis as compared to those with normal coronaries. However, in patients with atherosclerosis no significant relation was observed between mean EAT volume and the extent or degree of coronary atherosclerosis.
coronary artery bypass graft surgery.1 Increased expressions and protein levels of
interleukin-1 beta, interleukin-6 and tumor necrosis factor-alpha mRNA were observed in the EAT as compared to subcutaneous fat. Thus, inflammatory EAT response was not associated with plasma inflammatory biomarkers. In another study by Iacobellis and colleagues suppressed levels of the anti-inflammatory adiponectin were observed in the EAT samples of high risk cardiac patients.2 However, it could also be argued that
the inflammatory responses observed in the above studies may be a result of coronary atherosclerosis rather than a cause. Accordingly, plaque rupture in the coronary arteries and regional myocardial ischemia have been shown to trigger an inflammatory reaction in the adjacent adipose tissue stores.10,11 Thus, the precise pathophysiological
interaction between EAT and the coronary wall with respect to development of coronary atherosclerosis remains to be further elucidated.
REfEREnCEs
1. Mazurek T, Zhang L, Zalewski A, Mannion JD, Diehl JT, Arafat H, Sarov-Blat L, O’Brien S,
Keiper EA, Johnson AG, Martin J, Goldstein BJ, Shi Y. Human epicardial adipose tissue is a source of inflammatory mediators. Circulation 2003; 108: 2460-2466.
2. Iacobellis G, Pistilli D, Gucciardo M, Leonetti F, Miraldi F, Brancaccio G, Gallo P, di Gioia CR.
Adiponectin expression in human epicardial adipose tissue in vivo is lower in patients with coronary artery disease. Cytokine 2005; 29: 251-255.
3. Ahn SG, Lim HS, Joe DY, Kang SJ, Choi BJ, Choi SY, Yoon MH, Hwang GS, Tahk SJ, Shin JH.
Relationship of epicardial adipose tissue by echocardiography to coronary artery disease.
Heart 2008; 94:e7.
4. Chaowalit N, Somers VK, Pellikka PA, Rihal CS, Lopez-Jimenez F. Subepicardial adipose
tissue and the presence and severity of coronary artery disease. Atherosclerosis 2006; 186: 354-359.
5. Gorter PM, van Lindert AS, de Vos AM, Meijs MF, van der Graaf Y, Doevendans PA, Prokop
M, Visseren FL. Quantification of epicardial and peri-coronary fat using cardiac computed tomography; reproducibility and relation with obesity and metabolic syndrome in patients suspected of coronary artery disease. Atherosclerosis 2008; 197: 896-903.
6. Rosito GA, Massaro JM, Hoffmann U, Ruberg FL, Mahabadi AA, Vasan RS, O’Donnell CJ, Fox
CS. Pericardial fat, visceral abdominal fat, cardiovascular disease risk factors, and vascular calcification in a community-based sample: the Framingham Heart Study. Circulation 2008; 117: 605-613.
7. de Vos AM, Prokop M, Roos CJ, Meijs MF, van der Schouw YT, Rutten A, Gorter PM, Cramer
MJ, Doevendans PA, Rensing BJ, Bartelink ML, Velthuis BK. Peri-coronary epicardial adipose tissue is related to cardiovascular risk factors and coronary artery calcification in post-menopausal women. Eur Heart J 2008; 29: 777-783.
8. Kanna B, Osorio F, Dharmarajan L. Pericardial fat mimicking pericardial effusion on
two-dimensional echocardiography. Echocardiography 2006; 23: 400-402.
9. Abbara S, Desai JC, Cury RC, Butler J, Nieman K, Reddy V. Mapping epicardial fat with
multi-detector computed tomography to facilitate percutaneous transepicardial arrhythmia ablation. Eur J Radiol. 2006; Epub 57: 417-422.
10. Kalra DK, Zhu X, Ramchandani MK, Lawrie G, Reardon MJ, Lee-Jackson D, Winters WL, Sivasubramanian N, Mann DL, Zoghbi WA. Increased myocardial gene expression of tumor necrosis factor-alpha and nitric oxide synthase-2: a potential mechanism for depressed myocardial function in hibernating myocardium in humans. Circulation 2002; 105: 1537-1540.
11. Moreno PR, Purushothaman KR, Fuster V, O’Connor WN. Intimomedial interface damage
Reduced Plasma Adiponectin is Associated with Extent,
Degree and Morphology of Coronary Artery Disease
in Asymptomatic Patients with Type 2 Diabetes
Roxana Djaberi, Joanne D. Schuijf, Arnold van der Laarse, Alberto M. Pereira, Johannes W. Smit, Lucia J. Kroft, Albert de Roos, Jeroen J. Bax, J. Wouter Jukema.
AbsTRACT
objective
Reduced plasma adiponectin has been linked to coronary artery disease (CAD). However, little is known concerning this relation in type 2 diabetes. We explored the relation between plasma adiponectin and the parameters of coronary atherosclerosis in asymptomatic patients with type 2 diabetes.
Methods
Prospectively, multi-slice CT angiography (CTA) of the coronaries was performed in 103 asymptomatic patients with type 2 diabetes. The following parameters of atherosclerosis were assessed: presence of any atherosclerosis and obstructive atherosclerosis, athero-sclerotic plaque burden (number of plaques), and plaque phenotype (number of non-calcified, mixed, calcified). Parameters of atherosclerosis were studied in relation to traditional cardiovascular risk factors, high sensitivity C-reactive protein and plasma adiponectin.
Results
An independent inverse relation was observed between plasma adiponectin and the presence of any atherosclerosis (P=0.02) and obstructive atherosclerosis (P=0.003). Accordingly, an adiponectin cut-off value of <4.5 mcg/ml resulted in a sensitivity and specificity of 80% and 71% for predicting obstructive atherosclerosis. An independent inverse relation was also observed between plasma adiponectin and the atherosclerotic plaque burden (P=0.02). Further analysis demonstrated low plasma adiponectin to be independently associated with the quantity of non-calcified (P=0.04), but not with mixed or calcified plaques.
Conclusion
InTRoDuCTIon
Early identification of patients prone to develop coronary artery disease (CAD) and prompt initiation of appropriate therapy has become a main focus in the last decades. In consequence, prognosis of CAD has improved in the general population [1]. However, in patients with diabetes, excess CAD mortality and morbidity persist despite preventive guidelines [1]. Improved ability to gauge risk in the individual patient with diabetes, may motivate physicians and patients to adhere preventive therapy, and define those who may benefit from more aggressive risk-reduction strategies and further screening for CAD.
Nevertheless, the optimal approach for the identification of the high risk patient with diabetes remains unclear. In contrast with the general population, risk assessment methods based on the traditional clinical cardiovascular risk factors have shown limited incremental value in diabetes [2,3]. As a result, the use of surrogate markers of atherosclerosis and novel serum biomarkers has gained recent attention for this purpose [4,5]. Validated novel serum biomarkers may convey the additional advantage of reflecting on an individual’s predisposition to develop CAD in an early stage, prior to evident atherosclerosis, enabling successful preventive therapy.
METHoDs
study Design and Patient Characteristics
The study population comprised of 103 asymptomatic patients with type 2 diabetes. Patients were included prospectively from an ongoing registry at the diabetes outpatient clinic. Diagnosis and classification of diabetes was performed using the American Diabetes Association criteria [17]. Accordingly, presence of type 2 diabetes (prominent insulin resistance) was distinguished from primary insulinopenia and immune destruction of beta pancreas cells by determining plasma levels of C-peptide and auto-antibodies to islet cells, insulin and glutamic-acid-decarboxylase. Consecutive patients with type 2 diabetes were referred to the cardiology outpatient clinic for risk stratification and cardiovascular screening. Anginal symptoms were ruled out using a self-completed questionnaire for encountered chest pain [18]. Patients underwent clinical and laboratory evaluation. Non-invasive multi-slice CT angiography (CTA), of the coronaries was performed as part of clinical work up. Concurrently, plasma was collected and stored for later analysis in a study setting, approved by the institutional review committee of the Leiden University Medical Center, Leiden. All patients gave written consent. Patients not eligible for CTA due to arrhythmia or contraindications for the use of iodinated contrast media were excluded.
Cardiovascular risk factors
Presence of cardiovascular risk factors was defined as: 1. smoking (current smoking or smoking in the last 2 years), 2. positive family history of CAD (CAD in first degree family members <55 years in men or <65 years of age in women), 3. body mass index (BMI) as kg/m2, 4. hypertension (blood pressure >140/90 mmHg or treatment
with antihypertensive medication), 5. hypercholesterolemia (total cholesterol level >5.0 mmol/L or use of lipid lowering medication), and 5. glycosylated hemoglobin A1c (HbA1c) as a measure of glycemic control, 6. micro-albuminuria (urine albumin/ creatinine ratio ≥3.5 mg/mmol).
MsCT data acquisition
Second, CTA was performed using the following parameters: collimation 64 x 0.5 mm, tube rotation time 400, 450 or 500 ms depending on the heart rate, tube current 300 or 350 mA, tube voltage 120 kV. Non-ionic contrast material was administered in the antecubital vein at a flow rate of 5 ml/L and the amount of 90–105 ml (depending on the total scan time), followed by 50 ml of saline solution flush. Automated bolus-tracking in the aortic root was applied for the timing of the scan. Images were acquired with simultaneous ECG registration during a single breath hold of approximately 10 seconds. Segmental reconstruction algorithm was applied to generate a single image from the data of one, two or three consecutive heartbeats. Images were reconstructed in the cardiac phase showing least motion artifacts. In general, the end-diastolic phase was used. However, additional reconstructions were made throughout the entire cardiac cycle if necessary to improve image quality. Subsequently, the images were transferred to a remote workstation (Vitrea 2, Vital Images, Minnetonka, USA) for post-processing.
CTA data analysis
All CTA’s were interpreted by two experienced observers blinded to patient characteristics. Discrepancies in interpretation were immediately resolved by consensus. The presence of coronary atherosclerosis was evaluated by scrolling through axial images, followed by visual assessment of curved multiplanar reconstructions in at least two orthogonal planes. Coronary plaques were defined as structures of >1 mm2 within and/or adjacent
to the coronary artery lumen, which could be vividly discriminated from the vessel lumen and the surrounding pericardial tissue [19].
Initially, the presence of any atherosclerosis (≥1 plaque in the coronary tree), and that of obstructive atherosclerosis (luminal narrowing ≥50%) were evaluated in each patient. Thereafter, plaque burden was obtained by determining the total number of atherosclerotic plaques and obstructive plaques per patient [19].
Finally, plaques were classified according to phenotype: 1. non-calcified plaques (plaques with lower density than contrast-enhanced lumen), 2. calcified plaques (plaques with higher density than contrast-enhanced lumen), and 3. mixed plaques (plaques with components of low- and high density plaques) [19].
laboratory Analysis
From all patients, blood and urine were collected after fasting overnight. Plasma total cholesterol, low-density lipoprotein (LDL) cholesterol, high-density lipoprotein (HDL) cholesterol, triglycerides, HbA1c and urine albumin/creatinine ratio were determined in the hospital laboratory, following clinical evaluation.
-80ºC until assayed. All subsequent laboratory analyses were performed blind to patient characteristics.
Plasma levels of hsCRP were determined using the Tina-quant immunoassay (Roche Diagnostics, United Kingdom) by a Cobas Integra 800 analyzer. The method has a detection limit of 0.15 mg/L and a functional sensitivity of 0.3 mg/L. The inter-assay and intra-assay coefficients of variation are <3%.
Plasma adiponectin was measured with a commercially available radioimmunoassay (Linco Research, Inc, St Charles, Missouri, USA). The sensitivity cut-off was 1 ng/ml. The intra-assay and the inter-assay coefficients of variability were 6.21% and 6.90%, for mid-range concentrations of adiponectin respectively. Plasma adiponectin results are reported in micrograms per millimeter.
statistical Analysis
Variables were expressed as means ± standard deviation, medians (lower quartile – upper quartile) or as numbers (percentages) if categorical.
First, the correlation between plasma adiponectin and traditional cardiovascular risk factors as well as hsCRP was determined using the Pearsons correlation.
Second, the relations between plasma adiponectin and the presence and degree of coronary atherosclerosis were evaluated. For this purpose the median plasma adiponectin levels were determined and compared in patients with no atherosclerosis, non-obstructive atherosclerosis and obstructive coronary atherosclerosis. The Mann-Whitney U test was applied to evaluate the difference in plasma adiponectin levels between the groups.
Thereafter, the potential predictors of the presence of any coronary atherosclerosis and obstructive coronary atherosclerosis on CTA were studied in univariate logistic regression models. All baseline traditional cardiovascular risk factors, as well as plasma hsCRP and adiponectin levels were included in the analyses. Variables with a P value <0.05 were included in a multivariate logistic regression model to identify the independent predictors.
Similarly, the predictors of extent of atherosclerosis represented by the number of atherosclerotic plaques, and the predictors of obstructive plaques on CTA were determined using univariate- and subsequent multivariate linear regression analyses. Finally, the predictors of plaque phenotype (number of non-calcified, mixed and calcified plaques) on CTA were evaluated using univariate- and subsequent multivariate linear regression analyses.
REsulTs
study Population
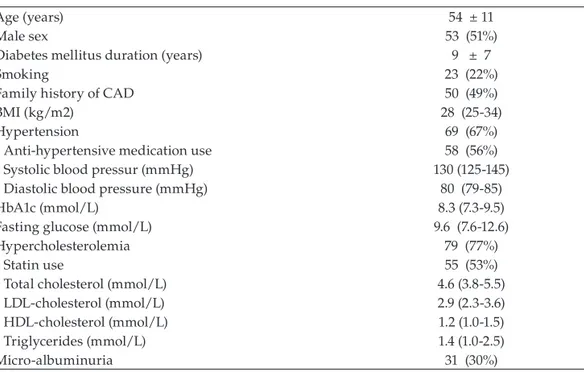
In total, 103 asymptomatic patients with type 2 diabetes, with a mean age of 54±11 years were included. Fifty-three patients (51%) were men. Further baseline characteristics and traditional cardiovascular risk factors of the patient population are provided in Table 1. Diabetes treatment comprised of only diet in 5 patients (5%), oral agents in 69 patients (67%) and insulin in 65 patients (63%). At the time of referral, 69 patients (67%) had hypertension, of which 58 patients were treated with anti-hypertensive medication. Ace-inhibitors were used in 32 (31%), beta-blockers in 16 (16%), angiotensin-II receptor antagonists in 23 (22%), calcium channel blockers in 10 (10%) and diuretics in 16 patients (16%). Seventy-nine patients (77%) had hypercholesterolemia, and 55 patients (53%) were treated with statins. Furthermore, a minority of 26 patients (26%) received aspirin therapy at referral.
Table 1. Characteristics of the patient population (N=103)
Age (years) 54 ± 11
Male sex 53 (51%)
Diabetes mellitus duration (years) 9 ± 7
Smoking 23 (22%)
Family history of CAD 50 (49%)
BMI (kg/m2) 28 (25-34)
Hypertension 69 (67%)
Anti-hypertensive medication use 58 (56%)
Systolic blood pressur (mmHg) 130 (125-145)
Diastolic blood pressure (mmHg) 80 (79-85)
HbA1c (mmol/L) 8.3 (7.3-9.5)
Fasting glucose (mmol/L) 9.6 (7.6-12.6)
Hypercholesterolemia 79 (77%)
Statin use 55 (53%)
Total cholesterol (mmol/L) 4.6 (3.8-5.5)
LDL-cholesterol (mmol/L) 2.9 (2.3-3.6)
HDL-cholesterol (mmol/L) 1.2 (1.0-1.5)
Triglycerides (mmol/L) 1.4 (1.0-2.5)
Micro-albuminuria 31 (30%)
Assessment of coronary atherosclerosis by CTA
As shown in Appendix 1 (page 59), CTA revealed normal coronaries in 36 patients (35%), whereas the remaining 67 patients (65%) were shown to have coronary atherosclerosis. Within this group, 39 patients (38%) had non-obstructive atherosclerosis and 28 patients (27%) had obstructive atherosclerosis.
Overall, the mean number of plaques was 9.3±11.3, and the mean number of obstructive plaques was 1.5±3.2. Analysis of plaque phenotype in the total population showed a predominance of non-calcified plaques (62%), as compared to a minority of mixed (13%) and calcified plaques (25%) (Appendix 1).
Plasma hsCRP and adiponectin levels
Measurement of plasma hsCRP resulted in an overall median value of 2.3 mg/L with an inter-quartile range of 1.1 – 5.8 mg/L.
The overall median plasma adiponectin was determined to be 6.6 mcg/ml (3.8 – 11.2). The term of interaction was not significant between adiponectin and age, duration of diabetes, smoking, family history of CAD, BMI, HbA1c, total cholesterol, LDL-cholesterol or hsCRP levels. A positive significant relation was observed between plasma adiponectin levels and HDL-cholesterol (Spearman’s correlation coefficient 0.45, P<0.001). An inverse relation was observed between plasma adiponectin and triglycerides (Spearman’s correlation coefficient -0.16, P=0.01) as well as with the male sex (Spearman’s correlation coefficient -0.25, P=0.01).
Relation of plasma adiponectin with coronary atherosclerosis on CTA
As illustrated in Appendix 2 (page 60), median plasma adiponectin decreased only modestly from 9.6 mcg/ml (5.4-13.2) in patients with no atherosclerosis to 7.5 mcg/ml (4.7-11.1) in presence of non-obstructive atherosclerosis on CTA (P=0.23). Importantly, a significant further decrease was observed in the median plasma adiponectin of patients with obstructive coronary atherosclerosis (3.8 mcg/ml (2.8-4.7)) (P<0.001) (Appendix 2).
Predictors of the presence of any atherosclerosis and obstructive atherosclerosis Using univariate logistic regression analysis, age, a positive family history for CAD, hypertension, low HDL-cholesterol, triglycerides, micro-albuminuria and low plasma adiponectin were identified as potential predictors of the presence of any coronary atherosclerosis on CTA (Table 2). Of note, plasma adiponectin maintained a significant inverse relation with the presence of coronary atherosclerosis (P=0.02), after correction for other predictors of any coronary atherosclerosis.
Ta bl e 2 . P re d ic to rs o f t he p re se nc e o f a ny a th er os cl er os is a nd o bs tr uc ti ve a th er os cl er os is o n C TA . A n y A th er os cl er osi s o b st ru ct iv e A th er os cl er os is V ar iab le U ni va ri ate M ul ti va ri ate U ni va ri ate M ul ti va ri ate
OR (95% CI)
P value
OR (95% CI)
P value
OR (95% CI)
P value
OR (95% CI)
coronary atherosclerosis (Table 2). Importantly, analysis in a multiple logistic regression model, revealed low plasma adiponectin to be an independent predictor of the presence of obstructive coronary atherosclerosis on CTA (P=0.003).
Using ROC curve analysis a cut-off value of 4.50 mcg/ml was identified for plasma adiponectin level. This cut-off value yielded a sensitivity and a specificity of 80% and 71% for predicting obstructive coronary atherosclerosis on CTA, in asymptomatic patients with type 2 diabetes (Figure 1).
Predictors of the extent of coronary atherosclerosis
Age, HbA1c, micro-albuminuria, hsCRP and low plasma adiponectin were significantly related with the extent of coronary atherosclerosis, as represented by the number of atherosclerotic plaques on CTA, in a univariate linear regression model (Table 3). The
Plasma Adiponectin (mcg/ml)
Specificity Sensitivity
0.90 2.95 4.95 7.65 10.50 14.65 28.90
4.50 20%
40% 60% 71% 80%
100%
Ta bl e 3 . P re d ic to rs o f t he e xt en t o f a th er os cl er os is ( nu m be r o f a th er os cl er ot ic p la qu es a nd o bs tr uc ti ve a th er os cl er ot ic p la qu es ) o n C TA . n u m b er o f A th er os cl er ot ic P la q u es n u m b er o f o b st ru ct iv e A th er os cl er ot ic P laq u es V ar iab le U ni va ri ate M ul ti va ri ate U ni va ri ate M ul ti va ri ate
ß (95% CI)
P value
ß (95% CI)
P value
ß (95% CI)
P value
ß (95% CI)
Ta bl e 4 . P re d ic to rs o f a th er os cl er ot ic p la qu e p he no ty p e ( nu m be r o f n on -c al ci fie d, m ix ed a nd c al ci fie d p la qu es ) o n C TA . n u m b er o f n on -C al ci fi ed P la q u es n u m b er o f M ixe d P la q u es n u m b er o f C al ci fi ed P la q u es Va ri ab le U ni va ri ate M ul ti va ri ate U ni va ri ate M ul ti va ri ate U ni va ri ate M ul ti va ri ate
ß (95% CI)
P value
ß (95% CI)
P value
ß (95% CI)
P value
ß (95% CI)
P value
ß (95% CI)
P value
ß (95% CI)
inverse relation between plasma adiponectin with the extent of coronary atherosclerosis remained significant after correction in a multivariate linear regression model (P=0.02). Likewise, as shown in Table 3, low plasma adiponectin was shown to be independently associated with the number of obstructive coronary atherosclerotic plaques on CTA (P=0.04).
Predictors of atherosclerotic plaque phenotype
The relation of the traditional cardiovascular risk factors, hsCRP and plasma adiponectin with coronary atherosclerotic plaque phenotype is provided in Table 4. Briefly, hsCRP (P=0.001) and low plasma adiponectin (P=0.04) were shown to be independently associated with the number of non-calcified coronary atherosclerotic plaques on CTA. Age, duration of diabetes, hypertension, micro-albuminuria and hsCRP were associated with mixed atherosclerotic plaques, but all lost significance in a multi-variate linear regression model. Age was shown to be the only independent factor associated with the number of calcified coronary atherosclerotic plaques on CTA (P=0.002).
In consequence, plasma adiponectin was independently associated with the quantity of non-calcified, but not with mixed or calcified coronary atherosclerotic plaques (Table 4).
DIsCussIon
In the current study of asymptomatic patients with type 2 diabetes, an inverse relation was observed between plasma adiponectin and the presence and extent of coronary atherosclerosis. Of note, the relation between low adiponectin and coronary atherosclerosis remained significant after correction for traditional cardiovascular risk factors and hsCRP. Low adiponectin was strongly related with obstructive atherosclerosis. Accordingly, an adiponectin cut-off value of <4.5 mcg/ml resulted in a sensitivity of 80% for predicting obstructive atherosclerosis in asymptomatic patients with type 2 diabetes. Whereas no relation was observed between adiponectin and mixed or calcified coronary atherosclerotic plaques, an inverse association was shown between adiponectin and the quantity of non-calcified plaques. Thereby, in asymptomatic patients with type 2 diabetes, low plasma adiponectin predominantly contributed to the presence and extent of coronary atherosclerosis by predisposing non-calcified coronary atherosclerotic plaques.
Assessment of coronary atherosclerosis by CTA
provides information on atherosclerotic plaque burden and plaque composition [19]. In retrospective studies, calcified coronary plaques have been associated with advanced but stable stages of atherosclerosis [21]. On the contrary, non-calcified plaques have been linked to the relatively early but more unstable stages of the disease [21]. Thus far limited studies have addressed the risk factors associated with the presence of coronary atherosclerosis and its morphology in asymptomatic patients with type 2 diabetes [22]. Due to its non-invasive nature, multi-slice CTA of the coronaries provides the possibility to assess atherosclerosis in asymptomatic patients with type 2 diabetes. Thereby, coronary atherosclerosis and its morphology can be evaluated in relation to both traditional risk factors and novel biomarkers, thus improving the understanding of pathophysiology of atherosclerosis in type 2 diabetes, as well as enabling targeted management strategies.
Relation of adiponectin with coronary atherosclerosis
Based on in vitro and animal studies, low adiponectin has been suggested to be an important causal link between adipose tissue dysfunction and atherosclerosis [23-27]. Adiponectin inhibits atherosclerosis by acting as an endogenous modulator of endothelial function through suppressing adhesion molecules [23], by inhibiting NF-κB [24], an interaction with interleukin-10 against vascular inflammation [25] and reduction of cholesterol uptake in macrophages and their transformation into foam cells [26]. In addition, adiponectin reduces vascular smooth muscle cell proliferation, migration and apoptosis [27]. A number of genetic studies confirm and extent the evidence implicating anti-atherogenic effects of adiponectin [8,28,29]. For instance, administration of recombinant adenovirus expressing human adiponectin to apoE-deficient animals caused a 30% reduction in the formation of atherosclerotic plaques [28]. Furthermore, in a meta-analysis of 827 individuals with CAD and 1887 without CAD, the adiponectin gene variant with the polymorphism +276GàT was associated with a 45% decreased risk for CAD [29].
Adiponectin as a predictor of coronary atherosclerosis in type 2 diabetes
In the general population, a large variation is observed in the plasma adiponectin levels, which range up to 25 mcg/mL [11]. As a consequence, adiponectin levels may be a poor marker of coronary atherosclerosis in the general population. On the other hand, coherent to adipose tissue dysfunction, adiponectin levels are relatively low in patients with type 2 diabetes and mainly range 2-12 mcg/mL [14]. Therefore, assessment of adiponectin particularly in patients with type 2 diabetes is likely to yield a higher rate of low adiponectin levels, which predispose coronary atherosclerosis. Consequently, adiponectin may be a more effective marker of coronary atherosclerosis in type 2 diabetes.
As in the general population, the pathogenesis of atherosclerosis is multi-factorial in type 2 diabetes. However, excessive visceral adipose tissue which prompts insulin resistance, may play a more pivotal role in clustering of cardiovascular risk and development of atherosclerosis in patients with type 2 diabetes [6]. As visceral adipose tissue expands, macrophages infiltrate adipose tissue resulting in adipose tissue dysfunction [30]. This phenomenon increases the production of adipocytokines involved in glucose metabolism (e.g. resistin), lipid metabolism (e.g. cholesterol ester transfer protein), coagulation (plasminogen activator inhibitor-1) and inflammation (e.g. tumor necrosis factor-α, interleukin-6, C-reactive protein) [6]. Only the production of the adipocytokine adiponectin decreases during this process [6]. Being produced by adipocytes, a low plasma adiponectin concentration is a good marker of adipose tissue dysfunction [31].
The results of the current study indeed confirm an association between adiponectin and the presence, degree and extent of coronary atherosclerosis in asymptomatic patients with type 2 diabetes. Of note, a plasma adiponectin of <4.5 mcg/mL was associated with a sensitivity of 80% for the presence of obstructive atherosclerosis in this population of patients. These findings confirm previous observations in patients with type 2, wherein adiponectin was found to be inversely associated with coronary events [15, 16]. In a study by Schulze et al, the predictive value of adiponectin was attenuated by HDL cholesterol [15]. In contrast, in the current population of asymptomatic patients with type 2 diabetes, low adiponectin was shown to be associated with the presence, degree and extent of atherosclerosis also after correction for traditional risk factors (including low HDL cholesterol) and hsCRP.
Importantly, low adiponectin, akin to hsCRP (a marker of inflammation), was shown to be especially related with non-calcified atherosclerotic plaques.
Use of a biomarker, such as adiponectin, for the cardiovascular risk stratification of asymptomatic patients with type 2 diabetes may comprise several advantages. Potentially, patients at risk for CAD, could be distinguished at an early stage, prior to clinically manifest atherosclerosis and treated more aggressively. In addition, application of a biomarker may provide a more general estimation of atherosclerotic risk, opposing non-invasive vascular or cardiac imaging techniques which are often restricted to a certain aspect of vascular disease or a specific organ. On the other hand, clinical utility of biomarkers has often been limited by their low specificity [35]. Although several biomarkers (e.g. hsCRP) show a strong correlation with CAD in study populations, the inverse claim that elevated markers indicate a high risk has often been difficult to substantiate [35]. Remarkably however, in this study of asymptomatic patients with type 2 diabetes, low adiponectin (<4.5 mcg/mL), was not only associated with a good sensitivity, but also with a reasonable specificity of 71% for predicting obstructive coronary atherosclerosis.
study limitations
ConClusIon
REfEREnCEs
1. Gregg EW, Gu Q, Cheng YJ, Narayan KM, Cowie CC. Mortality trends in men and women
with diabetes, 1971 to 2000. Ann Intern Med 2007;147:149-155.
2. Wackers FJ, Young LH, Inzucchi SE, Chyun DA, Davey JA, Barrett EJ, Taillefer R, Wittlin
SD, Heller GV, Filipchuk N, Engel S, Ratner RE, Iskandrian AE. Detection of Ischemia in Asymptomatic Diabetics Investigators. Detection of silent myocardial ischemia in asymptomatic diabetic subjects: the DIAD study. Diabetes Care 2004;27: 1954-1961.
3. Coleman RL, Stevens RJ, Retnakaran R, Holman RR. Framingham, SCORE, and DECODE
risk equations do not provide reliable cardiovascular risk estimates in type 2 diabetes. Diabetes Care 2007;30:1292-1293b.
4. Raggi P. Role of electron-beam computed tomography and nuclear stress testing in
cardiovascular risk assessment. Am J Cardiol 2005;96:20J-27J.
5. St Clair L, Ballantyne CM. Biological surrogates for enhancing cardiovascular risk prediction
in type 2 diabetes mellitus. Am J Cardiol 2007;99:80B-88B.
6. Hajer GR, van Haeften TW, Visseren FL. Adipose tissue dysfunction in obesity, diabetes,
and vascular diseases. Eur Heart J 2008;29:2959-2971.
7. Lindsay RS, Funahashi T, Hanson RL, Matsuzawa Y, Tanaka S, Tataranni PA, Knowler WC,
Krakoff J. Adiponectin and development of type 2 diabetes in the Pima Indian population. Lancet 2002;360:57-58.
8. Menzaghi C, Trischitta V, Doria A. Genetic influences of adiponectin on insulin resistance,
type 2 diabetes, and cardiovascular disease. Diabetes 2007;56:1198-1209.
9. Pischon T, Girman CJ, Hotamisligil GS, Rifai N, Hu FB, Rimm EB. Plasma adiponectin levels
and risk of myocardial infarction in men. JAMA 2004;291:1730-1737.
10. Ai M, Otokozawa S, Asztalos BF, White CC, Cupples LA, Nakajima K, Lamon-Fava S, Wilson
PW, Matsuzawa Y, Schaefer EJ. Adiponectin: an independent risk factor for coronary heart disease in men in the Framingham offspring Study. Atherosclerosis 2011;217:543-548. 11. Sattar N, Wannamethee G, Sarwar N, Tchernova J, Cherry L, Wallace AM, Danesh J,
Whincup PH. Adiponectin and coronary heart disease: a prospective study and meta-analysis. Circulation 2006;114:623-629.
12. Wolk R, Berger P, Lennon RJ, Brilakis ES, Davison DE, Somers VK. Association between plasma adiponectin levels and unstable coronary syndromes. Eur Heart J 2007;28:292-298. 13. Nakamura Y, Shimada K, Fukuda D, Shimada Y, Ehara S, Hirose M, Kataoka T, Kamimori
K, Shimodozono S, Kobayashi Y, Yoshiyama M, Takeuchi K, Yoshikawa J. Implications of plasma concentrations of adiponectin in patients with coronary artery disease. Heart 2004;90:528-533.
14. Hotta K, Funahashi T, Arita Y, Takahashi M, Matsuda M, Okamoto Y, Iwahashi H, Kuriyama
of a novel, adipose-specific protein, adiponectin, in type 2 diabetic patients. Arterioscler Thromb Vasc Biol 2000; 20:1595-1599.
15. Schulze MB, Shai I, Rimm EB, Li T, Rifai N, Hu FB. Adiponectin and future coronary heart disease events among men with type 2 diabetes. Diabetes 2005;54:534-539.
16. Lim S, Koo BK, Cho SW, Kihara S, Funahashi T, Cho YM, Kim SY, Lee HK, Shimomura I, Park
KS. Association of adiponectin and resistin with cardiovascular events in Korean patients with type 2 diabetes: the Korean atherosclerosis study (KAS): a 42-month prospective study. Atherosclerosis 2008;196:398-404.
17. Report of the Expert Committee on the Diagnosis and Classification of Diabetes Mellitus.
Diabetes Care 1997;20:1183.
18. Rose G, McCartney P, Reid DD. Self-administration of a questionnaire on chest pain and intermittent claudication. Br J Prev Soc Med 1977;31:42-48.
19. Leber AW, Knez A, Becker A, Becker C, von Ziegler F, Nikolaou K, Rist C, Reiser M, White
C, Steinbeck G, Boekstegers P. Accuracy of multidetector spiral computed tomography in identifying and differentiating the composition of coronary atherosclerotic plaques: a comparative study with intracoronary ultrasound. J Am Coll Cardiol 2004;43:1241-1247. 20. Schuijf JD, Bax JJ, Jukema JW, Lamb HJ, Vliegen HW, Salm LP, de Roos A, van der Wall
EE. Noninvasive angiography and assessment of left ventricular function using multislice computed tomography in patients with type 2 diabetes. Diabetes Care 2004;27:2905-2910.
21. Hoffmann U, Moselewski F, Nieman K, Jang IK, Ferencik M, Rahman AM, Cury RC, Abbara
S, Joneidi-Jafari H, Achenbach S, Brady TJ. Noninvasive assessment of plaque morphology and composition in culprit and stable lesions in acute coronary syndrome and stable lesions in stable angina by multidetector computed tomography. J Am Coll Cardiol 2006;47:1655-1662.
22. Bernard S, Loffroy R, Sérusclat A, Boussel L, Bonnefoy E, Thévenon C, Rabilloud M, Revel D, Moulin P, Douek P. Increased levels of endothelial microparticles CD144 (VE-Cadherin) positives in type 2 diabetic patients with coronary noncalcified plaques evaluated by multidetector computed tomography (MDCT). Atherosclerosis 2009;203:429-435.
23. Ouchi N, Kihara S, Arita Y, Maeda K, Kuriyama H, Okamoto Y, Hotta K, Nishida M, Takahashi M, Nakamura T, Yamashita S, Funahashi T, Matsuzawa Y. Novel modulator for endothelial adhesion molecules: adipocyte-derived plasma protein adiponectin. Circulation 1999;100:2473-2476.
25. Kumada M, Kihara S, Ouchi N, Kobayashi H, Okamoto Y, Ohashi K, Maeda K, Nagaretani H, Kishida K, Maeda N, Nagasawa A, Funahashi T, Matsuzawa Y. Adiponectin specifically increased tissue inhibitor of metalloproteinase-1 through interleukin-10 expression in human macrophages. Circulation 2004;109:2046-2049.
26. Hopkins TA, Ouchi N, Shibata R, Walsh K. Adiponectin actions in the cardiovascular system. Cardiovasc Res 2007;74:11-18.
27. Goldstein BJ, Scalia R. Adiponectin: A novel adipokine linking adipocytes and vascular function. J Clin Endocrinol Metab 2004;89:2563-2568.
28. Okamoto Y, Kihara S, Ouchi N, Nishida M, Arita Y, Kumada M, Ohashi K, Sakai N, Shimomura I, Kobayashi H, Terasaka N, Inaba T, Funahashi T, Matsuzawa Y. Adiponectin reduces atherosclerosis in apolipoprotein E-deficient mice. Circulation 2002;106:2767-2770. 29. Qi L, Doria A, Manson JE, Meigs JB, Hunter D, Mantzoros CS, Hu FB. Adiponectin genetic
variability, plasma adiponectin, and cardiovascular risk in patients with type 2 diabetes. Diabetes 2006;55:1512-1516.
30. Cancello R, Tordjman J, Poitou C, Guilhem G, Bouillot JL, Hugol D, Coussieu C, Basdevant A,
Bar Hen A, Bedossa P, Guerre-Millo M, Clément K. Increased infiltration of macrophages in omental adipose tissue is associated with marked hepatic lesions in morbid human obesity. Diabetes 2006;55:1554-1561.
31. Scherer PE, Williams S, Fogliano M, Baldini G, Lodish HF. A novel serum protein similar to
C1q, produced exclusively in adipocytes. J Biol Chem 1995;270:26746-26749.
32. Scholte AJ, Schuijf JD, Kharagjitsingh AV, Jukema JW, Pundziute G, van der Wall EE, Bax JJ. Prevalence of coronary artery disease and plaque morphology assessed by multi-slice computed tomography coronary angiography and calcium scoring in asymptomatic patients with type 2 diabetes. Heart 2008;94:290-295.
33. Djaberi R, Schuijf JD, Boersma E, Kroft LJ, Pereira AM, Romijn JA, Scholte AJ, Jukema JW, Bax JJ. Differences in atherosclerotic plaque burden and morphology between type 1 and 2 diabetes as assessed by multislice computed tomography. Diabetes Care 2009;32:1507-1512. 34. van Werkhoven JM, Schuijf JD, Gaemperli O, Jukema JW, Boersma E, Wijns W, Stolzmann
P, Alkadhi H, Valenta I, Stokkel MPM, Kroft LJ, de Roos A, Pundziute G, Scholte A, van der Wall EE, Kaufmann P, Bax JJ. Prognostic value of multi-slice computed tomography and gated single photon emission computed tomography in patients with suspected coronary artery disease. J Am Coll Cardiol 2009;53:623-632.
suPPlEMEnTARy fIGuREs
Non-obstructive Atherosclerosis
38%
Obstructive Atherosclerosis
27% No Atherosclerosis
35%
Any Atherosclerosis
65%
Non-Calcified
62% Mixed
13% Calcified
25%