Navigating the growing cloud ecosystem
n Cloud computing industry is gaining momentum, both globally and in China
The cloud computing industry has been evolving over the past two decades and is now entering a rapid deployment stage, with the three main business models (Infrastructure-as-a-Service (IaaS), Platform-as-a-Service (PaaS) and Software-as-a-Service (SaaS)) showing varying degrees of maturity. SaaS is the most mature model, and accounts for over half of industry revenue. PaaS is deployed the least and has the highest entry barriers. IaaS is capital intensive and faces sustained pricing pressure as vendors compete for market share.
n Investment view for China: prefer SaaS to IaaS and PaaS; prefer domestic to foreign players
PaaS has a limited investable universe due to its infancy. For IaaS, we see scarcity value for domestic carrier-neutral, large-scale internet data center (IDC) vendors as foreign IaaS vendors enter China looking for local partnerships. However, IaaS globally is facing pricing pressure, and regulatory risks for foreign vendors may only heighten as domestic IaaS vendors get more prominent. We believe domestic SaaS players will likely be the biggest winners because of strong government support and their deeper local knowledge as enterprises move to the cloud and embrace mobile internet.
n Kingdee: initiate at BUY – well positioned domestic software company in the cloud era
We believe Kingdee will enjoy a first-mover advantage over domestic peers as the SaaS market gains momentum in China, which offers great scope for consolidation in the fragmented SME software market, especially given the scalability of the SaaS model. Infrastructure requirements for an SaaS vendor may also inhibit foreign players from competing effectively in China. We see upside potential to consensus 2015/16 earnings estimates as top line growth returns and margins expand significantly. We believe Kingdee’s trading multiple could also expand as the contribution from cloud increases. BNPP recommendations
Company BBG code Rating Share price Target price Upside/downside
Kingdee Int'l 268 HK BUY 2.40 3.80 +58.3%
Source: BNP Paribas
SECTOR REPORT
CHINA SOFTWARE & SERVICES
Zoe Zhu [email protected] +852 2825 1120 Alen Lin [email protected] +8862 8729 7061
Our research is available on Thomson One, Bloomberg, TheMarkets.com, Factset and on http://eqresearch.bnpparibas.com/index. Please contact your salesperson for authorisation. Please see the important notice on the inside back cover.
Investment thesis
After its earlier years of accumulation, cloud computing is entering a rapid deployment stage, both globally and in China. Gartner projects the market will expand at five-year (2014-2018) CAGRs of 24% globally and 31% for China. The PaaS sector is in its infancy in China, meaning there are few investment options. Within IaaS, we see scarcity value for domestic third-party large-scale IDC vendors as foreign IaaS vendors enter China looking for local partnerships. However, IaaS globally is subject to continuous pricing pressure, and regulatory risks for foreign vendors may heighten as domestic IaaS vendors become more powerful. We believe domestic SaaS players are likely to be the biggest winners because of strong government support and a deeper understanding of the local market as enterprises move to the cloud and mobile applications.
Sector pick
As a leading domestic ERP software company and early investor in cloud computing, Kingdee is well-positioned as the software industry moves to the cloud.
We believe Kingdee could increase its first-mover-advantage as the enterprise SaaS market gains momentum in China, by claiming a greater market share in cloud revenue than its traditional ERP software. In the long run, an SaaS model should have better margins than a traditional licensing model and offer further scope for consolidation in the otherwise fragmented SME software market. We see 6%/10% upside to consensus 2015/2016 earnings estimates as top-line growth returns and margins expand significantly. Risks to our call
Key downside risks to our call include 1) a major economic slump in China adversely affecting the IT budgets of enterprise customers; 2) failure to deliver our operating margin forecasts; and 3) slower-than-expected revenue growth from cloud computing.
CONTENTS
Executive summary ... 3 What is cloud computing? ... 4 Three main business models in cloud computing: IaaS, PaaS, SaaS ... 7 Global cloud market development and industry
dynamics ... 11 China cloud market development and industry dynamics .. 15 Cloud computing investment implication ... 22 Appendix ... 24 Company report ... 25
Global public cloud market forecasts
Source: Garnter, 2014; total market size excl. revenues from cloud advertising
China public cloud market forecasts 0 20 40 60 80 100 120
2012 2013 2014E 2015E 2016E 2017E 2018E
(USD b) IaaS PaaS SaaS
1,000 1,200 1,400
Executive summary
Cloud computing is not a new concept. With early years of accumulation, cloud computing is now entering a rapid deployment stage: Gartner projects the market will expand at five-year (2014-2018) CAGRs of 24% globally and 31% for China. In this thematic report, we explore investment opportunities in the cloud computing ecosystem in China by examining its three main business models: Infrastructure-as-a-Service (IaaS), Platform-as-Infrastructure-as-a-Service (PaaS) and Software-as-Infrastructure-as-a-Service (SaaS). We also analyse the industry dynamics in each of these service areas, not just in China but also globally. Being part of a global industry, Chinese companies that have invested in cloud (including internet giants BATs and software companies such as Kingdee) face competition from established global internet companies (for example, Amazon and IT mega-vendors such as Microsoft, IBM, Oracle, etc) as they seek to establish a presence in China.
On the infrastructure side, the current IaaS offerings by domestic companies are basic compared with those of global vendors such as Microsoft and Amazon. As more foreign vendors enter China looking for local partnerships, we see scarcity value in domestic carrier-neutral large-scale IDC vendors. However IaaS globally is subject to continuous pricing pressure, and the regulatory risks for foreign vendors may heighten as domestic IaaS vendors become more prominent.
The investable universe in PaaS is limited both globally and in China as the business model is at its infancy. However, domestic internet companies that have strategically invested in this area by replicating the Google App Engine model should have an edge over foreign players, as localisation, ecosystems and government regulations would inhibit global players from competing effectively.
SaaS is the most mature cloud model, representing over half of the public cloud computing industry both globally and in China. Medium-sized enterprises are at the adoption sweet spot, and development of the enterprise mobile internet market is set to accelerate SaaS adoption in China over the next couple of years, in our view. We believe the scalability of the SaaS model offers its leaders scope for consolidation in the otherwise fragmented SME software market, and domestic software companies would have an edge over foreign vendors in cloud due to issues such as data storage and security. We believe Kingdee, with its first-mover-advantage in ERP SaaS, is very well positioned as the SaaS market gains momentum in China. Kingdee: initiate coverage with a BUY rating and TP of HKD3.80
Kingdee is the leading domestic ERP software company for SMEs in China. With earlier investments in ERP cloud products that target medium-sized enterprises, who tend to be early adopters of SaaS, we believe Kingdee will enjoy a first-mover advantage over its domestic peers as the enterprise SaaS market gains momentum in China. Also, as issues of data storage and security in the SaaS model inevitably inhibit foreign vendors from competing effectively, the industry transition to cloud offers Kingdee great scope for consolidation in the otherwise fragmented SME software market, in our view.
We believe 2014 will be the first year that Kingdee’s earnings will normalise earnings after two years of re-steering the company. We see 6%/10% upside to Bloomberg consensus earnings forecasts for 2015/2016 as the top line returns to double-digit (organic) growth and margins expand significantly upon completion of its sales channel mix shift.
Our target price of HKD3.80 for Kingdee is based on a target 2015E P/E of 25x, which implies a PEG ratio of 0.8x, on a par with its domestic peer but lower than global peers. We see upside potential to Kingdee’s trading multiple as its competitive edge in the cloud era becomes more apparent to investors. (For details see our accompanying initiation report on Kingdee: On cloud nine.)
Infrastructure-as-a-Service
Platform-as-a-Service
Software-as-a-Service
What is cloud computing?
The term ‘cloud computing’ was firstly coined by University of Texas’s professor Ramnath Chellappa in a talk on a "new computing paradigm" in 1997. It refers to the use of computing resources (e.g. hardware, software, computing power, networking, security, storage, data, database) that are delivered as a service over the internet. Two key features of cloud computing are: 1) users pay based on the amount of the resources consumed in a cloud model, 2) cloud services can be accessed anywhere there is internet access, vs only in the office in the traditional on-premise IT model (Exhibit 1).
EXHIBIT 1: Cloud vs on-premise model
Cloud model On-premise model
Pay on demand Upfront cost
Accessible everywhere online Only in the office
Faster deployment Slower deployment
More scalable Less scalable
Users may lose some degree of security when data resides in the cloud More secure
IT budget as in opex IT budget as in capex
Source: BNP Paribas
Public cloud vs private cloud vs hybrid cloud
There are three types of cloud deployment model, depending on whether cloud services are placed on the public networks or private networks or a combination of both.
§ Public cloud.
A public cloud is one where standard cloud computing services, applications and storage are made available to users over the internet as a service. It is the most scalable cloud deployment model (for both enterprise customers and the cloud services vendors) with the lowest upfront costs, hence appealing to many SMEs.
§ Private cloud
Private clouds are cloud computing services deployed solely for a single organisation on its own local network infrastructure. The IT departments of the organisation need to evaluate how existing resources should be reallocated in the cloud to virtualise the business environment.
Compared with the public cloud, private clouds offer scope for more advanced security and more customised solutions that are not possible in a public cloud. However, building a private cloud still involves significant investment, and does not therefore deliver the shorter-term economies that public cloud can. Large companies are more likely to construct enterprise private cloud than are SMEs, due to security concerns and the possibly higher ROI over the long term.
§ Hybrid cloud
Characteristics of cloud computing
What is public cloud
EXHIBIT 2: Cloud deployment model - buyer preferences for software
Source: Everest Group Cloud Connect Enterprise Cloud Adoption Survey 2013
Cloud computing development timeline
Cloud computing is not a new concept. The concept of delivering IT services in a network came to existence and evolved along the way after the emergence of virtualisation technology, the development of universal high-speed bandwidth and the universal software interoperability standards since the late 20th century.
EXHIBIT 3: Timeline of cloud computing
Source: BNP Paribas
Key milestones in cloud computing history include (Exhibit 3):
§ 1999: Salesforce.com (CRM US, NR) was funded and pioneered the concept of delivering enterprise applications on the internet.
§ 2002: Amazon Web Services started providing a suite of cloud-based services including storage, computation.
§ 2006: Elastic Compute cloud (EC2) launched by Amazon as a commercial web service that allows small enterprises and individuals to rent computers on which to run their own computer applications, the first widely accessible cloud
computing infrastructure service.
§ 2007: Salesforce.com launched Force.com as a cloud computing platform as a service system which enables developers to build applications hosted on their servers as a service.
§ 2008: Google (GOOG US, NR) first released Google App Engine, a platform as a service (PaaS) cloud computing platform for developing and hosting web
applications in Google-managed data centers.
According to Gartner’s 2014 hype cycle of emerging technologies (Exhibit 4), cloud computing has long passed its peak of inflated expectations and is on the way to the
70% 64% 63% 62% 60% 60% 56% 56% 55% 51% 49% 48% 48% 18% 22% 20% 22% 26% 26% 26% 23% 26% 24% 28% 28% 30% 12% 14% 17% 16% 14% 14% 17% 21% 19% 25% 23% 24% 22% N=84 N=88 N=90 N=76 N=77 N=80 N=87 N=94 N=92 N=76 N=91 N=86 N=77 ERP-finance&accounting Business intelligence/analytics Application development/test environment ERP-human capital management
e-mail/collaboration Disaster recovery/storage/data archiving
e-commerce and online tools Custom business applications-industry-K
Custom business applications-K ERP-SCM/procurement
Web apps/websites Collaboration and content managementK
CRM/marketing automation
Private cloud Indifferent Public cloud
The cradle stage
The early stage of cloud services The cloud service forming stage Rapid development stage of cloud services The mature stage of Cloud services 1999 2006 2009 2015
The formation cloud computing concept March 1999, Salesforce was founded In 2002 Amazon launched AWS services. 2007, Salesforce launched Force.com, PaaS services
Apr 2008, Google first released Google App Engine.
Cloud reaches mainstream with established platform product, standard and market structure.
Slope of Enlightenment, whereby as the technology and ecosystem with an increasingly diverse range of organisations become more mature, users are truly understanding the Cloud Computing’s applicability, risks and benefits.
EXHIBIT 4: Cloud computing on the hype cycle of emerging technologies (2014)
Three main business models in cloud computing: IaaS, PaaS, SaaS
There are three types of cloud computing: Infrastructure-as-a-Service (IaaS), Platform-as-a-Service (PaaS) and Software-as-a-Service (SaaS) (Exhibit 5). EXHIBIT 5: Types of cloud services
Sources: www.keithrozario.com; BNP Paribas § Infrastructure-as-a-Service (IaaS)
IaaS is a standardised, highly automated offering where compute resources, complemented by storage and networking capabilities, are owned by a service provider and offered to the customer on demand. The resources may be hosted either by the service provider, or on-premises in the customer's data centers. Notable global IaaS vendors include Amazon’s EC2 (Elastic Compute Cloud – its server infrastructure) and S3 (Simple Storage Service – its storage infrastructure) as part of Amazon Web Services, Microsoft Azure, Rackspace Cloud Servers, Google (Google Compute Engine), HP, VMware, among others (Exhibit 9).
Chinese domestic IaaS vendors include Ucloud, Grand Cloud, Tencent (Tencent Cloud), Baidu (Baidu Cloud) and CITIC Telecom CPC, although some of them tend to target a specific customer vertical like Ucloud for gaming companies, CITIC Telecom CPC for multinationals (Exhibit 9).
EXHIBIT 6: Real life examples of IaaS
Customer Service provider Case study
Netflix Amazon (AWS) As the most popular movie streaming and video-on-demand site on the web, Netflix’s website infrastructure is hosted on Amazon AWS. Due to the sheer volume and fluctuating usage patterns of its customer base, Netflix relies on Amazon’s infrastructure capabilities for rapid scaling, server, and storage deployment. Qihoo 360 Amazon (AWS) Qihoo 360’s entire international platform is built on AWS. The platform was built
leveraging Amazon CloudFront as its content delivery network (CDN), Amazon EC2, and Amazon Elastic Block Store (EBS), which serves the company’s processing needs, as well as Amazon Simple Storage Service (Amazon S3) for its data store.
Sources: BNP Paribas; Vendors’ websites
§ Platform-as-a-Service (PaaS)
PaaS is a type of cloud computing whereby a user accesses a computing platform to create, test, and/or deploy applications via the cloud by using middleware, runtime and underlying infrastructure provided by the vendor.
Notable global PaaS vendors include Salesforce.com (Force.com), Google (Google App Engine), Microsoft (Azure), IBM (BlueMix), Appistry, AppScale Engine Yard, among others (Exhibit 9).
In China, many prominent internet companies are also strategically invested in PaaS including Baidu (Baidu Cloud), Tencent (Tencent Cloud), Sina (Sina App Engine), among others (Exhibit 9).
EXHIBIT 7: Real life examples of PaaS
Customer Service provider Case study
Best Buy Google (Google App Engine) Best Buy is a multinational retailer of consumer goods. In 2008, a team of Best Buy developers launched Giftag, a social application that lets users make online wish lists to share with friends through social media sites. The original application took eight developers more than a year to create and once it was developed, adding new features and scaling it for heavy use was onerous. They then switched to Google App Engine and rewrote the Giftag app from scratch with half of the original team in 25% of the original time. After completion, the Giftap app runs smoothly with no maintenance requirements. The Best Buy development team then launched more than ten other web applications on Google App Engine.
MeituPic (美图秀秀) Baidu (Baidu App Engine) MeituPic is a popular mobile app for users to modify pictures especially among girls in China. It was developed and maintained on Baidu App Engine, Baidu’s cloud platform for developers.
Sources: BNP Paribas; Vendors’ websites § Software-as-a-Service (SaaS)
Under SaaS, users access software remotely as they access data hosted in the cloud via the internet. The provider delivers an application based on uniform
application definition and users purchase the service on a pay-as-you-go basis or as a subscription based on usage metrics vs paying for upfront licensing fees in traditional software business. SaaS as a business model is pioneered by Salesforce.com since its establishment in 1999.
Notable global SaaS vendors include Salesforce.com, Concur Tech, NetSuite, Workday, ServiceNow, etc. Traditional software companies are also moving towards the SaaS model with the launch of SaaS offering including SAP (Business
ByDesign), Oracle (Oracle On Demand), Microsoft (Office 365), among others (Exhibit 9).
Domestic Chinese SaaS vendors are the traditional software companies, namely, Kingdee, Chanjet and Kingsoft, which introduced the cloud version of their traditional on-premise software products, although current cloud contribution to total revenue remains small (Exhibit 9).
EXHIBIT 8: Real life examples of SaaS
Customer Service provider Case study
Enterprises & individuals Office 365 by Microsoft Office 365 is the web version of Microsoft Office suite. Instead of paying one-off license fees before using Microsoft Office, Office 365 is subscription-based where users pay a fixed subscription fee every year, i.e USD75/year for personal users. In this way, users can use the software and access their files anywhere with internet connection versus only in their home or
What is PaaS
EXHIBIT 9: Global and Chinese cloud service providers
Global
Infrastructure-as-a-service Platform-as-a-Service Software-as-a-Service
Microsoft (Azure) Google (Google App Engine) SAP Business ByDesign
Amazon (AWS) Microsoft (Azure) Salesforce
Google (Google Compute Engine) Amazon (AWS) Oracle On Demand
HP Salesforce (Force.com) Microsoft (Office 365)
Vmware IBM (BlueMix) Concur Tech
Rackspace cloud servers Appistry NetSuite
IBM (SoftLayer) AppScale Workday
Engine Yard ServiceNow
CloudTran CloudSwitch Concur Technologies Abiquo Accelops AppDynamics Domestic
Infrastructure-as-a-service Platform-as-a-Service Software-as-a-Service
Grand Cloud Baidu (Baidu Cloud) Kingdee (K/3 cloud)
Ucloud Sina (Sina App Engine) ChanJet (T+)
CITIC Telecom CPC Tencent (Tencent Cloud) Kingsoft (WPS)
Tencent (Tencent Cloud)
Baidu (Baidu Cloud)
China Telecom
Source: BNP Paribas
Sub categories of IaaS: Storage-as-a-service and IDC
Under IaaS, there are some other sub categories of services notably, Storage-as-a-service and Internet Data Center (IDC)
§ Storage-as-a-service
Storage-as-a-service offers online digital storage on vendors’ own infrastructure for individuals or enterprises. In Exhibit 5 it would include the bottom two parts of the IaaS diagram (storage and networking).
Notable global vendors include Nirvanix, Carbonite, Google Drive, Microsoft SkyDrive, Box, Dropbox and EMC/Mozy (Exhibit 10).
In China, the competition in Storage-as-a-service, especially in the consumer market (with large free storage), is very intense with many players including prominent internet companies and small private firms. The notable ones include Baidu Cloud, Kingsoft Cloud, Qiniu.com, Upcloud, Tencent Cloud, among others (Exhibit 10). According to iResearch, the Storage-as-a-service market in China really started to kick off in 2011 and by the end of 2013 there were a total of 220 million registered users, a 108% y-y increase from 2012, and the number is projected to more than double to 550 million by 2016 (Exhibit 11).
We think the war for Storage-as-a-Service in the consumer market is likely to continue as consumers seem less concerned about online security than enterprise customers, which means that the switching cost between vendors is very low in the consumer market. Large internet companies with strong financial muscle and economies of scale are likely to squeeze the small private companies such that they may be forced to exit the market. In the enterprise market where storage is provided for a fee, service quality and online security play more important roles as
differentiators among the service providers.
What is Storage-as-a-Service
Intense competition for Storage-as-a-Service in the consumer market
EXHIBIT 10: Storage-as-a-Service vendors EXHIBIT 11: China cloud storage users Global Storage-as-a-Service Google Drive Microsoft SkyDrive Dropbox EMC Box iCloud Evernote Domestic Storage-as-a-Service Baidu Cloud Kingsoft Cloud Tencent Cloud Youdao note Kanbox Kuaipan Qiniu.com Upcloud
Source: BNP Paribas Source: iResearch
§ IDC
A key part of the cloud infrastructure is data hosting. There are typically three types of IDC vendors (Exhibit 12):
§ Managed hosting model (example, Rackspace): The hosting provider manages all aspects of data hosting (including power, cooling system, physical space), the hardware (web server, storage, networking), software and services.
§ Carrier-neutral colocation model (example, Equinix, 21Vianet): It provides the space in a data cabinet just like the managed hosting model except that the customer owns the hardware and software. Carrier-Neutral means that it allows interconnection between multiple telecommunication carriers and/or colocation providers
§ Non-neutral colocation model (example, China Telecom): Operated by telecom operators, interconnection is limited to the carrier that operates the data centre. EXHIBIT 12: Types of IDC vendors
Global Non-Neutral colocation Carrier-Neutral colocation Managed Hosters
Century Link/Savvis Equinix Rackspace
Century Link/Qwest InterXion Verizon Business
Verizon Business Telecity AT&T
Verizon/Terremark Global Switch Century Link/Savvis
AT&T SunGard Data Systems
Level 3 Comm NaviSite (Time Warner)
666.7% 365.2% 108.4% 65.0% 25.8% 17.7% 0 100 200 300 400 500 600 700 0.0 0.1 0.2 0.3 0.4 0.5 0.6
2010 2011 2012 2013 2014E 2015E 2016E (y-y %)
(b) Number of subscribers (LHS)
Growth rate (RHS)
Global cloud market development and industry dynamics
With earlier years of accumulation, cloud computing is currently at the fast development stage moving from early mainstream to mainstream, albeit with different degrees of maturity for each of the service areas on Gartner’s 2014 hype cycle of cloud computing (Exhibit 13).
EXHIBIT 13: Hype cycle of cloud computing (2014)
Source: Gartner 2014
IaaS: capital intensive and continuous pricing pressure
In 2013, the global IaaS market grew 44% y-y to USD9.2b (27% of global public cloud market excluding cloud advertising), and Gartner projects the market will increase at a five-year CAGR of 32% to reach USD37b in 2018 (Exhibit 14). IaaS is capital intensive. Globally, IaaS providers are competing vigorously for market share by aggressively investing in capabilities and global infrastructure and by cutting prices. We believe barriers to entry are not high at the early stage of IaaS market development. However, as there are significant economies of scale for IaaS providers, we believe price cuts by large vendors will increasingly put pressure on smaller vendors, making it more difficult for new smaller entrants. Eventually the IaaS market is likely to have concentrated market shares with a few big dominant vendors globally or within a region.
EXHIBIT 14: Global IaaS market EXHIBIT 15: Global IaaS market forecasts revision
Source: Gartner, 2Q14 Source: Gartner
For example, Amazon’s (the largest IaaS vendor globally) top-most priority is to gain market share in IaaS, thus it has been making frequent and large price cuts. According to RightScale, the four large public cloud providers, namely, Amazon (AWS), Microsoft (Azure), Google and Rackspace, rolled out 25 price cuts in 2013 across compute, storage and networking, compared with 22 price reductions in 2012. The 2013 average price cuts were in the range of 6-32%, led by AWS (Exhibits 16-17).
Continuous pricing cuts in the global IaaS market has led to the Gartner forecasts of IaaS revenue continue to be cut over the past few years (Exhibit 15); because of the inevitable commoditized nature of any infrastructure business, the downward pricing trend is likely to continue as competition continues to increase among the big global players.
EXHIBIT 16: Number of price cuts by vendors and services,
2013 EXHIBIT 17: Average size of cloud price reductions, 2013
Source: RightScale Source: RightScale
0 5 10 15 20 25 30 35 40 45 50 0 5 10 15 20 25 30 35 40
2013 2014E 2015E 2016E 2017E 2018E
(y-y %)
(USD b) IaaS (LHS) Change (RHS)
5 10 15 20 25
2012 2013 2014E 2015E 2016E
(USD b) forecasts made in 2Q14
forecasts made in 2Q13 forecasts made in 2Q12 0 2 4 6 8 10 12 14
AWS Azure Google Rackspace
Computer Storage DB Bandwidth Other
21 32 37 26 12 6 28 23 0 5 10 15 20 25 30 35 40 2012 2013
EXHIBIT 18: Global PaaS market EXHIBIT 19: Global PaaS market forecasts revision
Source: Gartner, 2Q14 Source: Gartner
A trend being seen globally is the integration of services between IaaS and PaaS vendors and between PaaS and SaaS vendors as customers are increasingly demanding integrated solutions. Global PaaS vendors such as Microsoft and Google, for example, have later added IaaS support, recognising enterprise customers’ demand for a combination of dedicated resources and efficiency of a shared platform.
Likewise, users of SaaS need to extend and integrate those services and turn to PaaS (such as Google App Engine). As enterprises will increasingly want to tailor the applications to meet their specific business needs through customised extensions and integration solutions, to compete in the SaaS markets, providers may eventually have to extend their offerings to include platform services for development and hosting of applications, e.g. Saleforce.com launched PaaS services Force.com in 2007.
In terms of barriers to entry, we believe PaaS is probably the highest among the three forms of cloud services. A prerequisite for leadership in software infrastructure markets has been a vendor's ability to take a leading role in establishing the prevailing programming models and architectures for software developers. This role has enabled vendors to build ecosystems of partners, which in return should lead to sustained industry leadership in a positive feedback loop.
Similarly, leadership in the PaaS market will require leadership in the evolution of standards, architectures and the ecosystem, which may take a prolonged period to build, in our view. The success factors in PaaS meant that only the global IT mega-vendors and prominent software companies had the ability to enter the market and the financial muscle to execute it, for the likes of Google, Microsoft, IBM, HP, Oracle, Salesforce.com and SAP etc.
SaaS is the most mature form of cloud services
In 2013, the global SaaS market grew 22% y-y to USD22b, and Gartner projects the market will increase at a five-year CAGR of 21% to reach USD56b in 2018 (Exhibit 20). SaaS is the largest cloud computing service type, representing over 65% of the global public cloud market (excl. cloud advertising) in 2013.
0 10 20 30 40 50 60 70 0.0 1.0 2.0 3.0 4.0 5.0 6.0 7.0 8.0
2013 2014E 2015E 2016E 2017E 2018E
(y-y %)
(USD b) PaaS Change (RHS)
1.0 2.0 3.0 4.0 5.0 6.0
2012 2013 2014E 2015E 2016E
(USD b) forecasts made in 2Q14
forecasts made in 2Q13 forecasts made in 2Q12
EXHIBIT 20: Global SaaS market EXHIBIT 21: Global SaaS market forecasts revision
Source: Gartner, 2Q14 Source: Gartner
Among SaaS, PaaS and IaaS, SaaS is the most established form of cloud services in terms of maturity of business model and variability of service applications. According to Gartner’s 2014 hype cycle of cloud computing, SaaS is positioned on the Slope of Enlightenment, reaching early mainstream with continued acceleration of SaaS applications in the market.
In Gartner's latest cloud adoption survey, 79% of organisations indicated they are using SaaS in some form as a public cloud service. In 2013, SaaS accounted for 13% of enterprise software revenue globally; and by 2018, more than 25% of IT spending on software will be on SaaS-based alternatives to traditional applications. This indication makes SaaS the most prevalent cloud model in use, in our view. Among enterprises that adopt SaaS, mid-sized enterprises tend to be the earlier adopters. SaaS has the effect of lowering upfront IT capital investment. SaaS is also appealing to companies that do not have IT resources to deploy or maintain on-premises software, which is especially prevalent among SMEs. For enterprises that are too small with a limited internal IT budget, however, the subscription-based SaaS model may be infeasible.
Salesforce.com pioneered the SaaS model in 1999, and now there are many SaaS vendors specialising in several industry verticals and service areas. Gartner has been consistently increasing its projections of the size of the global SaaS market over the past few years (Exhibit 21). We believe the SaaS market allows for various market players specialising in different sector verticals or application areas; vendors who target the mid-sized enterprise market are likely to have early wins.
The IaaS vendors have no existing competitors as more and more enterprises are moving to the cloud, so the vendors just need to persuade companies’ internal IT department to outsource the IT infrastructure. However, pure SaaS vendors (e.g. Salesforce.com) face competition from the traditional software companies (e.g. SAP, Oracle) as their SaaS products compete with both traditional on-premise
applications, as well as with SaaS offerings by traditional software companies. 0 5 10 15 20 25 0 10 20 30 40 50 60
2012 2013 2014E 2015E 2016E 2017E 2018E (y-y %)
(USD b) SaaS (LHS) Change (RHS)
10 15 20 25 30 35 40
2012 2013 2014E 2015E 2016E
(USD b) forecasts made in 2Q14
forecasts made in 2Q13 forecasts made in 2Q12
Mid-sized enterprises are at the sweet spot of SaaS adoption, in our view
China cloud market development and industry dynamics
According to Gartner, the 13% growth projection for China’s IT budget in 2014 is significantly higher than the average growth rates for world-wide markets (0.2%) and for the Asia/Pacific, including Japan (0.9%). In a survey in May 2014, cloud adoption topped the list of CIO priorities in China as more cloud-related technologies and services are coming to market from both local and global vendors (Exhibit 22). We believe cloud computing will be in the fast-deployment phase in the next couple of years.
EXHIBIT 22: Comparison of CIO priorities for China and globally
China Global
1 Cloud 1 BI/Analytics
2 Infrastructure and Data Center 2 Infrastructure and Data Center
3 Mobile 3 Mobile
4 ERP 4 ERP
5 BI/Analytics 5 Cloud
6 Networking, Voice and Data Communications 6 Networking, Voice and Data Communications 7 Digitalization /Digital Marketing 7 Digitalization /Digital Marketing
8 Industry-Specific Applications 8 Security
9 Innovation and Growth 9 Industry-Specific Applications
10 Supply Chain 10 Customer Relationship Management
11 Security 11 Legacy Modernization
12 Social 12 Collaboration
Source: Gartner, May 2014
IaaS – scarcity value in domestic IDCs as foreign IaaS players enter
In 2013, the China IaaS market grew 43% y-y to USD65m, and Gartner estimates the market will increase at a five-year CAGR of 33% to reach USD265m in 2018 (Exhibit 25). Of the total IaaS market in 2013, compute represented 87% with a five-year (2013-2018) CAGR of 35% and storage 12%, with a much lower five-five-year (2013-2018) CAGR of 4%.
China's cloud IaaS market is at an early stage of development, but is expanding rapidly. Several large and notable international cloud players have entered China, including Amazon Web Services (AWS), Microsoft (Azure), IBM (SoftLayer) and VMware (partnering with China Telecom), and there is the possibility of more players (such as HP and NTT Communications) entering the market in the near future. Domestic IaaS providers include internet companies (such as BATs and Grant Cloud) and telecom operators (China Telecom in partnership with VMware) and private companies (such as Ucloud) (Exhibit 23).
Chinese cloud IaaS providers in China and their services are new and basic. Most focus on public cloud services and have little experience of supporting enterprise requirements, which include high availability and security, service-level guarantees, and managed and professional services. Due to the lack of enterprise-grade cloud providers, adoption is mostly limited to small or mid-size businesses (SMBs). Only recently in July, China Telecom launched a hybrid cloud service in China in
partnership with VMware targeting government agencies and large corporates. China Telecom will be selling the service under its own brand, hence the technological knowhow will be provided by VMware.
EXHIBIT 23: Domestic IaaS providers
Type IaaS providers Target market
Internet companies Tencent SMEs, developers, individuals
Baidu SMEs, developers, individuals
Grand Cloud SMEs, developers, individuals
Telecom operator China Telecom (partnering with VMware) Government, mid-large enterprises
China Mobile Government, mid-large enterprises
CITIC Telecom Multinationals
Private Ucloud Gaming companies
Source: BNP Paribas
EXHIBIT 24: Cloud computing of a prominent Chinese e-commerce player
Source: iResearch
International players have strengths such as more advanced cloud platforms, established brand names outside China, experience in IT services, and a home customer base they can leverage for international expansion. However, due to regulatory restraints, international IaaS players have to partner with local companies in order to offer services in China.
In the absence of a specific regulation for cloud providers, companies aiming to offer cloud services in China must operate under two related licenses:
§ Internet data center (IDC) license: for data hosting services.
§ ISP license: for supply of internet connectivity.
Open API Cloud OS 3rdparty cloud applications 3rdparty cloud service providers Storage Database Elastic computing Security management Email Load balancing Cloud engine
EXHIBIT 25: China IaaS market
Source: Gartner, 2Q14 forecasts
In China, the number of domestic service providers with both licenses is small. Some already have partners or want to build out their own cloud services in China. While there may many local IDC players but there’s few with nation-wide presence. As such, international players may need to partner with multiple Chinese players to get access to both licenses or widen their geographic reach within the country (i.e, AWS is partnering with multiple domestic players for its IaaS offering in China).
We see scarcity value for domestic carrier-neutral, large-scale IDC vendors (i.e 21Vianet) as foreign IaaS vendors enter China looking for local partnerships.
However, IaaS globally is subject to continuous pricing pressure, and regulatory risks for foreign vendors may intensify over time as domestic IaaS vendors emerge to become more powerful players, which could adversely affect domestic cloud enablers of foreign vendors.
PaaS – domestic players wins over localisation and ecosystem
China’s PaaS market is still at an early stage of development. In 2013, total PaaS revenue in China grew 87% y-y to USD95m, and Gartner projects a five-year CAGR of 34% to USD408m in 2018 (Exhibit 26).
EXHIBIT 26: China PaaS market
Source: Gartner, 2Q14 forecasts
Despite of being a small portion of the whole public cloud computing market, PaaS adoption has been gaining momentum in China. Some Chinese internet companies have adopted the Google model (Google App Engine) and are competing in China's PaaS market, including Baidu (with Baidu App Engine), Tencent (QQ Open Platform), and Sina (Sina App Engine). Although traditionally these internet companies are not strong at software programming or infrastructure, they have been able to adopt an open API and platform approach by supporting common programming languages, 0 5 10 15 20 25 30 35 40 45 50 0 50 100 150 200 250 300
2013 2014E 2015E 2016E 2017E 2018E
(y-y %)
(USD m) Compute (LHS) Print (LHS)
Storage (LHS) Change (RHS) 0 10 20 30 40 50 60 70 80 90 100 0 50 100 150 200 250 300 350 400 450
2013 2014E 2015E 2016E 2017E 2018E
(y-y %)
such as Java, C and Python etc. Such an approach has been successful in attracting many gaming, mobile app and e-commerce companies and individuals to deploy web/mobile applications on these platforms.
Because of the importance of localisation and developer engagement in the PaaS ecosystem, as well as regulatory restraints, international vendors are inhibited from competing effectively in the growing PaaS market in China.
SaaS – enterprise mobile internet market accelerates SaaS takeoff
Similar to the global trend, the SaaS market in China is the largest and most mature among the three forms of cloud computing, growing at 31% y-y to USD159m in 2013. Gartner estimates the market will expand to USD556m in 2018, at a five-year CAGR of 29% (Exhibit 27). Popular enterprise SaaS applications include ERP, CRM, web conferencing and social software, supply chain management and office suits (Exhibit 28).
Although the current SaaS adoption among software revenue is low in China compared to the global average (2% in China vs 13% globally in 2013 according to Gartner), end-user awareness of SaaS has been significantly increasing due to vendors' education efforts in the past few years. More importantly, we believe SaaS adoption will experience rapid acceleration in the coming years as the enterprise mobile internet market rapidly develops in China.
EXHIBIT 27: China SaaS market EXHIBIT 28: China SaaS market breakdown, 2013
Source: Gartner, 2Q14 forecasts Source: Gartner
§ Enterprise mobile application market to accelerate SaaS take-off
With the world's largest population of active users of mobile devices, the enterprise mobile application market in China is gaining momentum. According to iiMedia, the market will increase to RMB22b in 2014 with a CAGR of above 70% for the next three years (Exhibit 29). In the midst of the booming consumer mobile apps market from the emergence of supper apps such as WeChat, enterprises in China are increasingly seeking digital channels innovatively to enhance business models and to conduct digital marketing with real-time customer interaction on the mobile end.
0 5 10 15 20 25 30 35 0 100 200 300 400 500 600
2013 2014E 2015E 2016E 2017E 2018E
(y-y %)
(USD m) SaaS (LHS) Change (RHS)
Business Intelligence 0.8% CRM 15.7% Digital Content Creation 6.3% Enterprise Content Management 4.4% ERP 12.9% Office Suites 10.7% Other 20.0% Project and Portfolio Mgt 4.2% Supply Chain Mgt 10.8% Web Conferencing & Social Software 14.2%
EXHIBIT 29: China enterprise mobile application market
Source: iiMedia
We believe the next battlefield in mobile internet is the enterprise market – the emergence of various enterprise mobile applications will play a key role in educating the end enterprise users and fuel the whole market growth before the integration of mobile applications leading to unified enterprise mobile platforms (Exhibit 30). EXHIBIT 30: China enterprise mobile app adoption cycle
Source: iiMedia
Some software companies moving to the cloud are strategically invested in the enterprise mobile internet market. Kingdee’s Cloud Hub is an enterprise social media platform that integrates with its ERP applications on both PC and mobile end; it is also an open platform that allows 3rd party apps. Customers of Cloud Hub include many domestic mid-sized enterprises such as Vanke (200002 CH, NR) (Exhibit 31). Others with already established user traffic in the consumer market have also made moves to the enterprise market. Tencent, for example, has recently launched the fee-based ‘Enterprise Account’ on its WeChat mobile messaging platform. It is designed to help a company manage internal communications and interaction with external parties; company employees will be able to conduct online meetings, set up company inboxes, establish individual pages and groups for specific departments, manage clients and employees. It also connects employees to third-party enterprise applications on mobile devices. Kingdee is one of the first batch of software partners of ‘Enterprise Account’ and users can access Kingdee’s ERP applications and Cloud Hub through the ‘Enterprise Account’ on WeChat (Exhibit 31).
We believe these developments are very positive in nurturing the enterprise SaaS market in China, and software companies which have made early investments in cloud services should have the first-mover advantage as the market takes off. While established internet companies such as Tencent are eying the creation of platforms in the enterprise market by levering their experience and traffic in the consumer market, they are not in competition with software companies that manufacture the software products.
While the competition in the consumer mobile app market is fierce as individuals brace the free standard, the enterprise market has much higher barriers to entry as security, stability and brand play a much important role. We expect more players to enter the SaaS market, creating an ecosystem especially in light applications, as the
0 10 20 30 40 50 60 70 80 90 0 10 20 30 40 50 60 70
2010 2011 2012 2013 2014E 2015E 2016E
(y-y %)
(RMB b) Market size (LHS) Growth rate (RHS)
Kingdee’s Cloud Hub
Tencent recently launched ‘Enterprise Account’ for WeChat
Legacy software products on the PC end is an asset in the SaaS era
market gains momentum in China. We believe software companies with established legacy software products on the PC end and early investments to integrate traditional products with mobile applications are in a good position to weather competition in the SaaS era and to gain larger market share from those which do not make the
transition to the cloud fast enough.
EXHIBIT 31: User interface of Kingdee’s Cloud Hub and Tencent’s Enterprise Account
Source: BNP Paribas
§ Anti-piracy issues associated with traditional methods of software distribution and favourable government policies promoting SaaS application development. These efforts have contributed to the decline in China’s software piracy rate from 90% in 2004 to 77% in 2011, according to the Business Software Alliance (Exhibit 32). EXHIBIT 32: China is lagging in software piracy rate
China Globe Global highest (Georgia) Global
Lowest (US) Asia-Pacific India Hong Kong Korea Taiwan Japan
2003 92 36 92 22 53 73 52 48 43 29 2004 90 35 92 21 53 74 52 46 43 28 2005 86 35 90 21 54 72 54 46 43 28 2006 82 35 88 21 55 71 53 45 41 25 2007 82 38 93 20 59 69 51 43 40 23 2008 80 41 95 20 61 68 48 43 39 21 2009 79 43 95 21 59 65 47 41 38 21 2010 78 42 93 20 60 64 45 40 37 20 2011 77 42 91 19 60 63 43 40 37 21 XXX 企业号企业号企业号企业号 XXX
As enterprises gradually move to the cloud in China, we believe local software companies’ edge over foreign ones will play out as the mid-sized enterprises tend to be early adopters. In many cases, foreign software providers must forge partnerships with local vendors in the form of technology cooperation or joint ventures (JVs) to gain access to the local market. For instance, SAP has partnered with China Communication Services to access the SME market for its SaaS HR products. The requirements on the infrastructure side in the SaaS model vs the traditional on-premise software instalment model also increase the regulatory restraints on foreign vendors due to issues with data storage, security, etc.
As SaaS is increasingly integrated with mobile applications, the social interaction for enterprise both within the organisation among company employees and outside of the organisation with the end consumers and supply chains would give domestic vendors a greater edge over foreign ones because of their deeper knowledge of user preferences on the mobile end.
Cloud computing investment implication
We prefer SaaS to IaaS and PaaS players from an investment perspective.
§ Globally, SaaS is the most mature business models than PaaS, and would represent about 60% of total investable market in the three forms of cloud computing market in 2016, according to Gartner’s latest forecasts.
§ Investment universe of PaaS is limited due to its infancy. The high entry barrier for PaaS often means that the players strategically invested in it are established IT mega-vendors or internet giants with PaaS currently producing minimal revenue stream compared with their core businesses both globally and domestically.
§ IaaS is capital intensive. The entry barrier for a universally integrated scale IaaS vendor is not low, especially for small entrants which are less capital abundant. But, the increasingly commoditised nature of the infrastructure business means there is likely to be continuous pricing pressure as the large global IaaS players compete for market shares.
§ In China, the current IaaS services on offer by domestic companies are basic compared to those of global vendors. In the data hosting space, the sub category of IaaS, we believe the carrier-neutral ones with both IDC and ISP licenses, as well as nationwide coverage, have scarcity value when foreign IaaS vendors enter into partnerships with China IDC vendors due to regulatory requirements. However, IaaS globally is subject to continuous pricing pressure, and regulatory risks for foreign vendors may increase over time as domestic IaaS vendors emerge to become more powerful players.
We prefer domestic SaaS vendors to foreign vendors in China
§ The requirements on the infrastructure side in the SaaS model vs the traditional on-premise software instalment model would increase the regulatory restraints on foreign vendors due to issues with data storage, security etc.
§ Few foreign companies have succeeded in securing contracts from SOEs or SMEs, which make up the largest customer bases in China’s enterprise software market. As we believe medium-sized enterprises will be the early adopters of SaaS rather than large enterprises, domestic vendors are likely to take a lead over foreign ones as the SaaS market takes off in China.
§ As SaaS is increasingly integrated with mobile applications, we believe the social interaction for enterprise both within the organisation and outside of the
organisation with the end consumers should give domestic vendors a greater edge over foreign ones because of their deep knowledge of user preference on the mobile end.
EXHIBIT 33: Cloud computing investment universe
SaaS PaaS 7 8 9 10 y
Global investable universe China investable universe High
Prefer SaaS vendors to IaaS and PaaS vendors
Prefer domestic SaaS vendors to foreign ones
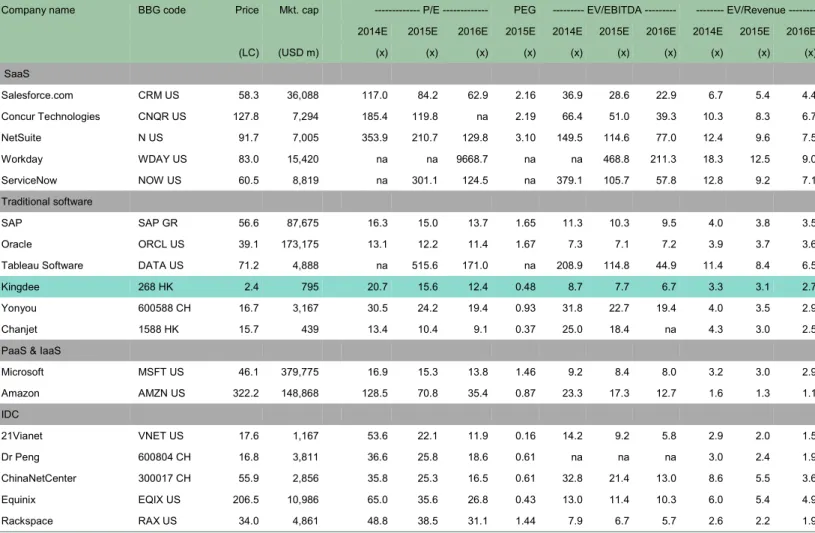
EXHIBIT 34: Cloud computing valuation comparison
Company name BBG code Price Mkt. cap --- P/E --- PEG --- EV/EBITDA --- --- EV/Revenue --- 2014E 2015E 2016E 2015E 2014E 2015E 2016E 2014E 2015E 2016E
(LC) (USD m) (x) (x) (x) (x) (x) (x) (x) (x) (x) (x) SaaS Salesforce.com CRM US 58.3 36,088 117.0 84.2 62.9 2.16 36.9 28.6 22.9 6.7 5.4 4.4 Concur Technologies CNQR US 127.8 7,294 185.4 119.8 na 2.19 66.4 51.0 39.3 10.3 8.3 6.7 NetSuite N US 91.7 7,005 353.9 210.7 129.8 3.10 149.5 114.6 77.0 12.4 9.6 7.5 Workday WDAY US 83.0 15,420 na na 9668.7 na na 468.8 211.3 18.3 12.5 9.0 ServiceNow NOW US 60.5 8,819 na 301.1 124.5 na 379.1 105.7 57.8 12.8 9.2 7.1 Traditional software SAP SAP GR 56.6 87,675 16.3 15.0 13.7 1.65 11.3 10.3 9.5 4.0 3.8 3.5 Oracle ORCL US 39.1 173,175 13.1 12.2 11.4 1.67 7.3 7.1 7.2 3.9 3.7 3.6
Tableau Software DATA US 71.2 4,888 na 515.6 171.0 na 208.9 114.8 44.9 11.4 8.4 6.5
Kingdee 268 HK 2.4 795 20.7 15.6 12.4 0.48 8.7 7.7 6.7 3.3 3.1 2.7
Yonyou 600588 CH 16.7 3,167 30.5 24.2 19.4 0.93 31.8 22.7 19.4 4.0 3.5 2.9
Chanjet 1588 HK 15.7 439 13.4 10.4 9.1 0.37 25.0 18.4 na 4.3 3.0 2.5
PaaS & IaaS
Microsoft MSFT US 46.1 379,775 16.9 15.3 13.8 1.46 9.2 8.4 8.0 3.2 3.0 2.9 Amazon AMZN US 322.2 148,868 128.5 70.8 35.4 0.87 23.3 17.3 12.7 1.6 1.3 1.1 IDC 21Vianet VNET US 17.6 1,167 53.6 22.1 11.9 0.16 14.2 9.2 5.8 2.9 2.0 1.5 Dr Peng 600804 CH 16.8 3,811 36.6 25.8 18.6 0.61 na na na 3.0 2.4 1.9 ChinaNetCenter 300017 CH 55.9 2,856 35.8 25.3 16.5 0.61 32.8 21.4 13.0 8.6 5.5 3.6 Equinix EQIX US 206.5 10,986 65.0 35.6 26.8 0.43 13.0 11.4 10.3 6.0 5.4 4.9 Rackspace RAX US 34.0 4,861 48.8 38.5 31.1 1.44 7.9 6.7 5.7 2.6 2.2 1.9
Note: P/Es are calendalised Bloomberg adjusted P/Es for companies not under coverage; priced as of 7 October 2014 Sources: BNP Paribas estimates for Kingdee, all others are Bloomberg consensus estimates
Appendix
EXHIBIT 35: List of companies mentioned in the report
Company Bloomberg code
Abiquo Not listed
Accelops Not listed
Amazon AMZN US
AppDynamics Not listed
Appistry Not listed
AppScale Not listed
Baidu BIDU US
DropBox Not listed
ChanJet 1588 HK
China Telecom 728 HK
CITIC Telecom 1883 HK
CloudSwitch Not listed
Concur Technologies CNQR US
Dropbox Not listed
EMC EMC US
Engine Yard Not listed
Evernote Not listed
Google GOOGL US HP HPQ US IBM IBM US Kingdee 268 HK Kingsoft 3888 HK Microsoft MSFT US Netflix NFLX US NetSuite N US Oracle ORCL US Qihoo 360 QIHU US
Qiniu.com Not listed
Rackspace RAX US Salesforce.com CRM US SAP SAP US ServiceNow NOW US Sina SINA US Tencent 700 HK
Ucloud Not listed
VMware VMW US
Workday WDAY US
Xiami.com Not listed
On cloud nine
n Revenue growth to return after shift in sales channel mix After two years of decline, we expect revenue to return to growth in 2015 and normalize at the ERP software sector’s double-digit organic growth rate in 2016. We expect this to be driven by Kingdee having adjusted its product mix (back to off-the-shelf software sales) and sales channel mix (back to indirect sales) by 2016.
n Margin expansion on the horizon
Our analysis of Kingdee’s margins vs its historical margins and peers shows significant scope for improvement. As revenue growth returns, we expect operating leverage to kick in (particularly through sales and marketing cost efficiencies). We expect Kingdee’s OP margin to expand from 21% in 2014 to 26% by 2016.
n First mover advantage as SaaS market takes off in China Kingdee’s early investment in the cloud provides a first-mover advantage over domestic competitors as SaaS gains momentum in China, and scope to drive consolidation in China’s fragmented SME software market. As enterprises move to cloud and mobile platforms, we see Kingdee’s legacy PC-based ERP product as an asset that will help it weather inevitable competition in light enterprise applications.
n Initiate at BUY with a HKD3.80 TP
We initiate at BUY with a HKD3.80 TP set at 25x FY15E PE equating to 0.8x FY15E PEG. We see 6%/10% upside to the Bloomberg consensus 2015/2016 earnings. We think our target trading multiple could expand as Kingdee’s competitive edge in the cloud era becomes more visible to investors.
Revenue growth and operating margin outlook
Sources: Company data; BNP Paribas estimates
(10) 0 10 20 30 (20) 0 20 40 60
2008 2009 2010 2011 2012 2013 2014E 2015E 2016E
(%)
(y-y %) Revenue growth (LHS) OP margin (RHS)
INITIATION 21 HONG KONG TAIWAN
CHINA /SOFTWARE &SERVICES
KINGDEE INT'L 268 HK
BUY
TARGET PRICE HKD3.80 CLOSE HKD2.40 UP/DOWNSIDE +58.3% PRIOR TP HKD CHANGE IN TP %HOW WE DIFFER FROM CONSENSUS MARKET RECS
TARGET PRICE (%) 3.3 POSITIVE 12 EPS 2014 (%) (0.3) NEUTRAL 2 EPS 2015 (%) 6.0 NEGATIVE 1 Zoe Zhu [email protected] +852 2825 1120 Alen Lin [email protected] +8862 8729 7061 KEY STOCK DATA
YE Dec (RMB m) 2013A 2014E 2015E 2016E Revenue 1,602 1,630 1,733 1,898
Rec. net profit 127 235 313 393
Recurring EPS (RMB) 0.05 0.09 0.12 0.15 EPS growth (%) nm 83.9 32.3 25.6 Recurring P/E (x) 37.9 20.6 15.6 12.4 Dividend yield (%) 0.0 1.2 1.8 2.4 EV/EBITDA (x) 10.9 8.7 7.6 6.7 Price/book (x) 2.7 2.6 2.3 2.1 Net debt/Equity (%) 32.8 28.4 19.1 10.4 ROE (%) 7.6 12.9 15.6 17.6
Share price performance 1 Month 3 Month 12 Month
Absolute (%) (10.5) (10.5) (6.3)
Relative to country (%) (3.2) (11.1) (8.9)
Next results March 2015
Mkt cap (USD m) 790
3m avg daily turnover (USD m) 6.3
Free float (%) 70
Major shareholder CEO, Xu Shao Chun (31%)
12m high/low (HKD) 3.52/1.89
3m historic vol. (%) 32.6
ADR ticker -
ADR closing price (USD) -
Issued shares (m) 2,552
Sources: Bloomberg consensus; BNP Paribas estimates
(37) 13 63 1.00 3.00 5.00 7.00 9.00 11.00
Sep-13 Dec-13 Mar-14 Jun-14 Sep-14
(%) (HKD) Kingdee Int'l Rel to MSCI China
Investment thesis
Kingdee is the leading domestic enterprise resource planning (ERP) software company for small- to medium-sized
enterprises (SME) in China.
With early investments in ERP cloud products targeting medium-sized enterprises, which tend to be early adopters of SaaS, we believe Kingdee has a first-mover-advantage over domestic peers as the enterprise SaaS market gains momentum in China. Also, as issues of data storage and security in the SaaS model are likely to inhibit foreign vendors from competing effectively, we think the industry transition to cloud provides Kingdee with great scope to consolidate the currently fragmented SME software market.
2014 will be Kingdee’s first year with normalized earnings after two years of transition. We see 6%/10% upside to consensus 2015/2016 earnings estimates as Kingdee’s top-line growth returns to organic double-digit growth in top-line with the industry trend and with significant margin expansion when operating leverage kicks in (particularly through sales and marketing cost efficiencies) and the shift in sales channel mix is complete.
Catalyst
Positive share price catalysts include: 1) revenue growth starting to return; 2) continued margin expansion; 3) the sale of its Beijing software park improving its balance sheet by reducing interest expenses; and 4) cloud revenue gaining momentum.
Risks to our call
Key downside risks to our call include: 1) a major economic slump in China adversely affecting IT budgets of enterprise customers; 2) weaker-than-expected operating margins; and 3) slower-than-expected cloud revenue growth.
Company background Key assumptions
Kingdee is a leading provider of enterprise resource planning (ERP) and cloud services in China founded in 1991 and headquartered in Shenzhen, China. It has traditionally been considered the Chinese version of SAP (SAP US, NR) or Oracle (ORCL US, NR), with over 20 years history selling ERP software.
2012 2013 2014E 2015E 2016E
Total revenue growth rate (%) (12.7) (9.3) 1.8 6.3 9.5
Operating margin (%) (5.8) 14.9 21.2 23.9 25.9
Source: BNP Paribas estimates
Principal activities (revenue, FY14E) Earnings sensitivity
--- Base --- --- Better --- --- Worse --- 2014E 2015E 2014E 2015E 2014E 2015E Total revenue growth rate (%) 1.8 6.3 6.8 31.5 (3.2) 1.3 EPS (HKD cents) 9.2 12.2 9.8 12.9 8.6 11.5
Change (%) 6.6 5.6 (6.6) (5.6)
Operating margin (%) 21.2 23.9 22.2 24.9 20.2 22.9 EPS (HKD cents) 9.2 12.2 9.8 12.8 8.6 11.6
Change (%) 6.3 5.0 (6.3) (5.0)
Change in total revenue growth (%) 5.00 5.00 (5.00) (5.00)
Change in operating margin (%) 1.00 1.00 (1.00) (1.00)
Key executives Source: BNP Paribas estimates
Age Since Title Key assumptions include revenue growth and operating
Sales of software license (52.11%)
Services (44.99%)
Sales of computers and related (2.9%)
Executive summary
Kingdee is the leading domestic ERP software company for SMEs in China. With earlier investments in ERP cloud products/services that target the medium-sized enterprises that tend to be early adopters of SaaS, we believe Kingdee will enjoy first-mover-advantage over its domestic peers as the enterprise SaaS market gains momentum in China. Also, as issues of data storage and security in the SaaS model could inhibit foreign vendors from competing effectively, we think the industry transition to cloud products provides Kingdee with great scope to drive consolidation in the otherwise fragmented SME software market.
2014 will be the first year of normalized earnings after two years of transition. We see 6%/10% upside to the Bloomberg consensus 2015-2016 earnings as Kingdee’s top-line growth returns to organic double-digit growth and margins expand significantly as operating leverage, in particular sales & marketing cost efficiencies, and its shift in sales channel mix is complete.
Our HKD3.80 TP is set at 25x FY15E PE, equating to 0.8x FY15E PEG roughly on a par with its key domestic peer Yonyou (600588 CH) and lower than global peers. We think our target trading multiple could expand as Kingdee’s cloud contribution rises and its competitive edge in the cloud era becomes more apparent to investors. Key downside risks to our call include: 1) a major economic slump in China adversely affecting IT budgets of enterprise customers; 2) weaker-than-expected operating margins; and 3) slower-than-expected revenue growth from cloud products/services.
Structural growth of software installation among SMEs
According to MIIT statistics, the China software application market grew by more than 20% y-y from 1H08 to 1H14 in all half years except during the financial crisis in 2009 when growth dropped to low-single digits but was still better than many other cyclical sectors (Exhibit 1).
We believe China’s software market is still in a structural growth phase and expect continued penetration of software application in the economy to lead to sustained double-digit revenue growth in the absence of major economic slumps. All studies of developed markets reveal that the software industry contributes an increasing amount to GDP. For example, from 1997 to 2012, US software industry production increased from USD149b to USD425b with its direct share of US GDP rising from 1.7% to 2.6%. China’s software industry contributed just 1.7% of GDP in 2013. Among enterprise software applications, the enterprise resource planning (ERP) market in China is projected to grow to USD1.6b in 2018 with a five-year CAGR of 11%, according to Gartner (Exhibit 2). As the SME market is still extremely under-penetrated for ERP installation in China, and as inflation and higher labour costs are pushing Chinese enterprises/SMEs to enhance their core operating efficiencies, we believe the SME software market in China will continue to see solid growth as penetration rises. Kingdee, as the No1 market share leader in ERP software among SME customers in China, stands to benefit from this secular sector growth, in our view. The company’s mid-teen top-line growth achieved in the 2008-2009 GFC period highlights the secular growth in software penetration among SMEs in China even during times of macroeconomic challenge.
EXHIBIT 1: China software application market EXHIBIT 2: China ERP software market forecast
Source: MIIT Source: Gartner, 2014
0 10 20 30 40 50 60 0 100 200 300 400 500 600 1 H 0 8 H 2 0 8 1 H 0 9 H 2 0 9 1 H 1 0 H 2 1 0 1 H 1 1 H 2 1 1 1 H 1 2 2 H 0 1 2 1 H 1 3 2 H 1 3 1 H 1 4 (%)
(RMB b) Revenue (LHS) Growth rate (RHS)
0 200 400 600 800 1,000 1,200 1,400 1,600 1,800 2 0 1 1 2 0 1 2 2 0 1 3 2 0 1 4 E 2 0 1 5 E 2 0 1 6 E 2 0 1 7 E 2 0 1 8 E (USD m)
Software to GDP penetration should rise as a China becomes more advanced
ERP software is still extremely under penetrated in China among SMEs
Revenue growth to return after strategy reversal
As the leading ERP software company in China, Kingdee benefits from the industry’s overall secular growth. However, Kindgee’s revenue growth has been volatile since 2010 (>40% revenue growth in 2010-2011 and falling revenue in 2012-2013) as the company had a strategic misstep in 2010-2011; after two years of restructuring and right sizing, its revenue stabilised in 1H14 (0.7% y-y) and, we believe, will start to return next year and reach normalized organic double-digit growth in 2016 once restructuring and optimization of distribution channels is complete.
In June 2010, Kingdee entered a strategic partnership with IBM (IBM US, NR) to provide integrated ERP applications and services for enterprises in China. A
dedicated software service delivery team was created for Kingdee's EAS products by IBM which could also join Kingdee's sales team to cross-sell IBM services. After this partnership, Kingdee aggressively expanded into the customised solutions and IT consulting services for larger enterprises from its previous core business of selling off-the-shelf software for SMEs. Following this strategic change, Kingdee appointed Mr Feng Guohua (ex IBM) as president of the group and CEO of Kingdee Software (China) in Jan 2011.
In implementing this strategic transformation into an IBM-like IT services company, Kingdee added a significant number of IBM-Kingdee implementation consultants to drive revenue from larger enterprises. In 2010 and 2011, revenue rose more than 40% y-y (Exhibit 3), but its operating margin more than halved to 9.4% in 2011 due to both the lower gross margin of the new management and IT solutions business and surging sales and marketing expenses. This resulted in lower operating profit in 2011 than the pre-IBM partnership period (Exhibits 3-5).
In early 2012, with the exit of Mr Feng Guohua and resumption of the business strategy of founder Mr Xu Shao Chun, Kingdee began to reverse this strategy and to re-focus on selling off-the-shelf software products to SMEs. After a year of operating loss in 2012, operating profit returned to pre-IBM-partnership levels in 2013 and is set to recover further (Exhibit 4).
As of today, Kingdee is still undergoing the reversal of product mix (reduction of implementation revenue and increase of off-the-shelf software sales revenue) and shift in sales distribution mix (more towards indirect sales than direct sales). As part of the strategy reversal, its indirect sales proportion has risen from 21% in 2012 to 39% in 1H14; we expect it to rise further to 48% in 2015 and stabilize at 50% in 2016. As sales channel mix shifts towards indirect sales, top-line growth will not fully reflect the double-digit shipment growth because indirect sales tend to have lower ASPs than direct sales. However, as the transition normalizes in 2016, Kingdee’s revenue growth should return to organic double-digit industry growth (Exhibit 3).
EXHIBIT 3: Revenue growth to return EXHIBIT 4: Operating profit has returned
Sources: Company; BNP Paribas estimates Sources: Company; BNP Paribas estimates
(50) (40) (30) (20) (10) 0 10 20 30 40 50 (50) (40) (30) (20) (10) 0 10 20 30 40 50 2 0 0 8 2 0 0 9 2 0 1 0 2 0 1 1 2 0 1 2 2 0 1 3 2 0 1 4 E 2 0 1 5 E 2 0 1 6 E (%) (y-y %)
Revenue growth (LHS) % indirect sales (RHS) IBM partnership Strategy reversal Revenue growth normalization (200) (100) 0 100 200 300 400 500 600 (20) (10) 0 10 20 30 40 50 2 0 0 8 2 0 0 9 2 0 1 0 2 0 1 1 2 0 1 2 2 0 1 3 2 0 1 4 E 2 0 1 5 E 2 0 1 6 E (RMB m) (y-y %)
Revenue growth (LHS) Operating profit (RHS) The IBM partnership in 2010-2011
Strategy reversal half-way done; revenue growth to return next year
Further OP margin expansion on the horizon
By analysing Kingdee’s historical margin breakdown and comparison to its peers’, we see significant upside to the company’s margin outlook as it continues to shift
towards indirect sales and as sales and marketing efficiencies kick in as revenue growth returns. We expect its overall OP margin to return to >20% level in line with the pre-IBM partnership period by the end of this year and to expand to 23.6% next year and 26% in 2016.
EXHIBIT 5: OP margin vs percentage of indirect sales EXHIBIT 6: Direct sales vs indirect sales (illustration only)
Direct sales Indirect sales Shipment value 100 100 Revenue realized 100 80 Gross margin (%) 70 88 Gross profit 70 70 Sales & marketing expense (40) (30) SG&A expenses (12) (10) Other expenses (10) (10) Operating profit 8 20 Operating margin (%) 8 25
Sources: Company data; BNP Paribas estimates Source: BNP Paribas
Compared to direct sales, indirect sales realize lower revenue given the same shipment value of software products sold as the third party sales channel retains a profit margin for its sales efforts. However, gross margins are better given the same cost of goods sold. Sales and marketing costs and SG&A costs can be saved significantly resulting in better operating profit and higher operating margins as illustrated in Exhibit 6.
Compared to mature software companies in developed countries such as SAP and Oracle, as well as to its domestic peer ChanJet (1588 HK, NR), one expense item that stands out is Kingdee’s significantly high sales and marketing expense as a percentage of revenue. This figure is 20-25% for mature software companies in mature markets such as SAP and Oracle vs 38% for domestic peer ChanJet and 52% for Kingdee in 2013 (Exhibit 8).
EXHIBIT 7: 2014-16E S&M costs to rise in absolute terms but
efficiency improves EXHIBIT 8: Peer comparison of expense efficiency
2013 as % of revenue Kingdee SAP Oracle ChanJet (%) (%) (%) (%) Cost of goods 25 30 4 9 Sales & marketing 52 25 20 38 SG&A as % of revenue 13 5 3 15 R&D 15 14 13 20 0 10 20 30 40 50 60 (10) (5) 0 5 10 15 20 25 30 2 0 0 8 2 0 0 9 2 0 1 0 2 0 1 1 2 0 1 2 2 0 1 3 2 0 1 4 E 2 0 1 5 E 2 0 1 6 E (%)
(%) OP margin (LHS) % indirect sales (RHS)
40 50 60 70 800 1,000 1,200 1,400 (%)
(RMB m) Sales & marketing cost (LHS)
as % of revenue (RHS)
Significant room for margin improvement compared to global and domestic peers
As Kingdee continues to optimise its sales distribution channels towards indirect sales, its sales and market expense as a percentage of revenue should fall naturally. Following the 7.4ppt y-y reduction in sales and marketing cost as a percentage of revenue in 1H14 when the company scaled down its direct sales force, we expect the ratio to continue to fall to 47% this year and to 44% by 2016, although we expect sales and marketing expenses to start growing in absolute terms starting next year (Exhibit 7). As mentioned at the beginning of this section, we expect this operating leverage (mainly from sales and marketing efficiency) as revenue growth returns to drive overall OP margin expansion to >20% by the end of this year, in line with the pre-IBM partnership period, and to expand further to 23.6% next year and 26% in 2016 (Exhibit 9).
EXHIBIT 9: Operating margin expansion
2008 2009 2010 2011 2012 2013 2014E 2015E 2016E
Medium-long term (%) (%) (%) (%) (%) (%) (%) (%) (%) (%) Gross margin 78.9 78.1 76.5 70.1 65.0 75.3 79.3 79.9 80.9 80.0 Sales & mkting as % of revenue 49.0 52.5 54.7 60.8 65.3 51.7 46.1 44.9 43.7 40.0 SG&A as % of revenue 15.5 12.6 11.3 12.6 12.3 12.8 9.9 10.0 10.0 10.0 R&D as % of revenue 10.4 9.1 8.4 8.3 11.3 14.5 15.0 15.0 15.0 15.0 OP margin (excl. other gains) 4.0 3.9 2.1 (11.6) (24.0) (3.7) 8.4 10.0 12.2 15.0 OP margin 20.9 22.0 20.9 9.4 (5.8) 14.9 21.2 23.9 25.9 29.0
Sources: Company data; BNP Paribas estimates
In the medium to long term, we believe Kingdee can achieve an OP margin of 29% as its gross margin returns to c80% (as it was in 2007-2009) with (as percentages of revenue) sales and marketing costs declining to 40% as the company matures and SG&A remaining at 10% and R&D at 14-15% (Exhibit 9).