Electrical and Computer Engineering Program
FALL 2019 ECEN 403-901: ELECTRICAL DESIGN LAB
Project proposal
Monitoring The Carbon Footprint Emission in the TAMUQ Building
Team Members:
Dana El-saafin
Sara Al-Hamad
Amera Jama
Team Mentor:
Dr. Ali Ghrayeb
Course Instructor:
Dr. Ali Ghrayeb
Due date:
22 of September,2019
On my honor, as an Aggie, I have neither given nor received unauthorized aid on
this academic work.
TABLE OF CONTENTS
Chapter 0: Abstract 3 Chapter 1: 4-6 1.0 Introduction 1.1 Motivation 4 1.2 Problem statement 4 1.3 Literature review 4-5 1.4 Proposed solution 5-6 Chapter 2: 2.0 Proposed Design 6-92.1 System level details 6
2.2 Functionality 7
2.3 Design constraints 9
2.4 Standards 9
2.5 anticipated results 9
Chapter 3: Design component 9
Chapter 4: Estimated budget and justification 10
Chapter 5: Timeline 11
Chapter 6: Conclusion 12
Abstract
Human development is compromised due to high levels of carbon dioxide in the
atmosphere. Qatar is negatively imaged since it is ranked as the highest carbon dioxide emitter per capita globally [1]. Due to the low population and the amount of energy produced, Qatar’s position has made it challenging for green investments to take place which is a major issue [1] that affects the economy of Qatar. For this project, our aim is to limit the carbon footprint by monitoring it and proposing solutions to reduce the amount emitted. We are considering Texas A&M University at Qatar (TAMUQ) building as our case study to examine the number of energy consumed, convert it to carbon dioxide emission, and find a solution to reduce the amount of energy consumed using a carbon footprint calculator. Energy consumption is directly proportional to carbon
dioxide emissions. Since TAMUQ consists of several labs, lecture rooms, offices the amount of power needed is substantial. However, monitoring the amount of energy used through an application can result in using less electricity more efficiently. Finally, LabVIEW will be used to implement our design. LabVIEW is a system engineering software that is built to help create applications that require measurements, testing, and control with rapid access to hardware [2]. It also offers a graphical programming
1.0 Introduction 1.1Motivation
Over the last decades, global temperatures increased due to the burning of fossil fuels and the release of greenhouse gases [3]. Greenhouse gases absorb long-wave infrared radiation that is radiated from earth surfaces and release some back to the outer
space[4]. Infrared radiation is invisible to the eye but can be detected through heat sensors, or the sensation of warmth on the skin [5]. The increase of greenhouse gases, carbon dioxide, in particular, led to trapping heat instead of releasing it back to outer space, which also led to the increase of climate temperatures. “The term carbon footprint refers to the total greenhouse gas emissions associated with a particular policy, individual, event, development or product [4].” In our case, the carbon footprint can be used to measure the amount of carbon dioxide released due to the energy consumption of a building. The reason why this is significant is that historically Carbon dioxide in the atmosphere was estimated to be just below 300ppm(parts per million), whereas, as the industrial sector start to rise, the Carbon dioxide levels increased up to 400ppm today and rising[6]. Today, with the increase of population, economic growth, and building operations carbon dioxide emission is significantly increasing[3]. Large buildings such as Texas A&M University at Qatar consume more energy taking into account offices, laboratories, air conditioning, and more.
1.2 Problem Statement
Texas A&M University at Qatar (TAMUQ) building will be the case study for this project. As mentioned previously, TAMUQ is a large building that provides different services such as air conditioning, laboratories, and more. This means that the building requires a sufficient amount of power which is a major issue. TAMUQ building ranked second in Education City for the amount of energy used. This also means that the building ranked second in Education City for the amount of carbon dioxide emitted in the atmosphere. TAMUQ’s frontal image must satisfy to support the environment by contributing to decreasing the levels of carbon dioxide emission and sustaining energy.
1.3 literature review
1.3.1 Laws and regulations:
Environmental regulations were established because of the huge growth of the population and the use of fossil fuel to provide energy. Qatar is a developing country, and the economy is based on the hydrocarbon industry. The State of Qatar is keen to
preserve the natural resources and the environment and to take a global leadership role in addressing these issues by signing the following treaties [7]
• Vienna Treaty for the Protection of the Ozone Layer • 1987 Montreal Protocol on Ozone Depleting Substances • 1992 International Convention for Climate Change • 1994 Convention for Combating Desertification • 2005 Kyoto Protocol (ratified)
1.3.2 Standards:
In order to do analysis for the data and come up with a meaningful comparison, we must follow specific standards. Since we are taking TAMUQ building as a case study, we will focus on activity-based standards. The Intergovernmental Panel on Climate Change (IPCC ) published guideline documents in 1996 In order to manage greenhouse gas emissions. Then in 2001, the Greenhouse Gas Protocol Initiative published the Corporate GHG Protocol standard based on the guidelines provided by (IPCC ) [8]. These standards are adapted differently where each organization set its specifications but derived from the same documents and same standards. The tool used for carbon footprint analysis for universities is The Campus Carbon Calculator (CCC). This tool is provided by the non-profit Clean Air-Cool Planet and the Sustainability Institute at UNH in 2001. In our project, we will refer to the standards provided by the International Organization for Standardization (ISO 14064-1:2006, ISO 14064-2:2006)
1.3.3 Proposed Methods
Many types of carbon footprint calculators are available online. Most of these
calculators are not profitable. These calculators aim to give the user an estimation of their carbon emission. U.S. Environmental Protection Agency (USEPA), American Forests and The Conservation Fund are famous examples of carbon footprint calculators. All of these calculators that can be used to track the household carbon emission. The user is required to enter their home energy consumption to provide an estimation for their CO2 emissions annually. The difference lies in the vision of the institution(USEPA) aim to motivate the user to take action in order to minimize their emission while American Forests and The Conservation Fund aim to Conserve the environment by motivating the consumer to donate to plant more trees[9].
Process-based life cycle assessment (P-LCA) and input-output based life cycle assessment (IO-LCA) are the two main approaches commonly used to quantify the negative impact human activities and products have on the environment. In this study, the authors merged the two assessment and proposed focused analysis to determine the emission of GHG. The author defined three scopes; Scope 1 includes burning fossil fuel for on-site construction, scope 2 is for electricity consumption and scope 3 for activities that indirectly contribute to the emission of GHG such as maintenance and
repairs. The collected data are publicly available under the EIO-LCA database along with other data gathered from e U.S. Bureau of Economic Analysis and U.S.
Environmental Protection Agency (EPA). Based on the data, GHG emission can be computed by multiplying the data with their crossing emission factors. The analysis was performed on both residential buildings and commercial buildings. The results showed that more than 45 % of the GHG emission is caused by electricity consumption for both residential and commercial buildings. Results show that an energy efficiency plan would significantly contribute to the reduction of carbon emission[10].
Lastly, in this study, the authors propose a comprehensive approach that can be used in the analysis of carbon emission. Four indicators were introduced Carbon Intensity, Dependency, Exposure, and Risk. For each indicator, an equation was constructed` and tested in different scenarios. His method can help to allocate the sources that cause the most emission in order to apply energy efficiency policies on that source. For carbon usage, the authors divided their scopes similar to the previous paper. This approach, they have only applied the method on scope 1 and 2 excluding 3.
1.4 proposed solution
The aim of our project is not just to quantify carbon emission in TAMUQ but to design a monitoring system that can process the given data in order to come up with optimum usage of energy in the building. The proposed solution consists of two parts. In the first part, we are going to design a real-time monitoring system that calculates the carbon footprint in TAMUQ. The second part is to propose solutions to minimize the energy usage that, in turn, will contribute to reducing carbon dioxide emissions. Carbon footprint analysis can be done for an individual level or organizational level. The
complexity of the calculator will depend on the size of the selected group. The larger the scope of the calculator, the more complex the calculator will be. The obtained results will be enriched with more information for bigger groups, and this will be useful when doing the analysis and coming with recommended solutions.
2.0 Proposed Design
2.1 System Level details:
Qatar is ranked by the intergovernmental panel on climate change (IPCC) as the
highest CO2 per capita emitter globally [1] which has a huge impact on the environment and society. The need of a monitoring system for the carbon footprint is required since Qatar’s investments are affected by its high carbon emission [11], and for the reason that the World Cup for 2022 is coming. The proposed design is divided into two parts that complete each other. first is to create a monitoring system that measures the building’s carbon footprint by converting the energy consumption of all the components in the building to carbon footprint emission, and the second is to propose solutions to reduce the carbon footprint in TAMUQ building. The design will be assessed by following specific steps, first is selecting the greenhouse gasses (GHG) which is CO2 for our design, and setting the boundaries of the design which we chose as a building
and specifically Texas A&M building at Qatar which is under scope 2 guided by the GHG protocol. Scope 2 is responsible for covering the indirect emissions from the generation of purchased electricity, heating and cooling used by the reporting company [12]. The next step would be collecting the necessary data from the university and specifically from the office of building operations (OBO). The collected data will be analyzed and divided according to the components that we will study which are air conditioning systems, lighting, and devices. The energy consumption of each
component will then be converted to CO2 emission. The translation of data to carbon footprint is done by following certain steps, starting with the calculations needed to translate the energy consumption in kWh to carbon emission in kgCO2e where it is done using the equations available by EPA (The Environmental Protection Agency) and multiplying the value in kWh by the carbon emission factors that are set by EPA [13]. After this, we would be able to know the carbon footprint in the TAMUQ building. But we will not stop here, as we are aiming to create a monitoring system to give us real-time data. This data will be updated continuously in this way we will have an indication of the area that has high carbon emissions, and then figure out the components that release more CO2 than others. this will help us know the reason and try to control it by doing simulations on the component to improve its energy consumption results and make it power efficient. According to the United States Environmental Protection Agency a 5.4% power reduction can be made by adjusting the temperature by 1 degree Celsius [14]. LED are energy efficiency component and also solar bulbs are available, easy to implement and affordable. Lastly focus on reducing power consumption in computer labs and offices.
2.2 Functionality:
The objective of our project is to build a carbon footprint calculator to measure the carbon footprint in TAMUQ building and monitor it to propose solutions to reduce it. The calculator is expected to have higher accuracy than existing calculators and it relies on data collected from the university. For this design we have two approaches, the first is building the calculator on our own and creating the monitoring system, and the second approach is collaborating with Siemens to use their mind sphere platform and their smart meters to create the design. For the first approach to make it efficient and applicable we first decided to code our carbon footprint calculator using National Instruments’ Labview Virtual Programming software to build our calculator and include the necessary calculations and components we need. Then we will use Compact RIO for data acquisition. It will also give us updated data to monitor the carbon footprint. In addition to monitoring, the user will be able to reduce the carbon emission by checking the proposed solutions. We will work on making the necessary simulation and
calculation to propose solutions to reduce carbon footprint emission in TAMUQ using the data we receive from the university. We will then develop solutions to make the components more power efficient to reduce the carbon emissions and lower the power cost. For the second approach which is contacting Siemens, we will need more
information to make sure that it will be applicable for our design. The proposed depend on what type of data TAMUQ can provide us with and to what extent they allow us to
make any modification. But some realistic solutions we believe will significantly will reduce CO2 emission in the building are increasing the temperature by one to two degrees, using solar bulb lights and LED lights for lighting and minimizing power consumption by loads.
Figure 1: Showing the proposed design flowchart
2.3 Design constraints:
The proposed design goal is to monitor and keep track of CO2 emission to propose solutions to help reduce it. But this design has constraints that limit its effectiveness and application. Starting with data collection, TAMUQ uses one meter to measure the
energy consumption of the building, whereas, we need to measure each component’s energy consumption. Another constraint is that the air conditioning system in TAMUQ is connected to other universities in Qatar foundation so any change might cause an issue. In addition, applying smart meters or doing testing might need authorization and it depends on the approval of the university.
2.4 Standards:
In our project we will follow two types of standards Corporate GHG Protocol standards provided by (IPCC ) and the International Organization for Standardization (ISO)
standards since they provide us with specifications and guidelines that we will follow in the implementation of the design. To maintain sustainability and reliability we will use the mentioned standards that are well explained in the literature review section.
2.5 anticipated results
Our design will be expected to calculate the energy consumption of each component in the TAMUQ building. Then make the necessary conversions to translate it to carbon footprint emission to be able to monitor the carbon footprint emission in the whole building by using the data in the university. In addition, the proposed design is expected to give the user an indication of the area that has a higher carbon footprint emission than the other areas in the building. Knowing the area with the highest emission will help us to make the necessary simulations to limit and reduce carbon footprint emission in the area. Monitoring is the first part where we keep track of carbon footprint in the building then try to limit the carbon emissions. We aim to reduce the carbon footprint by several percentages adjusting the temperature and avoiding using screensavers and turning off devices when they are not used. Lastly, raising awareness among students and faculty,their involvement will be a key factor for reducing energy consumption and carbon footprint
3.0 Design components
In our project, we have two approaches, in the first approach we will use the master meter in TAMUQ building for energy consumption measurements. we will use
CompactRIO Model NI-9225 for data acquisition and then insert the data into LabVIEW in order to design the calculator and the monitoring system. In the second approach, we
will use the smart meters provided by siemens for energy consumption measurements. We will build the monitoring system using their mindsphere platform
4.0 Estimated Budget and Justification:
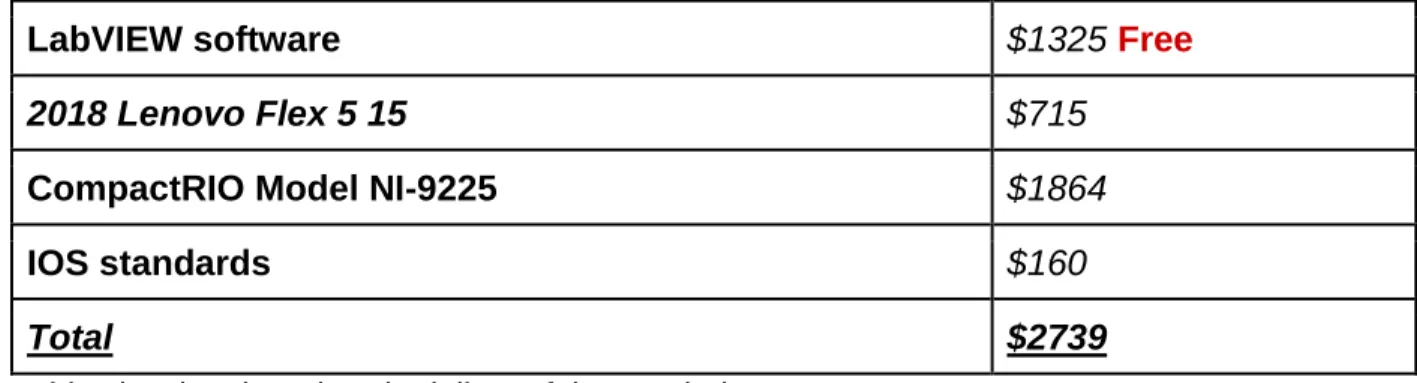
The proposed design has two approaches, so we have two budgets depending on the data we will get from the university and from Siemens. For the first approach which is building our own calculator, we will need a software and we chose LabView to create a monitoring system. To run the code, we will need a laptop, and the preferable laptop is Lenovo flex. In addition, we will need a CompactRIO for data acquisition. Since we are following ISO standards, we will need to purchase the full document. But for the second approach, we will need to use the mind sphere platform to create our monitoring
system, also using a smart meter to get data but this depends on Siemens to provide us with these details. In this table below all the prices of the components are mentioned.
LabVIEW software $1325 Free
2018 Lenovo Flex 5 15 $715
CompactRIO Model NI-9225 $1864
IOS standards $160
Total $2739
Table showing the prices in dollars of the needed components.
Project Timeline
Project Timeline
Month August September October November December
Week 1 2 3 4 1 2 3 4 1 2 3 4 1 2 3 4 1 2 3 4 Tasks
Project proposal and Team Working Agreement
Submission of Proposal and Team Working Agreement
Project Proposal Presentation Preparation
Project Website Preparation
Customer Needs Study
Benchmarking Functional Modeling Concept Generation Progress Presentation Final presentation Final report
Conclusion
The primary source of energy in Qatar is the natural gas that is burned to provide
electricity and power to the whole country. The CO2 concentration, climate change, and energy usage are all inseparable. The more energy we use, the more we produce CO2, which will increase the temperature of the earth, causing climate change. Reducing carbon footprint requires efforts at the personal, community, institutional, and
government levels. Many laws and regulations have been put in place to reduce energy use, which in turn contributes to reducing gas emissions. However, these laws need measurable goals to know their effectiveness. That is why a carbon footprint monitoring system will help many organizations reduce energy consumption and carbon dioxide. In our project, we will use energy consumption data provided by The Office of Building Operations in TAMUQ building in order to design the calculator and develop real-time monitoring system. Then, identify which component that uses the most energy and from that proposed solution to minimize energy consumption without disturbing the operation of the building.
References
[1] Al-Asmakh, M., & Al-Awainati, N. (2018, March 12). Counting the Carbon: Assessing Qatar's Carbon Dioxide Emissions. Retrieved from
https://www.qscience.com/content/papers/10.5339/qfarc.2018.EEPD592#abstract_content [2] Ni.com. (2019). What is LabVIEW? - National Instruments. [online] Retrieved from: https://www.ni.com/en-lb/shop/labview.html [Accessed 29 Sep. 2019].
[3] Riffat SB, M. (2015). Building Energy Consumption and Carbon dioxide Emissions: Threat to Climate Change. Journal of Earth Science & Climatic Change, [online] s3. Retrieved from:
https://www.omicsonline.org/open-access/building-energy-consumption-and-carbon-dioxide-emissions-threat-to-climate-change-2157-7617-S3-001.php?aid=53007.
[4] Designingbuildings.co.uk. (2019). Carbon footprint - Designing Buildings Wiki. [online] Retrieved from:
https://www.designingbuildings.co.uk/wiki/Carbon_footprint [Accessed 20 Sep. 2019].
[5] Encyclopedia Britannica. (2019). infrared radiation | Definition, Wavelengths, & Facts. [online] Retrieved from: https://www.britannica.com/science/infrared-radiation [Accessed 20 Sep. 2019].
[6] BuildingGreen. (2019). Counting Carbon: Understanding Carbon Footprints of Buildings. Retrieved from:
https://www.buildinggreen.com/feature/counting-carbon-understanding-carbon-footprints-buildings [Accessed 20 Sep.2019].
[7] Portal.gov.qa. (2019). Information About Education, Economy, Health, IT and Tourism in Qatar. [online] Available at:
https://portal.www.gov.qa/wps/portal/topics/Environment+and+Agriculture/Environmental+Prese
rvation [Accessed 19 Sep. 2019].
[8] Carbon footprint analysis : concepts, methods ... (n.d.). Retrieved from
https://www.worldcat.org/title/carbon-footprint-analysis-concepts-methods-implementation-and-case-studies/oclc/796383469
[9] Onat, Cihat, N., Murat, Tatari, & Omer. (n.d.). Scope-based carbon footprint analysis of U.S. residential and commercial buildings. Retrieved from
https://www.academia.edu/7711901/Scope-based_carbon_footprint_analysis_of_U.S._residential_and_commercial_buildings
[10] Hoffmann, V. H., & Busch, T. (2008, November 11). Corporate Carbon Performance Indicators. Retrieved from
[11] October 1, 2014 byL. W. L. E. P. S. H. A. R. E. S. F. T. W. (2014, October 8). Qatar holds world's second largest ecological footprint per person. Retrieved from
https://dohanews.co/global-report-warns-qatars-consumption-resources-unsustainble/
[12] What Are Scope 3 Indirect Carbon Emissions?: Carbon Trust. (n.d.). Retrieved from
https://www.carbontrust.com/resources/faqs/services/scope-3-indirect-carbon-emissions/
[13] Greenhouse Gases Equivalencies Calculator - Calculations and References. (2018, December 18). Retrieved from https://www.epa.gov/energy/greenhouse-gases-equivalencies-calculator-calculations-and-references
[14] K. Tweed, “One Degree Can Save More Than You Think,” Greentech Media, 15-May-2012. [Online]. Available: https://www.greentechmedia.com/articles/read/one-degree-can-save-more-than-you-think#gs.6angmh. [Accessed: 15-Sep-2019].