Technology Evaluation Report
BMMsoft EDMT
®
Server
with
Sybase
®IQ
Big Data Platform Evaluation
BMMsoft EDMT
®Server
Executive Summary
In 2007, the capabilities of the real-world Big Data solutions provided by BMMsoft EDMT® Server were formally tested and were awarded the Guinness World Record(1) for the largest data warehouse. The demonstration involved over a petabyte (1,035 TB) of actual business data. The platform used for this test was built with proprietary components based on optimal 2007 technology. The results were documented in an InfoSizing Technology Report(2).
Highlights of the performance measured included a data load speed of 3 million rows per second, an 85% data compression ratio, an average ready-time of less than 2 seconds and query response times mostly unaffected by query volumes. Since then, advances in hardware technologies have substantially reduced the configuration needed to repeat such a record breaking demonstration. This follow-up InfoSizing report compares and contrasts the proprietary test platform used in 2007 with an updated configuration that would provide the same or better capabilities, using 2012 commodity components.
This report details the dramatic reduction in cost of ownership, datacenter footprint and energy consumption achieved over the last 5 years.
Beyond the rapid evolution impacting all elements of the hardware configuration, the software components at the heart of the Petabyte Data Warehouse benchmark have also made substantial advances in performance, features and capabilities.
This report highlights some of the more significant new features and capabilities provided by the recent release
of BMMsoft EDMT 9.
1
Guinness World Record, World's Largest Data Warehouse, Sybase IQ
http://www.businesswire.com/news/home/20080514005351/en/Sybase-Sun-Set-Guinness-World-Record-Worlds
2 Performance Sizing Report, Petabyte Data Warehouse, February 29, 2008, InfoSizing
Introduction
Businesses are constantly looking for ways to analyze information and make decisions in a timely manner. Local governments and regulatory agencies mandate upon businesses that they maintain vast amounts of historical data about their activities and their communications, both internal and external. Social media traffic is now collected and scanned for sentiment analysis. These activities are part of the landscape of every enterprise today and involve vast amounts of data, commonly referred to as Big Data.
While ideas and techniques for handling and using Big Data have evolved since the concept emerged, over a decade ago; many solutions are still somewhat experimental or necessitate a great deal of customization during deployment. But to survive and prosper in today’s hyper-competitive global market; businesses must adopt and rapidly integrate production ready Big Data technologies.
One key characteristic of Big Data is the need to consolidate and correlate structured, semi-structured and unstructured data. Many if not all the data sources within an organization are recorded and maintained in data warehouses. This enterprise centric data is augmented by outside data sources such as social media traffic used for sentiment analysis and other analytics. Consequently, Big Data repositories are growing at a phenomenal pace. As data volumes grow, enterprises are looking for ways to store more data in less space and to analyze more data in less time, while meeting the need for optimal datacenter floor space and reduced energy consumption.
To address the challenges of Big Data environments, BMMsoft EDMT® is delivering a combination of state-of-the-art and production ready technologies. They provide the ability to create a unified data warehouse holding this universe of structured and unstructured information in a highly compressed form. They also provide the tools to correlate and analyze this data without structural boundaries. And they achieve this in less time, with less computing resources, and with less energy than alternative solutions.
These technologies were validated in 2007 during a Guinness World Record PetaByte benchmark. The test configuration used some of the best technology available then. But with the rapid advances in hardware technology, it is useful to estimate what an updated configuration might look like in 2012, and what advantages it would provide over the original configuration.
Configuration: Then (2007) and Now (2012)
To estimate the composition of an equivalent configuration using 2012 technology, we analyzed each of the original components and replaced them by new components with equal or superior capabilities.
Following is an overview of the original (2007) configuration used during the PetaByte benchmark, compared side-by-side with an updated (2012) configuration.
2007 Configuration 2012 Configuration
Sun Enterprise M9000 EDMT Server HP DL980 G7 64 cores: 32 x Dual-Core
SPARC64 VI (2.28 GHz – 5 MB L3) Processors
32 cores: 4 x Eight-Core
Xeon E7-2830 (2.13 GHz – 24 MB L3)
256 GB Main Memory 512 GB
6 x Host Bus Adapters (1Gbps FC) I/O Adapters 2 x Host Bus Adapters (8Gbps FC)
528 x SATA 500GB @ 7200rpm Disk Drives 96 x SATA 3TB @ 7200rpm
RAID-5 RAID level RAID-6 (superior data protection)
Rack Footprint (to scale)
90 KW (480 Tons CO2/year) Energy 10 KW (55 Tons CO2/year)
~ 4 tons (8,000 pounds) Weight ~ 0.5 tons (1,000 pounds)
Sybase® IQ 12.7 BMMsoft Server Server Software SAP Sybase® IQ 15.4 BMMsoft EDMT® 9
While hardware components were selected to provide comparable performance, the use of updated software releases increases the value of the updated configuration by delivering superior performance and by adding new features and capabilities.
Configuration: Detailed Analysis
Following is a detailed look at each element of the original test configuration and the rationale behind the choices made for the new alternative.
Processors Half the cores: The original test platform used a Dual-Core SPARC64 VI chip with a clock speed of 2.28 GHz in a 32-way SMP configuration. Equivalent processing power and multiprocessing capabilities can be obtained today with an Eight-Core Xeon E7-2830 chip running at 2.13 GHz in a 4-way configuration. The processing power equivalence is based on published benchmark results for both configurations. While the total number of cores has been reduced, the multi-processing capabilities of Intel’s Nehalem microarchitecture and the much larger L3 cache more than compensate for the lower core count.
Main Memory Twice the memory: The original test platform was configured with 256 GB of main memory. With the cost of memory decreasing rapidly, the memory size of the alternate configuration has been doubled without significantly affecting the total cost of the complete configuration.
I/O Adapters 66% less HBA: The original test platform used six host based adapters (HBA) to handle the I/O traffic between the 32 SPARC processors and the racks of disks. Two adapters were assigned to each StorageTech 6540 rack. With faster adapters and a lower processor count the new configuration can easily handle the I/O load with only two HBA. The 1Gbps Fiber Channel links between the server and the disk arrays are also upgraded to 8Gbps links.
Disk Drives 82% less disk drives: The original test platform used 500GB disk drives. The number of configured spindles (528) was driven by the target storage volume. As a consequence, the combined I/O throughput capacity of the storage arrays was greatly underutilized. In the new configuration, 3TB disk drives are being configured, reducing the number of spindles down to 96 while still underutilizing the I/O throughput capacity of the arrays.
RAID Level Superior data protection: The original test platform used
RAID-5 redundancy protecting against the failure of a single disk drive. With RAID-6, the new configuration can sustain two simultaneous disk failures, increasing the data protection by several orders of magnitude.
Rack Footprint
10 times smaller footprint: In the original test platform each StorageTech 6540 Storage Array was hosted in its own rack. These three racks stood next to the rack hosting the Sun Enterprise M9000. The full configuration required four oversized racks. In contrast, the entire new configuration fits in less than 60% of a standard 19” rack, leaving the remaining rack space available. The increase in spindle capacity and the substantial form-factor reduction of the server and disk drives are responsible for the dramatic reduction in the footprint of the configuration.
Energy 9 times less energy: The original test platform consumed a
total of 90 Kw, resulting in a yearly CO2 footprint of 480 Tons. With its high efficiency components, the new configuration consumes 10Kw, resulting in 54 Tons of CO2 per year. (All numbers include full configuration and A/C overhead.)
Weight 8 times lighter: The weight of the configuration is strongly affected by the reduction in form factor of all the components. With its 3 full size racks, the original configuration weighed close to 4 tons (8,000 pounds.) In stark contrast, the updated configuration weighs around half a ton (1,000 pounds.)
Server Software
Faster performance: The software versions used in 2007 were Sybase® IQ 12.7 and BMMsoft Server. The versions available in 2012 are SAP Sybase® IQ 15.4 and BMMsoft EDMT® Server. While the analysis in this report did not factor any software improvements, we can clearly expect the performance of the 2007 releases to be surpassed by the 2012 updates.
Performance Review
In this section we review the performance highlight achieved during the Guinness World Record performance benchmark.
Growing to One Petabyte
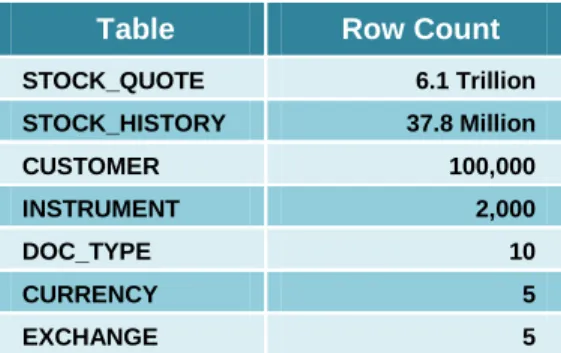
The transactional portion of the data warehouse was built using a star schema comprised of a very large fact tables and six dimensional tables, as follows:
Table Row Count
STOCK_QUOTE 6.1 Trillion STOCK_HISTORY 37.8 Million CUSTOMER 100,000 INSTRUMENT 2,000 DOC_TYPE 10 CURRENCY 5 EXCHANGE 5
A set of real-life transactional data set was used as a template to synthetically create the data population. As a result, the distributions, cardinalities and correlations of the populated data warehouse are believed to be representative of a real-life, production environment. In addition, an initial 128 GB of email, documents and multimedia attachments was populated in the data warehouse. The following table details the population of the Petabyte data warehouse.
Data Population Size
Number of STOCK_QUOTE records 6.1 Trillion Input file (includes delimiters) 1.13 Pbyte Raw input data (w/o delimiters) 1.01 Pbyte Number of unstructured documents 0.2 Million
Document (average) 670 Kbyte
Total unstructured data 128 Gbyte
Total data warehouse size 1.13 Petabyte
This initial population was done at an average rate of 1.8 Terabytes of raw data per hour, representing a daily population rate of over 250 Billion rows.
Query Response Time
Multi-table queries were executed against the Petabyte data warehouse. These queries intended on verifying that the entire data set was accessible and that query Response Times were kept within acceptable ranges.
In total, six different queries were executed from an increasing number of concurrent streams - from 1 to 50. The queries were:
The “Secret” and “Popular” queries: complex queries against a mix of structured data (transactional) and unstructured data (email, documents, etc.)
The “Active” and “Sector” queries: simple queries against structured data.
The “Short” and “Growth” queries: complex queries against structured data.
Multiple instances of each query were executed using different parameters to target different portions and ranges of the populated data.
The number of concurrent streams had a limited impact on query Response Times.
240 300 360 420 S e c o n d s 0 30 60 90 120 150 01 03 10 30 50 Streams Secret Popular Sector Active Short Growth
The above graph illustrates the evolution of query Response Times as the number of concurrent query streams is increased.
In an environment where new data is constantly generated in real time, the speed at which that new data can be added to the data warehouse and be seen by running queries is a crucial metric. The delay between the loading of a new piece of data and the ability of a running query to detect the new data is called the “Ready Time”.
To measure Ready Time, new email messages were generated and loaded in the data warehouse. Simultaneously, “pin-point” queries were executed from an increasing number of concurrent streams - from 3 to 50. Each query was targeting a new email based on a specific string, or tag, in its body. The Ready Time for new email messages was measured.
The average Ready Time for new data was under 2 seconds. 0 1 2 3 4 3 5 10 20 30 50 Streams Se c o n d s Max Avg Min
The above graph illustrates the evolution of Ready Time as the number of concurrent query streams is increased
While the measurement of Ready Times was the main focus of this performance test, it should be mentioned that the Response Times for the simple “pin-point” queries against the Petabyte data warehouse was always sub-seconds.
This test quantifies how the Petabyte data warehouse operated with minimal delays between the loading of new data and their presence in the answer set of a query targeting them.
Populating Unstructured Data
The rate at which unstructured data can be loaded into the data warehouse was also measured. For this test, 50% of the structured (Transactional) data was dropped from the data warehouse and the available capacity was used to significantly grow the population of unstructured data.
The new unstructured data was comprised of three types of objects: emails, small documents (i.e., plain text) and large documents (i.e., video clips, graphic images and formatted text). Some documents were independent files of various formats and content. Other documents were email messages, 80% of which had attachments.
The details of the populated unstructured data are shown below:
Unstructured Data eMail Small Large Total
Average Object Size (Kbyte) 0.343 2.47 203,205
New Objects Loaded (Million) 59 125 0.37 184.37
Raw Size Loaded (Gbyte) 19.3 295 72,406 72,720.3
Load Speed
Mbyte/second 0.189 4 317
Object/hour 2 Million 6 Million 5,000 8 Million
During the parsing of the email messages by BMMsoft Server, each attachment was separated from the body of its parent email to form two individual documents. These two documents were stored along with sufficient metadata to capture the relationship between the email’s body and its attachment.
Loading & indexing 8 Million unstructured objects per hour consumed only 7% of the
available CPU power.
An average of 6 out of the 64 processor cores were active during the loading of the additional unstructured data.
BMMsoft Server to use external WORM storage subsystems to comply with the regulatory data retention requirements (e.g., SOX NASD, SEC 17a-4, HIPAA, GLBH and others.) To that end, Sun’s StorageTek QFS Software with WORM-FS feature was configured as part of the Petabyte test platform.
Subject: Notifier test [email_ID = 47938] Subject: Notifier test [email_ID = 47938]
The above screen-shot illustrates how BMMsoft Server can be configured to automatically store new data (such as emails, documents or other unstructured objects) in external WORM devices, in BMMsoft Server’s underlying storage server (such as Sybase IQ), or simultaneously in both.
New Features in EDMT 9
Tagging and FusionSearch
EDMT9 provides for improved tagging and Fusion Search, such as:
Fast tagging of emails, documents and transactions with eDiscovery tags on a per-project basis used for audit, investigation, fraud detection and compliance.
Fast and flexible search of eDiscovery tags.
Fast, single-click review and tagging of emails, documents and transactions used for instant review and tagging of suspicious data by compliance, fraud or other enforcement officers. Compliance tags have options for individual and group tagging to further accelerate the process. Additional logic select random sample of emails, documents and transactions as mandated by regulations (e.g. SEC, FTC ,FINRA etc.)
Mouseover will display all metadata, eDiscovery, compliance and project-based tags and sentiment data about emails, documents and transactions. Use of mouseover provides for efficient access to tags, faster reviews and increased user productivity.
related meta-data. During the loading phase, or at a later time, EDMT 9 can be set to extract, store and index sentiment information from all emails and documents.
On the FusionView page users can search the entire data corpus of emails, document and transactions using various criteria – including sentiments. A single-key access to the Sentiment Search page provides for easy drill-downs by searching by sentiments, entities, themes, topics, scores and other text analytics criteria. These can be combined with all other SQL and text search parameters. The built-in graphic visualization dashboard increases user productivity.
Sentiment analysis searches include:
Document Sentiment: The overall tone of the document.
Entities: People, places, dates, companies and other entity types; with the number of times that entity appeared in the text as well as the sentiment for that entity in this text.
Summary: The most important sentences in the document.
Entities and Sentiment Phrases: A marked up version of the text showing positive and negative phrases as well as the entities that appear in the text.
Themes: The most important concepts in the document, ordered by the importance of that theme to the text.
Concept Topics: Topics are classifiers based on Wikipedia content. Words within documents are automatically associated with a Concept Topic, based on their definition.
Dashboard Analytics
From the FusionView page, users have single-key access to analytics that address “what should I know” problems, even when no such problem has been specifically defined.
Users are provided with “advanced analytics”.capabilities. With this type of analysis, users can start with a high-level overview and then get full data insight by drilling-down in an ad-hoc manner on relevant topics.