NATIONAL HOSPICE AND PALLIATIVE CARE ORGANIZATION
NHPCO’s Facts and Figures
Hospice Care in America
2015 Edition
Introduction . . . . 3
About this report . . . .3
What is hospice care? . . . .3
How is hospice care delivered? . . . .3
Who Receives Hospice Care? . . . . 4
How many patients receive care each year? . . . .4
What proportion of U .S . deaths is served by hospice? . . . .4
Hospice Use by Medicare Decedents . . . .4
How long do most patients receive care? . . . .5
Short and Long Lengths of Service . . . .5
Where do most patients receive care? . . . .6
Inpatient Facilities and Residences . . . .6
Hospice in the Nursing Home . . . .6
What are characteristics of the hospice patient population? . . . .6
Patient Ethnicity and Race . . . .7
Primary Diagnosis . . . .7
Who Provides Care? . . . . 8
How many hospices were in operation in 2014? . . . .8
Agency Type . . . .8
Agency Size . . . .8
Organizational Tax Status . . . .9
Who Pays for Care? . . . . 10
Hospice Participation in Medicare . . . .10
How Much Care is Received? . . . . 11
What services are provided to patients and families? . . . .11
What level of care do most hospice patients receive? . . . .11
Staffing management and service delivery . . . .11
Volunteer commitment . . . .12
Bereavement support . . . .12
Additional Statistics for NHPCO Members . . . . 13
National Summary of Hospice Care . . . .13
NHPCO Performance Measure Reports . . . .13
Appendix 1: Data Sources . . . . 14
Appendix 2: How Accurate are the NHPCO Estimates? . . . . 15
About this Report
NHPCO Facts and Figures: Hospice Care in America provides an annual overview of important trends in the growth, delivery and quality of hospice care across the country . This overview provides specific information on: • Hospice patient characteristics (e .g ., gender, age,
ethnicity, race, primary diagnosis, and length of service)
• Hospice provider characteristics (e .g ., total patients served, organizational type, size, and tax status) • Location and level of care
• Role of paid and volunteer staff
Please refer to “Data Sources” (page 16) and to the footnotes for the source information and methodologies used to derive this information . Additional resources for NHPCO members are also provided on page 14 .
What is hospice care?
Considered the model for quality compassionate care for people facing a life-limiting illness, hospice provides expert medical care, pain management, and emotional and spiritual support expressly tailored to the patient’s needs and wishes . Support is provided to the patient’s loved ones as well .
Hospice focuses on caring, not curing . In most cases, care is provided in the patient’s home but may also be provided in freestanding hospice centers, hospitals, nursing homes, and other long-term care facilities . Hospice services are available to patients with any terminal illness or of any age, religion, or race .
How is hospice care delivered?
Typically, a family member serves as the primary caregiver and, when appropriate, helps make decisions for the terminally ill individual . Members of the hospice staff make regular visits to assess the patient and provide additional care or other services . Hospice staff is on-call 24 hours a day, seven days a week .
The hospice team develops a care plan that meets each patient’s individual needs for pain management and symptom control . This interdisciplinary team, as illustrated in Figure 1 below, usually consists of the patient’s personal physician, hospice physician or medical director, nurses, hospice aides, social workers, bereavement counselors, clergy or other spiritual counselors, trained volunteers, and speech, physical, and occupational therapists, if needed .
Introduction
How many patients receive care each year?
In 2014, an estimated 1 .6 to 1 .7* million patients received services from hospice (Figure 2) . This estimate includes: • patients who died while receiving hospice care • patients who received care in 2013 and who
continued to receive care into 2014 (known as “carryovers”)
• patients who left hospice care alive in 2014 for various reasons including extended prognosis, desire for curative treatment, and other reasons (known as “live discharges”)
As shown in Figure 2, the number of patients and families served by hospice has steadily increased over the past several years .
NHPCO continually examines, and when appropriate, revises the methodology employed in its data analysis . In 2013 NHPCO revised the statistical model used to generate the estimate of patients served . The revised model is derived from a combination of NHPCO and
CMS data and produces a range of possible values for the patients served estimate rather than a single number . Each year additional data points are added to the model and, as a result, prior year estimates are more refined and may differ slightly from previous estimates .
What proportion of U .S . deaths is served
by hospice?
The percent of U .S . deaths served by hospice is calculated by dividing the number of deaths in hospice (as estimated by NHPCO) by the total number of deaths in the U .S . as reported by the Centers for Disease Control and Prevention . NHPCO estimates that approximately 1,200,000 deaths occurred in the U .S . while under the care of hospice . However, as of the publication date of this document, CDC data on the number of U .S . deaths in 2014 is not available . Therefore, NHPCO is not able to report on the estimated percentage of all deaths while under the care of hospice .
Hospice Use by Medicare Decedents
Over the past decade, the hospice community has been marked by substantial growth in the number of hospice programs and patients served . In an independent analysis of Medicare claims data, Dr . Joan Teno found similar growth in the proportionate use of the Medicare hospice benefit . Of all Medicare decedents in the year 2001, 18 .8% accessed hospice for three or more days . By 2007 the proportion of Medicare decedents accessing three or more days of hospice services had increased to 30 .1% . Examination of the number of Medicare decedents with a cancer diagnosis found that 36 .6% accessed three or more days of hospice care in 2001 . The percentage grew to 43 .3% in 2007 for Medicare decedents who received
Who Receives Hospice Care?
* 2014 estimate derived from a combination of data from Medicare and the NHPCO National Data Set . 1,380,680 1,458,477 1,532,304 1,542,737 1,656,353 1,100,000 1,200,000 1,300,000 1,400,000 1,500,000 1,600,000 1,700,000 1,800,000 2010 2011 2012 2013 2014 To ta l P at ien ts S er ved (es tima te)
Patients Served Lower Range Upper Range
three or more days of hospice . A similar growth in hospice use was noted for decedents with advanced cognitive impairment and severe functional limitations (dementia) . In 2001, only 14 .4% of Medicare decedents with a dementia diagnosis received three or more days of hospice care . By the year 2007, that proportion had grown to 33 .6% . This trend in hospice use for Medicare decedents from 2001 to 2007 is illustrated in Figure 3 .
How long do most patients receive care?
The total number of days that a hospice patient receives care is referred to as the length of service (or length of stay)** . Length of service can be influenced by a number of factors including disease course, timing of referral, and access to care .
The median (50th percentile) length of service in 2014 was 17 .41 days, a decrease from 18 .51 days in 2013 .This means that about half of hospice patients received care for fewer than 17 days and half received care for more than 17 days1 . The average length of service decreased from 72 .6 days1 in 2013 to 71 .31 days in 2014 (Figure 4) .
Short and Long Lengths of Service
In 2014, a larger proportion of hospice patients (approximately 35 .5%1) died or were discharged within seven days of admission when compared to 2013 (34 .5%1) . Likewise, a larger proportion of patients died or were discharged within 14 days of admission in 2014 when compared to 2013 (50 .3%1 and 48 .8%1 respectively) . A smaller proportion of patients remained under hospice for longer than 180 days (10 .3%1 in 2014 compared to 11 .5%1 in 2013) .
** Length of service can be reported as both an average and a median . The median, however, is considered a more meaningful measure for understanding the experience of the typical patient since it is not influenced by outliers (extreme values) .
< 7 days 35.5% 8 - 14 days 14.8% 15 to 29 days 12.9% 30 - 89 days 17.8% 90 - 179 days 8.7% 180+ days 10.3% 71.8 18.7 72.6 18.5 71.3 17.4 0.0 10.0 20.0 30.0 40.0 50.0 60.0 70.0 80.0
Average Length of Service Median Length of Service
D ay s o f C ar e 2012 2013 2014
Figure 4. Length of Service by Year 1
Figure 5. Proportion of Patients by Length of Service in 2014 1 Figure 3. Proportion of Medicare Decedents Accessing Three
or More Days of Hospice Care 0.0% 10.0% 20.0% 30.0% 40.0% 50.0% 2001 2002 2003 2004 2005 2006 2007
Where do most hospice patients receive care?
The majority of patient care is provided in the place the patient calls “home” (Table 1) . In addition to private residences, this includes nursing homes and residential facilities . In 2014, 58 .9%1 of patients received care at home . The percentage of hospice patients receiving care in a hospice inpatient facility increased from 26 .4%1 to 31 .8%1 .
Inpatient Facilities and Residences
In addition to providing home hospice care, about one in three hospice agencies also operate a dedicated inpatient unit or facility1 . Most of these facilities are either freestanding or located on a hospital campus and may provide a mix of general inpatient and residential care . Short-term inpatient care can be made available when pain or symptoms become too difficult to manage at home, or the caregiver needs respite .
Hospice in the Nursing Home
As the average life span in the United States has increased, so has the number of individuals who die of chronic progressive diseases that require longer and more sustained care . An increasing number of these individuals reside in nursing homes prior to their death . This rise has been mirrored by growth in the number of hospice patients who reside in nursing homes .
A 2010 study by Miller et al ., examined the growth of Medicare-certified hospices providing hospice in the
nursing home from 1999 to 2006 . Using Medicare’s minimum data set (MDS), the study found that the proportion of nursing home decedents who received hospice care rose from 14 .0% in 1999 to 33 .1% in 2006; a growth rate that closely paralleled the increase in Medicare-certified hospice programs . The demographic characteristics of hospice patients in the nursing home changed little during that time and are very similar to the overall characteristics of hospice patients . Most nursing home hospice decedents were female (67%), white (90%), and were older than 85 years (55%)5 .
What are the characteristics of the hospice
patient population?
Patient Gender
More than half of hospice patients were female (Table 2) .
Patient Age
In 2014, approximately 84%1 of hospice patients were 65 years of age or older—with 41 .1%1 being 85 or older (Table 3) . The pediatric and young adult population accounted for less than 1%1 of hospice admissions .
Table 2. Percentage of Hospice Patients by Gender 1
Patient Gender 2014 2013
Female 53 .7% 54 .7% Male 46 .3% 45 .3%
Patient Age Category 2014 2013
Less than 24 years 0 .5% 0 .4% 25 - 34 years 0 .3% 0 .4% 35 - 64 years 15 .3% 15 .3% 65 - 74 years 16 .8% 16 .6% 75 - 84 years 26 .0% 26 .1% 85+ years 41 .1% 41 .2%
Table 3. Percentage of Hospice Patients by Age 1 Table 1. Location of Hospice Patients at Death 1
Location of Death 2014 2013
Patient’s Place of Residence 58 .9% 66 .6% Private Residence 35 .7% 41 .7% Nursing Home 14 .5% 17 .9% Residential Facility 8 .7% 7 .0% Hospice Inpatient Facility 31 .8% 26 .4% Acute Care Hospital 9 .3% 7 .0%
Patient Ethnicity and Race
Following U .S . Census guidelines, NHPCO reports Hispanic ethnicity as different from race . In 2014, more than 7%1 of patients were identified as being of Hispanic or Latino origin (Table 4) .
Patients of minority (non-Caucasian) race accounted for about one quarter of hospice patients in 2014 (Table 5)1 .
Primary Diagnosis
When hospice care in the United States was established in the 1970s, cancer patients made up the largest percentage of hospice admissions . Today, cancer diagnoses account for less than half of all hospice admissions (36 .6%1) (Table 6) . Currently, less than 25% of all U .S . deaths are now caused by cancer, with the majority of deaths due to other terminal diseases .4 The top four non-cancer primary diagnoses for patients admitted to hospice in 2014 were dementia (14 .8%1), heart disease (14 .7%1), lung disease (9 .3%1), and stroke or coma (6 .4%1) .
Patient Ethnicity 2014 2013
Non-Hispanic or Latino origin 92 .9% 93 .2% Hispanic or Latino origin 7 .1% 6 .8%
Table 4. Percentage of Hospice Patients by Ethnicity 1
Patient Race 2014 2013
White/Caucasian 76 .0% 80 .9% Multiracial or Other Race 13 .1% 7 .5% Black/African American 7 .6% 8 .4% Asian, Hawaiian, Other Pacific Islander 3 .1% 2 .9% American Indian or Alaskan Native 0 .3% 0 .3%
Table 5. Percentage of Hospice Patients by Race 1
Primary Diagnosis 2014 2013 Cancer 36 .6% 36 .5% Non-Cancer Diagnoses 63 .4% 63 .5% Dementia 14 .8% 15 .2% Heart Disease 14 .7% 13 .4% Lung Disease 9 .3% 9 .9% Other 8 .3% 6 .9% Stroke or Coma 6 .4% 5 .2% Kidney Disease (ESRD) 3 .0% 3 .0% Liver Disease 2 .3% 2 .1% Non-ALS Motor Neuron 2 .1% 1 .8% Debility Unspecified 1 .9% 5 .4% Amyotrophic Lateral Sclerosis (ALS) 0 .4% 0 .4% HIV / AIDS 0 .2% 0 .2%
Table 6. Percentage of Hospice Admissions by Primary Diagnosis 1
Agency Size
Hospices range in size from small all-volunteer agencies that care for fewer than 50 patients per year to large, national corporate chains that care for thousands of patients each day .
One measure of agency size is total admissions over the course of a year . In 2014, 78 .9%1 of hospices had 500 or fewer total admissions (Table 8) .
Another indicator of agency size is daily census, which is the number of patients cared for by a hospice program on a given day . In 2014, the mean average daily census was 138 .91 patients and the median (50th percentile) average daily census was 79 .01 patients . About 46%1 of providers routinely care for more than 100 patients per day (Figure 7) .
Who Provides Care?
How many hospices were in operation
in 2014?
The number of hospice programs nationwide continues to increase — from the first program that opened in 1974 to approximately 6,100 programs today (Figure 6) . This estimate includes both primary locations and satellite offices . Hospices are located in all 50 states, the District of Columbia, Puerto Rico, Guam and the U .S . Virgin Islands .
Agency Type
The majority of hospices are independent, freestanding agencies (Table 7) . The remaining agencies are either part of a hospital system, home health agency, or nursing home .
Agency Type 2014 2013
Free Standing/Independent Hospice 59 .1% 58 .3% Part of a Hospital System 19 .6% 19 .8% Part of a Home Health Agency 16 .3% 16 .7% Part of a Nursing Home 5 .0% 5 .1%
Table 7. Agency Type 1
Total Patient Admissions 2014 2013
1 to 49 16 .6% 16 .1% 50 to 150 28 .3% 29 .5% 151 to 500 34 .0% 33 .1% 501 to 1,500 16 .5% 16 .4% > 1,500 4 .7% 4 .9%
Table 8. Total Patient Admissions 1
Figure 6. Total Hospice Agencies by Year 1 5,150 5,300 5,560 5,800 6,100 4,500 4,700 4,900 5,100 5,300 5,500 5,700 5,900 6,100 6,300 2010 2011 2012 2013 2014 # Ho sp ic e P ro vi der s U .S. 26-100 patients per day 30.0% 1 - 25 patients per day 23.7% > 100 patients per day 46.2%
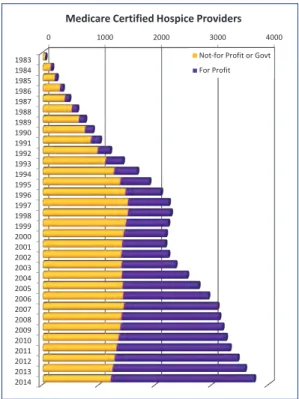
Organizational Tax Status
Hospice agencies are organized into three tax status categories:
1 . Not-for-profit [charitable organization subject to 501(c)3 tax provisions]
2 . For-profit (privately owned or publicly held entities) 3 . Government (owned and operated by federal, state,
or local municipality) .
Based on analysis of CMS’s Provider of Service (POS) file, 28%2 of active Medicare Provider Numbers are assigned to providers that held not-for-profit tax status and 68%2 held for-profit status in 2014 . Government-owned programs comprise the smallest percentage of hospice providers (about 4%2 in 2014) .
The number of for-profit Medicare-certified hospice providers has been steadily increasing over the past several years (Figure 8) . In contrast, the number of Medicare-certified not-for-profit or government providers has declined over the same period .
0 1000 2000 3000 4000 1983 1984 1985 1986 1987 1988 1989 1990 1991 1992 1993 1994 1995 1996 1997 1998 1999 2000 2001 2002 2003 2004 2005 2006 2007 2008 2009 2010 2011 2012 2013 2014
Medicare Certified Hospice Providers
Not-for Profit or Govt For Profit
Financial concerns can be a major burden for many patients and families facing a terminal illness . Hospice care is covered under Medicare, Medicaid, and most private insurance plans, and patients receive hospice care regardless of ability to pay .
Hospice Participation in Medicare
The Medicare hospice benefit, enacted by Congress in 1982, is the predominate source of payment for hospice care . The percentage of hospice patients covered by the Medicare hospice benefit versus other payment sources was 85 .5%1 in 2014 (Table 9) . The percentage of patient days covered by the Medicare hospice benefit versus other sources was 90 .3%1 (Table 10) .
Most hospice agencies (92 .8%1) have been certified by the Centers for Medicare and Medicaid Services (CMS) to provide services under the Medicare hospice benefit . In 2014, there were more than 4,1002 certified hospice agencies . Figure 9 shows the distribution of Medicare-certified hospice providers by state .
Non-certified providers fall into two categories:
1 . Provider seeking Medicare certification (e .g ., a new hospice);
2 . Provider not seeking certification . This group includes providers that (1) may have been formerly certified by Medicare and voluntarily dropped certification, or (2) have never been certified . The provider may have an arrangement with a home health agency to provide skilled medical services, or it may be an all-volunteer program that covers patient care and staffing expenses through donations and the use of volunteer staff .
Payer 2014 2013
Medicare Hospice Benefit 85 .5% 87 .2% Managed Care or Private Insurance 6 .9% 6 .2% Medicaid Hospice Benefit 5 .0% 3 .8% Uncompensated or Charity Care 0 .7% 0 .9% Self Pay 0 .8% 0 .8% Other Payment Source 1 .2% 1 .2%
Table 9. Percentage of Patients Served by Payer 1
Payer 2014 2013
Medicare Hospice Benefit 90 .3% 91 .2% Managed Care or Private Insurance 4 .0% 4 .0% Medicaid Hospice Benefit 4 .3% 3 .1% Uncompensated or Charity Care 0 .4% 0 .6% Self Pay 0 .4% 0 .5% Other Payment Source 0 .7% 0 .6%
Table 10. Percentage of Patient Care Days by Payer 1
Who Pays for Care?
Figure 9. Medicare-Certified Hospices by State 2
How Much Care is Received?
What services are provided to patients
and families?
Among its major responsibilities, the interdisciplinary hospice team:
• Manages the patient’s pain and symptoms
• Assists the patient with the emotional, psychosocial and spiritual aspects of dying
• Provides needed drugs, medical supplies, and equipment
• Instructs the family on how to care for the patient • Delivers special services like speech and physical
therapy when needed
• Makes short-term inpatient care available when pain or symptoms become too difficult to treat at home, or the caregiver needs respite
• Provides bereavement care and counseling to surviving family and friends .
What level of care do most hospice
patients receive?
There are four general levels of hospice care:
Home-based Care
1 . Routine Home Care: Patient receives hospice care at the place he/she resides .
2 . Continuous Home Care: Patient receives hospice care consisting predominantly of licensed nursing care on a continuous basis at home . Continuous home care is only furnished during brief periods of crisis and only as necessary to maintain the terminally ill patient at home .
Inpatient Care
3 . General Inpatient Care: Patient receives general inpatient care in an inpatient facility for pain control or acute or complex symptom management which cannot be managed in other settings .
4 . Inpatient Respite Care: Patient receives care in an approved facility on a short-term basis in order to provide respite for the caregiver .
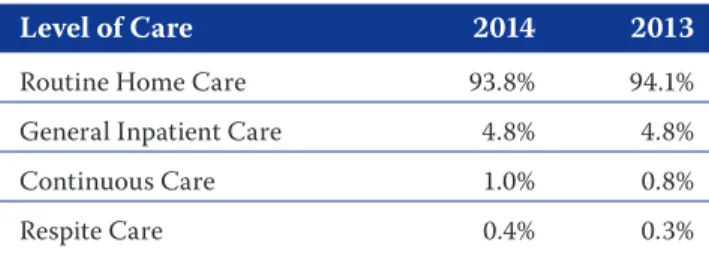
In 2014, routine home care comprised the vast majority of hospice patient care days (Table 11) .
Staffing Management and Service Delivery
Hospice team members generally provide service in one or more of the following areas:
• Clinical care, including patient care delivery, visits, charting, team meetings, travel, and the arrangement or coordination of care
• Non-clinical care, including administrative functions
• Bereavement services .
Hospice staff time centers on direct care for the patient and family: 70 .3%1 of home hospice full-time equivalent employees (FTEs) were designated for direct patient care or bereavement support in 2014 .
Level of Care 2014 2013
Routine Home Care 93 .8% 94 .1% General Inpatient Care 4 .8% 4 .8% Continuous Care 1 .0% 0 .8% Respite Care 0 .4% 0 .3%
The number of patients that a clinical staff member is typically responsible for varies by discipline . In 2014, the average patient caseload for a hospice aide was 10 .81 patients, 11 .21 patients for a nurse case manager, and 24 .31 patients for a social worker .
Volunteer Commitment
The U .S . hospice movement was founded by volunteers and there is continued commitment to volunteer service . In fact, hospice is unique in that it is the only provider whose Medicare Conditions of Participation requires volunteers to provide at least 5% of total patient care hours .
NHPCO estimates that in 2014, 430,0001 hospice volunteers provided 19 million1 hours of service .
Hospice volunteers provide service in three general areas: • Spending time with patients and families (“direct
support”)
• Providing clerical and other services that support patient care and clinical services (“clinical support”) • Engaging in a variety of activities such as
fundraising, outreach and education, and serving on a board of directors (general support) .
In 2014, most volunteers were assisting with direct support (60 .8%1), 20 .2%1 provided clinical care support, and 19 .1%1 provided general support .
In 2014, 5 .2%1 of all clinical staff hours were provided by volunteers . The typical hospice volunteer devoted 46 .31 hours of service over the course of the year and patient care volunteers made an average of 201 visits to hospice patients .
Bereavement Support
There is continued commitment to bereavement services for both family members of hospice patients and for the community at large . For a minimum of one year following their loved one’s death, grieving families of hospice patients can access bereavement education and support . In 2014, for each patient death, an average of 21 family members received bereavement support from their hospice . This support included follow-up phone calls, visits and mailings throughout the post-death year . Most agencies (91 .6%1) also offer some level of bereavement services to the community; community members account for about 12 .3%1 of those served by hospice bereavement programs .
National Summary of Hospice Care
Active hospice and palliative care provider members of the National Hospice and Palliative Care Organization may access additional statistics in NHPCO’s National
Summary of Hospice Care . This annual report includes
comprehensive statistics on provider demographics, patient demographics, service delivery, inpatient services, and cost of care . It is provided exclusively to NHPCO members at no cost, and it can be downloaded from the National Data Set survey webpage at www .nhpco .org/nds .i A partial list of summary tables includes:
• Inpatient facility statistics – Level of care – Length of service – Staffing • Length of service by – Agency size – Agency type – Primary diagnosis • Palliative care services
– Percent providing palliative consult services – Percent providing palliative care services at home or in an inpatient facility
– Percent of physician hours devoted to palliative clinical care
• Patient visits
– Visits per home care admission – Visits per day
– Visits per week
• Payer mix by
– Agency tax status – Agency type • Revenue and expenses
NHPCO Performance Measure Reports
NHPCO members also have access to national-level summary statistics for the following NHPCO performance measurement tools:
1 . Patient Outcomes and Measures (POM) (www .nhpco .org/outcomemeasures)
• Pain relief within 48 hours of admission (NQF 0209) • Avoiding unwanted hospitalization
• Avoiding unwanted CPR
2 . Family Evaluation of Bereavement Services (FEBS) (www .nhpco .org/febs) ii
3 . Survey of Team Attitudes and Relationships (STAR) iii (www .nhpco .org/star)
• Job satisfaction (hospice-specific) • Salary ranges
• Provider-level results
Additional Statistics for NHPCO Members
i A valid NHPCO member ID and password are required to access the NHPCO National Summary of Hospice Care report . This report is only
available to current hospice and palliative care members of NHPCO .
ii Participating agencies receive provider-level reports comparing their hospice’s results to national estimates .
1 . 2014, NHPCO National Data Set and/or NHPCO Member Database .
2 . 1st Quarter 2015, Centers for Medicare and Medicaid Services (CMS) Provider of Service File (POS) .
3 . Hoyert DL, Xu J, . Deaths: Preliminary Data for 2011, National Vital Statistics Reports, vol 61 no 6 . National Center for Health Statistics, CDC, available online at: http://www .cdc .gov/nchs/data/nvsr/nvsr61/nvsr61_06 .pdf .
4 . Murphy SL, Xu J, Kochanek KD . Final Data for 2010, National Vital Statistics Reports, vol 61 no 4 . National Center for Health Statistics, 2013 .
5 . Miller SC, Lima J, Gozalo PL, Mor V . The Growth of Hospice Care in U.S. Nursing Homes . JAGS . 2010 58:1481-88 .
Estimation, especially when performed on a national level, is a challenging undertaking . NHPCO is continu-ously working to improve and validate the estimates that are provided to members and the greater hospice com-munity . However, many of the national estimates rely on a less-than-optimal convenience sample of hospices voluntarily submitting data to the NHPCO National Data Set (NDS) .
In the fall of 2010, NHPCO performed a comparative analysis with data obtained through a probabilistic sampling methodology – considered the gold standard sampling method – performed by the National Center for Health Statistics (NCHS) . Earlier that year, the NCHS released data from its 2007 National Home and Hospice Care Survey (NHHCS) . NHPCO first performed a complete analysis of hospice data from the 2007 NHHCS and then compared the results to estimates from the 2007 National Summary of Hospice Care .
The findings of the comparison provide strong
corroborating evidence in support of NHPCO’s national estimates . Analysis of similar data between the two data sets describes program and patient characteristics of very similar distributions . For statistical comparison, 95% confidence intervals (95% CI) were included in the estimates generated from the NHHCS data . When comparing results, most point estimates generated from the NDS data fell within the 95% CI of the NHHCS results . All such results are considered to be not
appreciably different . Even those point estimates landing outside the 95% CI were often very close and also likely not to be statistically significantly different . However, statistical significance testing is needed to confirm that results are, in fact, not statistically significantly different .
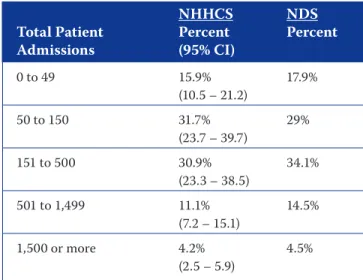
An example of the representativeness of the NDS is the distribution of hospices by size, as measured by total unique patient admissions during a year . Table 1 shows the side-by-side comparison of estimates of the distribution of hospice sizes by total admissions generated from NHHCS and NDS data . In all cases, the NDS-based point estimates of the proportion of hospices in each size category were within the 95% CI of the estimate generated from the probabilistic-based NHHCS data . Comparison of results for the distribution of agencies by ownership type [freestanding NHHCS 56 .3 (48 .4 – 64 .2) vs NDS 58 .3 | non freestanding NHHCS 41 .1 (33 .6 – 48 .7) vs . NDS 41 .8] shows that differences between the two estimates are not appreciably different . Comparable variables were not available for other agency-level characteristics .
Results for estimates of patient characteristics were also comparable between NDS and NHHCS data . Tables 2 through 4 show estimates of the distribution of patient characteristics . In all cases, the point estimates
Appendix 2: How Accurate are the NHPCO Estimates?
NHHCS NDS
Total Patient Percent Percent
Admissions (95% CI) 0 to 49 15 .9% 17 .9% (10 .5 – 21 .2) 50 to 150 31 .7% 29% (23 .7 – 39 .7) 151 to 500 30 .9% 34 .1% (23 .3 – 38 .5) 501 to 1,499 11 .1% 14 .5% (7 .2 – 15 .1) 1,500 or more 4 .2% 4 .5% (2 .5 – 5 .9)
Table 1. Distribution of Hospice Size by Total Patient Admissions (2006)
generated from NDS data fall within the 95% CI of estimates generated from NHHCS data . These again are a strong corroborative indication that the characteristics of patients represented in the NDS are representative of patients on a national level .
Not all comparisons were as closely matched as the examples above . In some cases, point estimates generated from NDS were outside the 95% CI of estimates from NHHCS data on one or more
characteristics . Table 4 illustrates one such example . The NDS-based estimates for the proportion of patients whose primary payment source was either Medicare, Medicaid, Self-pay, or Other were all outside of the 95% CI of the estimates based on NHHCS data . In this example, it cannot be assumed that the proportion estimates are the same (not statistically significantly different); however, the NDS-based estimates were so close to the 95% CI that it is likely they are still not statistically significantly different . The result of the comparison of estimates of primary payment source is therefore inconclusive .
The tables provided are a sample of the total analysis performed by NHPCO . Overall, the estimates generated from NDS data are very similar to those generated from NHHCS data . These results provide evidence that, although derived from a convenience sample of data, the estimates NHPCO generates in its National Summary of Hospice Care and distributed in this Facts and Figures report are reliable and accurate .
NHHCS NDS
Percent Percent (95% CI)
15 .6% 15 .9% (13 .8 - 17 .4)
Table 2. Percent of Non-Death Discharges
NHHCS NDS
Payment Source Percent Percent
(95% CI) Medicare 79 .3% 83 .6% (77 .2 – 81 .4) Medicaid 3 .82% 5 .0% (2 .9 – 4 .8) Managed Care/ 9 .2% 8 .5% Private Insurance (7 .7 – 10 .7) Self Pay 0 .79% 0 .9% (0 .32 – 1 .26) Uncompensated/ 0 .61% 1 .3% Charity (0 .23 – 0 .98) Other 2 .1% 0 .7% (1 .4 – 2 .7)
Table 4. Percent of Patients by Primary Payment Source
NHHCS NDS
Gender Percent Percent
(95% CI) Male 44 .9% 46 .1% (42 .4 - 47 .4) Female 55 .1% 53 .9% (52 .6 - 57 .6) Age (yrs) 0 - 24 0 .27% 0 .5% (0 .03 - 0 .52) 25 - 34 0 .29% 0 .4% (0 .02 - 0 .57) 35 - 64 16 .4% 16 .5% (14 .5 - 18 .2) 65 - 74 15 .4% 16 .2% (13 .6 - 17 .2) 75 - 84 29 .5% 30% (27 .2 - 31 .7) ≥ 85 38 .2% 36 .6% (35 .7 - 40 .7)
©2015 National Hospice and Palliative Care Organization .
All rights reserved, including the right to reproduce this publication or portions thereof in any form .
Suggested citation:
NHPCO Facts and Figures: Hospice Care in America . Alexandria, VA: National Hospice and Palliative Care Organization, September 2015 .
Questions may be directed to:
National Hospice and Palliative Care Organization Attention: Research
Phone: 703 .837 .1500 Web: www .nhpco .org/research