ptg
This chapter covers several topics related to analyzing an existing server environment to uncover inefficiencies and make recommendations on virtu-alizing the environment. VMware Capacity Planner is the primary tool used in this analysis along with custom analysis done by my firm, which is a VMware partner certified to run Capacity Planner, as part of the process.
Capacity Planner performs a thorough analysis of the environment and, when good virtualization candidates are discovered, produces a recom-mended consolidation template. Some servers are not considered good can-didates for a variety of reasons, such as the following:
• The system has four or more active network interface cards (NICs). • The system uses specialized peripherals not supported in virtual
machines.
• The system is already running as a virtual machine.
This chapter covers some of the Capacity Planner output and how those recommendations were used to come up with a virtualized design for an example client.
C H A P T E R 2
Existing Server Environment
Analysis with Capacity Planner
ptg
Snapshot of Servers
Capacity Planner performs an inventory of servers. For some of my custom-ers, this is most revealing in the sense that they think they have some number of servers only to find out that they have many more servers than they thought. Table 2-1 summarizes the systems that were analyzed as part of the Capacity Planner process in an example customer environment.
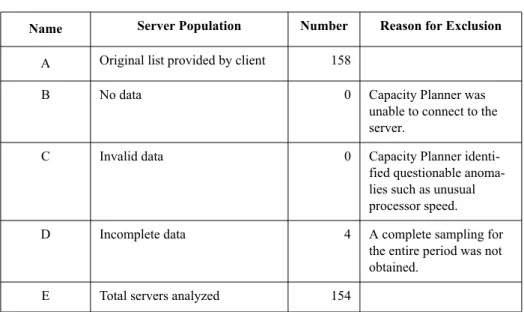
Table 2-1 Summary of Existing Servers Analyzed From 158 to 154
Table 2-1 shows that of 158 original servers, 154 were analyzed by Capacity Planner.I found that the most common reason a server is excluded is because of an incomplete sampling of data, which means the server was shut down often or some other interruption caused a problem over the sam-pling period, which was true for four servers shown in the example.
The next step for Capacity Planner is to take the 154 servers and more thoroughly analyze them. Table 2-2 shows the analysis of the 154 servers.
Name Server Population Number Reason for Exclusion
A Original list provided by client 158
B No data 0 Capacity Planner was
unable to connect to the server.
C Invalid data 0 Capacity Planner
identi-fied questionable anoma-lies such as unusual processor speed. D Incomplete data 4 A complete sampling for
the entire period was not obtained.
ptg
Snapshot of Servers 21
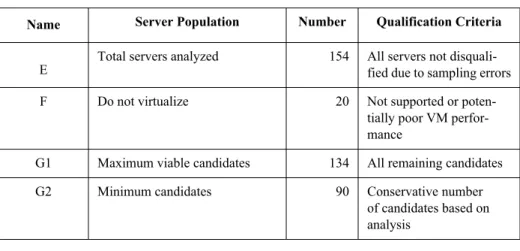
Table 2-2 Summary of Existing Servers Analyzed from 154 to 134
This analysis shows that between 134 and 90 servers could be virtual-ized. This client wants to take an aggressive virtualization approach, so 134 servers will be used in the subsequent planning for this virtualized environ-ment.
Based on the analysis of 90 to 134 servers to be virtualized, the follow-ing summary of ESX hosts required was produced in Table 2-3.
Table 2-3 Summary of Existing Servers Analyzed
Based on this information, the decision was made to virtualize all 134 servers that were considered good candidates. The processor utilization of 11%, although low, is much higher than the current utilization, as you’ll see. When virtualization is implemented, utilization in the 60% range is com-mon, making the hardware resources more efficiently utilized.
Name Server Population Number Qualification Criteria
E
Total servers analyzed 154 All servers not disquali-fied due to sampling errors F Do not virtualize 20 Not supported or
poten-tially poor VM perfor-mance
G1 Maximum viable candidates 134 All remaining candidates G2 Minimum candidates 90 Conservative number
of candidates based on analysis Range Number of Virtualization Candidates Number of ESX Hosts Required Average Proces-sor Utilization for
ESX Host Average Memory Utilization for ESX Host Minimum to maximum servers that can be consolidated
ptg
Recommended Target Platform
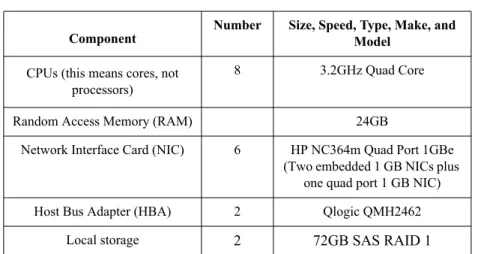
Capacity Planner produced a recommended platform for the consolidation with the parameters shown in Table 2-4.
Table 2-4 Recommended Consolidation Target Platform
Several HP servers meet these requirements. To achieve maximum rack density and accommodate future growth, HP BladeSystem was selected as the target platform. Chapter 3 covers the target environment.
A lot of additional information was produced as part of the analysis, some of which is covered in the remaining sections. The next section covers the details of the servers that were analyzed as part of the Capacity Planner analysis.
Summary of Existing Servers
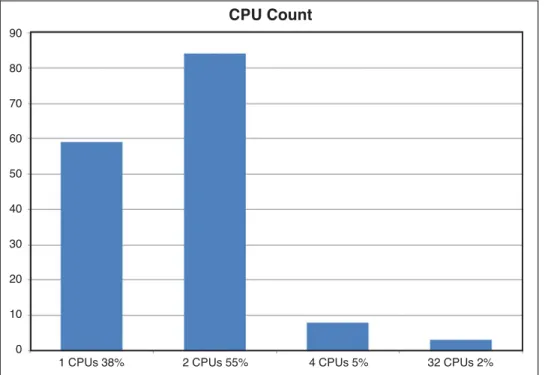
Capacity Planner provides several charts and graphs summarizing the exit-ing environment. The figures in this section provide a technical profile of the existing environment, beginning with the CPU count (processors, in this case), shown in Figure 2-1.
Component
Number Size, Speed, Type, Make, and Model
CPUs (this means cores, not processors)
8 3.2GHz Quad Core
Random Access Memory (RAM) 24GB
Network Interface Card (NIC) 6 HP NC364m Quad Port 1GBe (Two embedded 1 GB NICs plus
one quad port 1 GB NIC) Host Bus Adapter (HBA) 2 Qlogic QMH2462
ptg
Summary of Existing Servers 23
Figure 2-1 CPU (Processor) Count Showing Nearly All Servers Are 1 or 2 Core
Figure 2-1 shows that about 60 servers have one processor and more than 80 servers have two processors. The virtualization gains for these small servers is huge, because these are full servers with a large footprint, but they have only one or two cores. These are ideal consolidation candidates.
Figure 2-2 shows the frequency of the processors in the environment. CPU Count 90 80 70 60 50 40 30 20 10 0
ptg
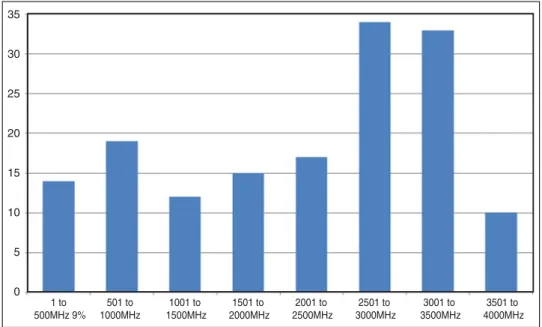
Figure 2-2 Processor Frequency Showing 50% of Servers Low
Figure 2-2 shows that low frequency processors, represented by the five leftmost bars in the chart, account for 50% of the processors in the envi-ronment. These are old, slow processors that are ideal consolidation candi-dates. So far, these low-density processors run at a low frequency for the most part. Figure 2-3 shows the utilization of these processors.
35 30 25 20 15 10 5 0 1 to 500MHz 9% 501 to 1000MHz 1001 to 1500MHz 1501 to 2000MHz 2001 to 2500MHz 2501 to 3000MHz 3001 to 3500MHz 3501 to 4000MHz
ptg
Summary of Existing Servers 25
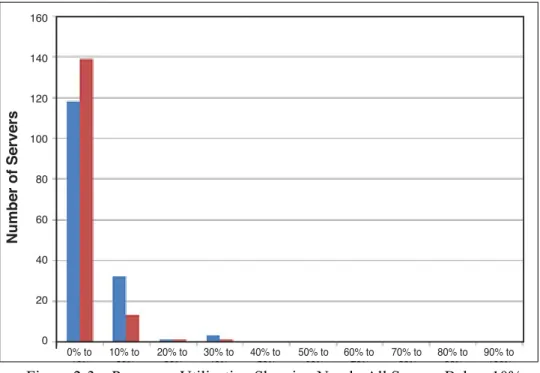
Figure 2-3 Processor Utilization Showing Nearly All Servers Below 10%
The "peak" is the leftmost bar and the "prime" hours utilization. Figure 2-3 shows almost all the servers are less than 10% utilized, which means the consolidation density will be high. Many servers can be consolidated on a single blade because of the low existing processor utilization. Next, consider the memory utilization of the servers, shown in Figure 2-4.
160 140 120 100 80 60 40 20 0 0% to 10% 10% to 20% 20% to 30% 30% to 40% 40% to 50% 50% to 60% 60% to 70% 70% to 80% 80% to 90% 90% to 100% Number of Servers
ptg
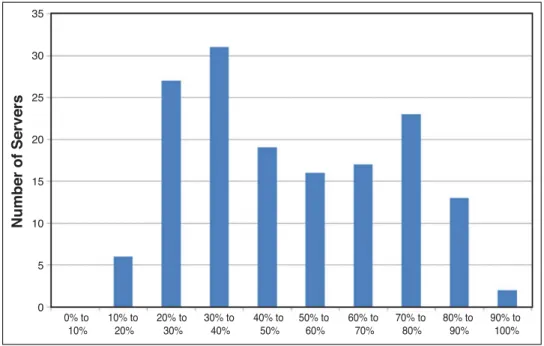
Figure 2-4 Memory Utilization Showing an Even Distribution
Figure 2-4 shows that, unlike the processor utilization and makeup, the memory utilization is higher on all servers. This means that although the servers can have a high consolidation ratio, the memory that will be devoted to each virtual machine can’t be reduced nearly as aggressively. Servers and blades support high memory capacity, and I never cut back on memory to ensure every virtual machine has the memory it needs. The memory size per server is shown in Figure 2-5.
35 30 25 20 15 10 5 0 0% to 10% 10% to 20% 20% to 30% 30% to 40% 40% to 50% 50% to 60% 60% to 70% 70% to 80% 80% to 90% 90% to 100% Number of Servers
ptg
Summary of Existing Servers 27
Figure 2-5 Memory Size Per Server
Figure 2-5 shows that more than 50% of the servers are in the 2-2.6 GB range of memory capacity, and this information needs to be considered when the memory recommendation is produced for virtual machines. Figure 2-6 shows the operating system breakdown in the environment.
60 50 40 30 20 10 0 512 to 1023MB 10% 1024 to 1535MB 15% 1536 to 2047MB 3% 2048 to 2559MB 37% 2560 to 3071MB 1% 3072 to 3583MB 3% 3584 to 4095MB 1% 4096 to 4607MB 13% 5120 to 5631MB 1% 6144 to 6655MB 1% 8192 to 8703MB 4% 14336 to 14847MB 1% 15872 to 16383MB 2% 16384 to 16895MB 8% 18432 to 18943MB 1%
ptg
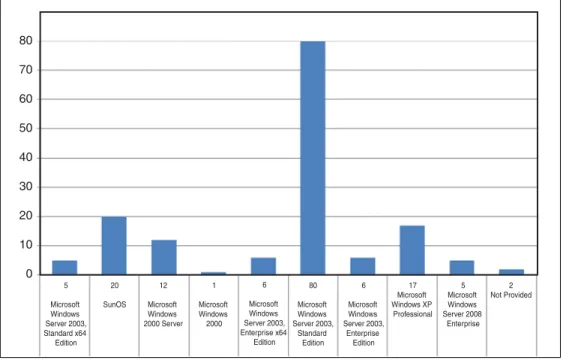
Figure 2-6 Operating System Breakdown of Servers
Figure 2-6 shows that a vast majority of servers are running a Microsoft operating system, and these servers will be consolidated. As described in the next section many of the servers, such as those running a Sun operating system, are not part of this consolidation.
This server-by-server report is invaluable to system administrators because all key information about the servers is provided. This alone is often enough justification to run Capacity Planner, because it produces such a detailed inventory. This data is also used in the power and cooling analysis done in Chapter 1 because the details of the server help produce the input to the HP Power Calculator.
Processor Utilization Report
More than 100 servers were analyzed as part of this inventory, and one revealing statistic is to see how VMware compares the utilizations of this client environment to the overall industry utilization, as shown in Figure 2-7. 80 70 60 50 40 30 20 10 0 5 Microsoft Windows Server 2003, Standard x64 Edition 20 SunOS 12 Microsoft Windows 2000 Server 1 Microsoft Windows 2000 6 Microsoft Windows Server 2003, Enterprise x64 Edition 80 Microsoft Windows Server 2003, Standard Edition 6 Microsoft Windows Server 2003, Enterprise Edition 17 Microsoft Windows XP Professional 5 Microsoft Windows Server 2008 Enterprise 2 Not Provided
ptg
Detailed System Server Report 29
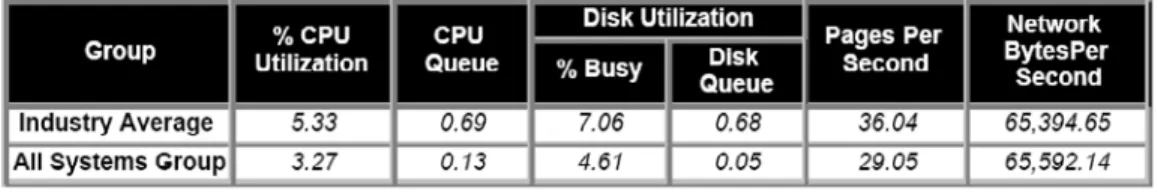
Figure 2-7 Client Results Versus Industry Average for Utilization
The following are explanations of the parameters in the figure: • Group. The two rows shown under Groupare a general industry
average and then a summary of all the systems in the client environ-ment that were evaluated.
• % CPU Utilization. Average percentage of CPU busy time for both groups.
• CPU Queue. These are the number of jobs waiting to be processed by the CPU.
• Disk Utilization % Busy. The percentage of elapsed time that the disk is busy servicing read or write requests.
• Disk Utilization Disk Queue. The average number of read and write requests queued for the disk.
• Pages Per Second. The pages read from or written to disk to resolve hard page faults. Hard page faults occur when a process requires code or data that is not in its working set or elsewhere in physical memory, and must be retrieved from disk.
• Network Bytes Per Second. The average number of bytes sent and received via the network per second.
Detailed System Server Report
VMware Capacity Planner produces a detailed report on a system-by-system basis, giving the details of every server to which access was provided. This information is gathered using Windows Management Interface (WMI), Reg-istry entries, or other techniques. Linux servers can also be analyzed by Capacity Planner, using tools such as iostat. Servers are categorized in a
ptg
variety of ways. For this example, consolidation servers fell under the fol-lowing categories:
• Potentially Obsolete Servers
• Servers with Insufficient Collection Data
• Servers Not to Be Virtualized Due to Business Requirements • Servers Not to Be Virtualized Due to Specialized Hardware
Requirements
• Servers for Possible Re-Purpose
The format of all these server lists is in the format shown in Figure 2-8.
Figure 2-8 Potentially Obsolete Servers
All the lists of servers are in the format of this table. The characteristics of each server shown are clear in all the listings.
Summary
This chapter covered the output of Capacity Planner and the tremendous amount of information it discovered about the existing server environment. The recommended target platform for virtualization provides a good start for designing the virtualized environment.