Trading the 10 O’clock Bulls
Winning Strategies for Active Traders
by
Geoff Bysshe
www.marketgauge.com
First Edition 1.06
Copyright 2009 by MarketGauge, LLC. All rights reserved. This publication is designed to provide accurate and authoritative information in regard to the subject matter covered. It is distributed with the understanding that the author and/or publisher are not engaged in rendering professional services. If professional advice or other expert assistance is required, the services of a competent professional person should be sought.
Contents
Acknowledgements ... 1
Introduction... 2
Chapter 1. The Driving Force Behind Any Market Move... 4
What You Need to Know to Be Successful in the Markets ... 4
Sentiment Is the Driving Force Behind All Major Price Moves... 5
How to Use the Power of Market Sentiment in Your Trading ... 6
Chapter 2. Why is the Opening Range (OR) so Important?... 7
Is the OR Fundamental or Technical Analysis? ... 7
What is the OR? ... 8
Why is the OR So Powerful? ... 9
The OR Is Used by the World’s Most Successful Traders ...10
Is OR Trading for You? ...10
Chapter 3. Basic Technical Analysis ...11
Understanding the Price and Volume Relationship ...11
What is a Swing High or Low? ...13
How to Identify the Trend Using Swings...14
Support and Resistance Simplified ...15
Don’t Over-Analyze the Charts ...21
Chapter 4. Assessing the Opening Range (OR)...22
Getting Started with the OR ...22
Three Questions for Analyzing the OR...24
Don’t Ignore the Stock’s Big Picture ...29
Chapter 5. Trading Breakouts and Breakdowns ...30
How to Define Your Risk, and Where to Place Your Stop ...30
Three Tactical Trading Approaches for the OR Breakout ...31
What to Look for in a Breakout ...34
Don’t Chase the One that Got Away ...41
Chapter 6. Trading the Range—Buying the Lows ...42
What is Fading the OR? ...42
Using the OR to Buy Against the Low of the Day ...42
Using the OR to Measure Intraday Relative Strength...45
Chapter 7. How to Find OR Trading Opportunities...48
How to Use Market Scanning Tools Effectively...48
A Quick Explanation of HotScans’ Functionality ...50
How to Find OR Trading Setups with HotScans...54
Three Strategies for Catching OR Breakouts ...56
Finding Stocks Before They Break Out ...62
Finding Candidates for Fading the OR Low...64
Catching the OR Low...66
Acknowledgements
This book would never have been finished without the tremendous effort of Susan Jankowitz of Sparta Technology Associates, Inc. Susan’s assistance in writing, organizing, and keeping the project moving forward was invaluable. I grossly underestimated the amount of time it would take to put together this book, and had I not had Susan there pushing and pulling me through the process, this project would have been reduced to a few newsletters. Sue, thank you for taking so much time away from your own technical writing consulting business (www.spartatech.com) to help me with this book.
This book is based on trading experience. As you will learn in the pages to follow, my trading experience began on the floor of the commodities exchanges in New York with Keith Schneider in 1990. Remarkably, Keith and I are still working and trading together at MarketGauge, LLC. While I may be the person who has written the words that follow, the content is the result and reflection of this truly remarkable partnership. Thank you Keith for making this all possible.
I also owe a great deal of thanks to Arthur Stevenson, Ph.D., who spent countless hours assisting in the editorial process and helping me express my thoughts as clearly as possible. Thank you Arthur for dramatically improving the quality of this work. I’m also very grateful for the patience of my wonderful wife, Susan, who has experienced many lonely nights and weekends during this process. Thank you Susan for your loving support.
There are many more individuals who supported and assisted in this effort to produce a book that will help traders gain new insight into the markets and improve their trading skills. I hope you will feel that we have achieved our goal.
Introduction
Welcome to Trading the 10 O’clock Bulls: Winning Strategies for Active Traders. This book was started as a series of responses to the many questions I have received about trading from our customers at MarketGauge, LLC. MarketGauge will be mentioned occasionally throughout this book because it is a big contributor to the information and insights provided in these pages. MarketGauge, LLC was founded by myself and Keith Schneider in 1995 while we were fund managers at Millennium Partners in New York. MarketGauge’s mission has always been to deliver to serious traders the professional trading tools we develop and use to find trading opportunities based on unusual price and volume activity in the market indexes, sectors, industry groups and stocks. If you are interested in MarketGauge’s tools or background you can find all the information you’ll want at www.marketgauge.com. For now I’d like to get you started on the book!
As a student of the market, former floor trader and hedge fund manager, and as a software developer, I enjoy the exchange of trading ideas and market insights. This desire to share market insights slowly transformed what was intended to be a series of articles into this book and a more organized answer to the question all traders should always be asking themselves, how can I improve my trading?
I believe that one of the most important ingredients to success in trading is focus. Following this belief, this book is primarily focused on one important market principle that can improve your trading, the Opening Range. There are a few prerequisites to being able to fully appreciate the power of the Opening Range trading approach so these prerequisites will also be discussed, but the intent of this book is not to be a comprehensive guide to trading. As such, and in an effort to stay focused, this book will not discuss one very important ingredient in successful trading - money management. While the book will describe how the Opening Range principle is great at identifying risk and evaluating trades based on well-defined risk/reward parameters, I have not dedicated a separate chapter to the topic of defining risk, managing your money, and controlling your emotions. If you are familiar with these trading issues you will quickly see how the Opening Range trading approach offers a very disciplined, low-risk approach to trading. If you are a novice trader or you are not familiar with sound methods of money management then I strongly suggest that you invest some time in educating yourself about money management in trading.
Whether you’re a seasoned trader or new to the stock market, I hope this book helps you to become a more profitable trader. More specifically, I hope that through this book you will discover new insights into how and why markets move the way they do intraday, and also gain a new methodology for finding trading opportunities based on a stock’s intraday price swings. If you are a novice trader this book will provide you with the foundation and background needed to understand all the principles discussed here. For the experienced trader the book is organized in such a way that you can simply focus on the chapters that you feel will offer you the most insight.
The focus of the book is on intraday price and volume activity but the applications of the principles discussed are in no way limited to day trading. The Opening Range can be used to determine swing trade entry points, trailing stops, and exit points. In many cases the techniques discussed here have prevented me from entering swing trades too early or exiting them too late.
How This Book Is Organized
This book begins with an explanation as to why any market should be viewed as a reflection of the sentiment of the market’s traders and investors. For as long as
markets are traded by people, movements in a market’s price will be dictated by the sentiment of the market participants. The Opening Range principle serves as a road map for identifying and exploiting price changes that are driven by shifts in market sentiment.
Chapter 2 introduces the concept of the Opening Range. This is not a complex concept. I believe a trading strategy should make sense intuitively. This chapter will explain and demonstrate how and why this simple concept works.
Chapter 3 is what I have referred to as prerequisite information. The Opening Range trading approach uses some basic technical analysis. If you are not familiar with reading charts, or identifying support and resistance levels on charts, then this chapter is required reading for you. For the more experienced technical trader this chapter will offer a review of the basics and perhaps some insight into how to simplify the process of reading the charts for the purpose of trading the Opening Range.
The next three chapters, 4-6, will explain how the Opening Range provides a trading road map for every stock everyday. These chapters provide detailed descriptions of what to look for and how to find it when it comes to spotting trading opportunities. The Opening Range offers many ways to follow momentum, long and short, or buy weakness and sell strength. These chapters will outline (with examples) a low-risk, high-reward, systematic approach to trading.
Finally, there will always be tools that make your job as a trader easier and more efficient. Chapter 7 will show you a tool that will make exploiting the opportunities of Opening Range as easy as the markets will allow.
Throughout this book I will refer to the “market”. I use the word market to describe any trading activity. The activity may be for a particular stock, index or futures contract. For example, the trading in a stock will be referred to as the market for that stock.
Chapter 1. The Driving Force Behind Any Market Move
• What You Need to Know to Be Successful in the Markets
• Sentiment Is the Driving Force Behind All Major Price Moves
• How to Use the Power of Market Sentiment in Your Trading
What You Need to Know to Be Successful in the Markets
In 1990 I got lucky. After years of watching the markets through the media, newspapers and books, I started working on the floor of the New York Commodities Exchange. My job was to be the assistant of a very successful independent floor trader, Keith Schneider. Keith had been trading on the floor since 1977. At the time the floor of the exchange was home to many futures markets including crude oil, gold, silver, coffee, sugar, cocoa, cotton, the dollar index and more. His trading approach was extremely disciplined and involved trading multiple markets at once. My main responsibilities were to help keep track of the price movements of markets and place orders in the markets he was trading. Keith was more of a mentor than a boss, and my responsibilities always felt more like an apprenticeship than a job. Now, 14 years later we are still working together as partners, and therefore this book is a reflection of his trading experiences as well as mine.
I still consider myself fortunate to have been able to start work on the floor of the Commodities Exchange, because trading on the floor lets you experience first hand the sights, sounds, and even the smell of the most powerful forces in any market – fear and greed. Trading on the floor also forces you to watch the market through the actions of the participants, as opposed to sitting at a desk following the market through the analysis of charts and quote screens. The best way to describe the difference between trading on the floor versus trading from “upstairs” on a computer is to relate it to a sporting event. Think of the difference between being at the stadium during the last few minutes of a very close basketball, football, or baseball game where the crowd roars with each twist and turn of the game, versus sitting at home watching it on television. There is no comparison. At the stadium you can feel the excitement; on the trading floor you can sense the mood of the market.
The best part about my experience on the floor was that it taught me the most important principle in understanding what makes traders successful. I believe every successful trader learns this principle or intuitively knows it, and then confirms it through experience. This principle is that there is really only one underlying market-moving force in any stock, index, futures contract, etc. This underlying force is the source of every significant price move. The underlying force is market sentiment or the market’s mood. If you analyze markets from the perspective that every significant move in a stock’s price is dictated by the sentiment surrounding that stock then all of the traditional reasons - news, earnings, the economy, etc. make more sense.
Trading on the floor makes this principle easier to see because every day the market’s mood or sentiment is revealed by its trading activity. As a trader you must look at the trading action (the price and volume movements) of the market as if it was sending you a message. The message is the market telling you why and how it moved. For example did it move quickly with a lot of volume and emotion (fear or greed)? Did it drift in one direction slowly and quietly? How did it react immediately after a news announcement? Did it reverse its initial reaction? The trading floor was an environment that forced me to experience this message every day. Like the emotional roar of the crowd at the stadium, the intensity of the trading activity on the floor
reflected the message of the market and it could not be ignored. More importantly the message I heard and saw on the floor often seemed different than the explanations of the day’s activity being reported on the evening news, in newspapers and in books. Furthermore, experiencing the market’s reactions to news events, economic reports and earnings announcements forced me to rethink much of what I thought I understood from reading so many books about charts, company valuations, and the economy. For example why do stocks with strong earnings often see their share prices fall dramatically? Why is bad economic news often followed by a stock market rally? The answer to these questions lies in market sentiment.
Sentiment Is the Driving Force Behind All Major Price Moves
A stock’s sentiment is the collective sentiment of the traders and investors who have positions or are considering entering positions in the stock. But sentiment is not simply the current mood of traders and investors. Sentiment is the prevailing expectations of the market for the future prospects of the stock. In other words, sentiment represents bullish or bearish feelings for the future prospects of a stock. This means the current movements of a stock’s price are dictated by what the market expects will happen in the future, not what has already taken place! Any news is old news, any reported earnings data is old information. I’m sure you’ve heard the expression, “the market is always looking forward.” This is not just a saying. It’s a rule to trade by and it must be applied to be successful in the markets.
To apply the principle of trading in conjunction with market sentiment you should look at a stock’s price action with the intent of answering two questions. Is the stock trading in a way that demonstrates that its sentiment is bullish, bearish or undecided? And, is there any reason for it to be trading this way (i.e. news)? With answers to these two questions you can begin to gauge the sentiment of the stock. This book will go into more detail about how to interpret price action as it relates to sentiment and how to trade based on this knowledge. The simple explanation can be found in some common sayings with which you are familiar. For example, “buy the rumor sell the news”. Let’s look at an example of this phrase. Often a stock experiences a bullish run for days, but then a piece of good news is announced and the stock sells off hard, erasing the gains of the last few days. In this scenario, if you had bought the stock when the news came out you would have lost money. Why does this happen? Simple. The market participants were expecting or knew that there was a chance that good news would come out in the near future. As a result they had good reason to be bullish on the stock’s price and this sentiment drove the price of the stock higher. When news is released traders and investors must decide if the news was as good as expected and then further assess whether there is more potentially good news on the horizon. If they can’t expect further good news then they will become less bullish and take profits. If the news was not as good as they had hoped their sentiment may turn bearish. Any shift in sentiment that would lead traders to become less bullish will create the desire to sell and that will tend to push the price of the stock lower.
Market sentiment exists on many levels. There is sentiment that is directly related to the prospects of a specific company. There is also sentiment based on the company’s industry group, and there is sentiment regarding the condition of the whole market. One of the most obvious examples of industry group sentiment was the Internet bubble in the late 90’s. During this time a company needed only to put a “.com” at the end of its name and sentiment for the stock would become insanely bullish, and as a result the share price would climb. As you know, when the market is said to be in a bull market it means that share prices in general are rising. Share prices will not rise unless the underlying sentiment of the market is bullish or improving. In a strong bull market the overall market sentiment can be strong enough to create increasingly
bullish sentiment for industry groups and individual stocks. When this occurs it seems as though every stock is going up regardless of its specific prospects looking forward.
How to Use the Power of Market Sentiment in Your Trading
Now that you know that it is not the news that is driving the markets but instead changes in market sentiment, how do you identify when sentiment is changing for the better or worse? Based on the many years of experience Keith Schneider and I have had as floor traders, money managers, and software developers of trading software, we believe we know the answer.
One of the most successful trading principles we have employed as floor traders and hedge fund managers is to identify key price points in the market where market sentiment is likely to lead to a change in the stock’s short term direction or an acceleration of its current momentum. By using these key inflection points one can read market sentiment, anticipate a stock’s next move and quickly assess which stocks are currently offering the best trading opportunities based on an analysis of risk versus reward.
I call this trading principle the Opening Range (OR) trading approach. I do not claim to be the trader who discovered the Opening Range. In fact, I’m happy to say that it has been used by many very successful professional traders for a long time. Whether you are just getting started in trading or you are an experienced trader you can benefit from understanding how the Opening Range affects a stock’s movements during the day. The Opening Range trading approach provides a trading road map for the novice and experienced trader alike.
Chapter 2. Why is the Opening Range (OR) so Important?
• Is the OR Fundamental or Technical Analysis?
• What is the OR?
• Why is the OR So Powerful?
• The OR Is Used by the World’s Most Successful Traders
• Is OR Trading for You?
Is the OR Fundamental or Technical Analysis?
Before we delve into Opening Range specifics, let’s put it in the perspective of traditional trading analysis approaches. There are two major approaches to stock and market analysis – fundamental and technical analysis.
Fundamental Analysis
Fundamental analysis, when applied to stock selection, is the analytical method in which the economic value of the company or market is the primary determinant in making a trading or investment decision. A company’s revenues, earnings, assets and liabilities are analyzed to determine whether an investment opportunity exists.
Fundamentalists believe the price of a stock will be driven by its underlying economic value. The objective as a fundamentalist is to buy stocks that are selling below their fair economic value, and sell stocks that are trading at valuations that exceed their fair economic value.
While the fundamental approach sounds like an obvious and simple approach to investing, determining the economic value of a company is not an exact science. More often than not even professional analysts do not agree on the value of a particular company.
The fundamental approach to analyzing stocks does have a lot of merit. In the long run a stock’s price will be dictated by its true economic value. However, as a trading approach it has a significant weakness. Even if you could correctly determine a company’s true economic value with absolute certainty the market may not agree with your “correct” assessment for a very long time. In fact, the market could undervalue or overvalue the stock for so long that your assessment of the true economic value may change before you have an opportunity to profit from your correct initial assessment. For example, if you buy a stock for $15 because you feel that bearish sentiment has driven its price below its true economic value of $20, and then the stock trades down to an even more undervalued level of $10 your fundamental analysis would indicate that it is an even better buy at $10. The stock may be a better value at $10 at that time. But what happens if the bearish sentiment continues to keep the stock at $10 for a year, and in that time the fundamental condition of the stock deteriorates so much that now your analysis shows that the stock’s economic value has also declined to $10. You may have been correct that the stock was worth $20 when you bought it for $15, but now it’s trading for $10 and represents a 50% loss as an investment. Furthermore $10 is what you now think it is worth so not only did you never have a chance to profit from your correct fundamental analysis, but also your own analysis now indicates that you should not expect to make money on the investment unless the stock becomes overvalued.
Technical Analysis
Technical analysis is the method in which a stock’s or market’s historical price and volume action is the primary determinant in making a trading or investment decision. Technical analysts use charts and modelling techniques to identify price trends and patterns. Technical analysis is based on the belief that a stock’s price is driven by fear, greed, supply, demand and economic value. Furthermore, a technical analyst believes that these market-moving factors create trading patterns in charts of market price and volume activity that reoccur over time. These price and volume patterns are used to anticipate future price changes in a stock. An extreme technical analyst will say that you don’t need to look at anything but the charts; all known information is reflected in the charts.
There are many different variations of charts and technical indicators but they all have the common belief that historical price and volume data can be used to indicate when a stock is under- or overvalued. A technical trader will determine a trade’s entry and exit points based on either historical price levels on charts, projected price levels, time in a trade or some other similar type of information relating to time, price and/or volume.
Many short-term traders have a bias towards some form of technical analysis. This makes sense. For short-term traders, worrying about fundamentals—how a company’s sales and earnings performed over the last few quarters—won’t have a quantifiable impact on the price of a stock over a period of hours or minutes.
The Opening Range approach is a technical approach to the markets. It incorporates time, price and volume as inputs in determining the current bullish, bearish or neutral bias of the stock’s trading activity.
What is the OR?
The Opening Range (OR) is defined in terms of time and price. The time element is simply the first X number of minutes in the trading day. The number of minutes used to define the Opening Range is your decision as a trader. In this book I define the Opening Range as the first 30 minutes of the trading day. In my trading I use both the first 5 minutes and the first 30 minutes because I have found these periods to work the best for my strategies that are geared towards both swing trading and day trading. This book will focus on the 30-minute OR because I think that this is the best time frame for introducing the OR concept. A major reason for this belief is that the markets tend to experience a reversal period around 10:00 AM EST, and there are also economic reports that are released at 10:00 AM so the 30-minute OR includes both of these factors.
The price component of the OR is the day’s trading range at the end of the OR time period. This means that the 30-minute OR is defined as the stock’s high and low for the day at 10:00 AM. The OR is not the opening price. In fact, the opening price is not a factor in calculating the OR. For example, if Amazon, Inc were to open at $46.49 and then sell off to $46.06 at 9:45 AM and then reverse and rally to $46.66 at 9:55 AM and then proceed to sell off into the middle of the day’s range until sometime after 10:00 AM, its 30-minute OR would be the day’s range at 10:00 AM or $46.06 – $46.66. This is because during the 30-minute OR period $46.06 and $46.66 were Amazon’s low and high, respectively.
Why is the OR So Powerful?
As you can see, defining the OR is easy. The 30-minute OR is strictly the high and the low of the first 30 minutes of trading. How can something so simple be so powerful?
The OR Reveals the Stock’s Bias for the Day
During the first 30 minutes of the day’s trading traders and investors are reacting to any news they have heard or analysis they have done since the close of the prior day. This makes the opening period emotionally charged and informationally rich. I call it informationally rich because traders have had time to analyze the prior day’s price action, any overnight news, the morning’s economic reports and even the opening price action. Any or all of these conditions can dramatically change a trader’s bullish or bearish sentiment. It is emotionally charged because it is the first chance traders have to trade based on their overnight conclusions. Therefore, there are a lot of potential reasons for the flurry of trading activity that occurs when the market opens. Sometimes this activity lasts a few seconds and sometimes it lasts all day. The initial flurry of activity will generally settle down by the end of the 30-minute OR period. I like to think of the Opening Range as the day’s “price discovery” period. The first 30 minutes of trading is the period when the emotionally charged bulls and bears are battling for control of the stock for the day. This battle between the bulls and bears in the morning will often determine the most significant price levels for the rest of the day. In other words, the OR defines the critical price inflection points for the day. The fact that the OR is such an emotionally charged and informationally rich period is also why the OR can determine the bias for the day as being bullish, bearish, or neutral. The OR represents the bulls and bears establishing their initial positions for the day. A move away from the OR indicates that one side is stronger than the other. When a stock moves above the OR the bulls are in control. This means the prevailing sentiment in the stock is bullish. The manner in which the stock breaks above and trades above the OR will indicate the strength of the bullish sentiment. The same but opposite analysis applies when a stock moves below its OR. A move below the OR indicates that the stock is weak and the bears are in control.
The most basic application of the OR principle is that when a stock is trading above its Opening Range you should have a bullish bias, and when it is trading below its Opening Range you should have a bearish bias. After reading this book you will be able to quickly assess whether the stock is in a bullish, bearish or neutral condition by looking at its trading relative to its Opening Range. The application of this simple rule can focus your trading in such a way that will keep you in sync with the market’s sentiment. The upcoming chapters will describe how to apply and profit from this simple rule.
The OR Provides Price Points for Identifying Opportunity and Risk
The OR provides more than just a bias for the day. By identifying important price points at which you can anticipate a market reaction the OR provides a road map for many trading strategies. For example, if you knew that a stock was likely to continue higher when it trades above a certain price wouldn’t that enable you to prepare to buy the stock at just the right time and price? Or, if you knew that a stock was likely to stop going down at a certain price wouldn’t that also help you to plan when you should purchase that stock? More importantly, when you are long a stock do you know at what price the market is telling you that you are wrong to be long, and that you should take your losses before they get worse? Understanding how a stock trades relative to its Opening Range can help you get into trades at the right time and out of losing positions without big losses. OR trading strategies identify low-risk, high-reward, trading opportunities.
The OR’s significance can be proven statistically
I believe that keeping trading strategies simple is the best approach. Along the same lines, I believe that the fundamental premise of a trading strategy should be simple and intuitive. The Opening Range principle is based on the premise that the high and the low of the Opening Range are often significant price points for the rest of the trading day. I’ve traded stocks and futures since 1990, and I could simply say “trust me” the OR high and low are important, but I don’t need to. The proof is in these simple numbers. This book focuses on the 30-minute OR so I’ll give you the statistics for this time period. The first 30 minutes of the trading day represents slightly less than 8% of the trading day. If the market action is truly random then the high of the day for a stock should occur during the first half hour of the day about 8% of the time. My research on individual stocks shows that the high for the day occurs in the first 30 minutes about 35% of the time! And the same can be said for the day’s low! This means that there is a 35% chance that the high and low for the day in a stock at 10:00 AM will still be the high and low of that stock at the end of the day. Knowing how to take advantage of this statistical bias in the markets can give you a big edge in finding opportunities and reducing risk in your trading.
The OR Is Used by the World’s Most Successful Traders
As I stated in chapter 1 there are a lot of successful traders who use the OR as a critical part of their trading strategies. I did not invent it, I picked it up as a floor trader. I was convinced that it had merit by one of the floor’s greatest traders - Mark Fisher. Mark has a very systematic approach to trading that is based on the Opening Range principle and is used in many forms by hundreds and maybe thousands of traders on and off the trading floor. He has also recently published a book detailing his systematic approach to trading. The title of the book is The Logical Trader: Applying a Method to the Madness, and I’d recommend it to anyone who is serious about improving their trading.
Is OR Trading for You?
Whether you are a swing trader or active day trader the OR provides a road map for analyzing the sentiment of the market, quantifying risk and identifying trades with good risk/reward ratios. There are many ways in which a better understanding of how markets are affected by the OR can improve your trading. If you are serious about trading, you owe it to yourself to understand this market principle.
Chapter 3. Basic Technical Analysis
• Understanding the Price and Volume Relationship
• What is a Swing High or Low?
• How to Identify the Trend Using Swings
• Support and Resistance Simplified
• Don’t Over-Analyze the Charts
There are many books on technical analysis and this chapter will not attempt to summarize the whole discipline. If you are not familiar with reading bar charts and candlestick charts you owe it to yourself to invest some time in educating yourself in the area of technical analysis. Understanding the basics will improve your insight into the market dramatically. This chapter will focus on the basic principles of technical analysis that will help you to effectively read charts and trade the OR.
Understanding the Price and Volume Relationship
Charts are an important part of trading because a stock’s chart is a visual representation of all the trading activity in that stock. Therefore, it reflects the collective sentiment of all the traders of that stock. Remember from chapter 2, sentiment is the most powerful factor in determining how a stock will move. By reading a chart you can assess whether the current sentiment is bullish, bearish, or indecisive. More importantly, the chart can identify price levels at which the sentiment will likely change for the better or worse.
There are three dimensions to reading the markets – price, volume and time. The first step to reading the charts is to understand the basic relationship between price and volume. A common mistake made by the novice chart reader is his/her tendency to focus on the price movements in the chart. Price and volume should always be looked at together. A move in price should coincide with an increase in volume. Volume is so important that many technical analysts say that volume actually precedes price. This is one way of saying that a big change in volume will often indicate an impending change in price action. Don’t ignore the volume!
The basic relationship between price and volume is one where volume confirms price. “Confirmation” is a technical analysis term that means to support, or agree with. As with many areas of analysis, technical analysis is a science of looking for coincident indications that your premise about the market is correct. When one indication agrees with another it is called confirmation. For example, if the price of a stock is rising you might anticipate that the stock will continue to go higher. If there is an increase in volume with the increase in price, the increase in volume provides another reason to believe that the price will continue to rise and thereby serves as a confirmation of the price action.
Figure 3-1 is an illustration of a bullish price and volume pattern. The shaded areas highlight the surges in volume that drove the price higher. Each surge is followed by a pause or decline in price on lighter volume.
Relative volume is what is important
Volume should be interpreted in relative terms. The absolute number of shares traded is not as important as the level of volume activity relative to the norm for the stock being analyzed. When referring to “big volume” or “increased volume” in this book I mean volume that is higher than normal. This is important because volume is used to determine an increased level of interest in the stock as its price changes.
If a stock normally trades two million shares per day and today it trades 2.2 million shares the stock is just acting normally. On the other hand, if a stock that normally trades 200,000 shares per day trades 400,000 shares today then clearly there is something unusual going on in that stock. So the same increase of 200,000 shares in two different
stocks will have very different implications. The fact that the second stock traded twice its normal volume means that there is large new or renewed interest in the stock. When there is unusually high interest in the stock it is likely to also experience an increase in volatility or continue to move in the direction of the volume.
Why does relative volume confirm price?
If an increase in volume occurs in conjunction with a rise in price it is interpreted as bullish. Why? If an upward trend is going to continue higher it will require new buyers at higher prices. Volume in a rising stock reflects the amount of buying pressure that a stock is experiencing. If volume is increasing as the stock moves higher it means there are plenty of interested buyers at the higher prices, and that is a bullish condition.
The volume can be viewed as a gauge of the sentiment of a stock’s price action. If the price and volume are rising together then more traders are getting involved as the stock climbs. The sentiment is bullish. Later in this chapter I will discuss price levels as another gauge of trader sentiment. If a stock which has been trading sideways for a long time with very little volume starts to rise from one level to the next on very light volume the market action is telling you that traders are not very excited about that move. If the same price advance happens with unusually large volume then you know that the sentiment of the stock is shifting form neutral to bullish. The analysis is straightforward, and with the right tools you can identify these shifts in momentum by scanning daily as well as intraday trading activity.
Another way to interpret higher volume is that it comes from institutional investors. These fund managers need to buy large quantities of stock when they want to establish a position that can have an impact on their overall portfolio. They generally cannot establish their whole position in one day because it would move the market too much. When these fund managers act they leave footprints or clues about their actions in the volume. These volume footprints indicate when and at what price the
Figure 3-1: Daily chart of XM Satellite Radio (XMSR)
The shaded areas highlight how a healthy upward-trending stock will experience a surge in volume when the price moves higher.
institutional investors are active buyers. One reason to keep an eye out for these volume footprints is that they don’t tend to be isolated events. When fund managers decide that they want to accumulate a large position in a stock their buying power can create large price moves that may continue uninterrupted for a whole day, a few days or even weeks. Often volume spikes will be followed by a period of lower volume consolidation which is then followed by another surge in buying. This surge-pause-surge pattern occurs intraday as well as over the course of many days.
If you have scanning software to detect these unusual volume patterns it makes the job of finding stocks that are moving or that are about to move with the support of strong buying behind them much easier. HotScans by MarketGauge (www.marketgauge.com) is an example of such software. In addition to scanning for unusual volume patterns, it also displays price and relative volume using very easy to interpret gauges.
What is a Swing High or Low?
The terms “swing high” and “swing low” are used a lot in trading, and they are important concepts not only for determining significant price levels and the trend, but also for managing risk in trading. A swing low is the low of a prior sell off. A swing high is the high of a prior rally.
Figure 3-2: A Swing High
A swing high (the highest bar, shown in red) is formed when a period’s high is higher than both the period before and after it.
Figure 3-3: A Swing Low
A swing low (the lowest bar, shown in red) is formed when a period’s low is lower than both the period before and after it.
A swing low requires at least three periods (bars on a bar chart) to be established. A swing low is formed when a period’s low is lower than both the period before it and the period after it. A swing high is the reverse. It is formed when a period’s high is higher than both the period before and after it. You cannot say that a particular bar on a chart is the lowest the stock will go until the stock experiences a period in which it does not continue to go lower. Therefore, in its simplest definition a swing low is not established until a period occurs in which a stock does not make a new low for the move. Figures 3-2 and 3-3 illustrate how swings are formed.
A swing’s significance is determined by how many periods make up the swing and the percent change in price from the prior swing point. For example, a swing low which represents the low of the last 30 periods and the beginning of a rally that has lasted for 20 periods would be considered to be a more significant swing low than one that was formed after a 3-period decline and a 3-period rise.
In figure 3-4, the major and minor swings are labelled with down arrows on the swing highs and up arrows on the swing lows. Identifying swings points can be somewhat subjective in that the size of the move and the time frame required to constitute a swing are personal decisions.
How to Identify the Trend
Using Swings
An uptrend is simply a series of higher highs and higher lows. When a stock is trending nicely it will not retrace, or move lower than, the low point of its previous correction. And, when it rallies, it rallies to a new high for the trend. Figure 3-5 is a daily line chart of Netease.com illustrating this concept of higher highs and lower lows. The red down arrows
indicate swing highs and the blue up arrows indicate the swing lows. As you can see in Figure 3-5, a trend is a
series of successively higher swing highs while the swing lows are also successively higher. While identifying a trend is not difficult, determining “the” trend is very subjective. This is because there are many trends in progress in every stock. There are long-term trends that span weeks, months or years, intermediate-term trends that span days or weeks, and short-term trends that may span days, hours or minutes. Therefore, when you are evaluating the trend of a stock you must first determine your time frame, and how you will define a valid swing in terms of price and time.
When a prior swing low is broken in an uptrend the uptrend should be considered to be over. A downtrend is not confirmed, however, until there is a second lower low. During this period between the time when the market is in neither a clear uptrend or a clear downtrend the market should be considered to be mixed or consolidating. An extended period of trendless market action is commonly referred to as a “choppy” market.
Figure 3-4: Daily Chart of Walt Disney Co. (DIS)
The red down arrow indicate swing highs, and the blue up arrows indicate swing lows.
Figure 3-5: Daily Chart of Netease.com (NTES)
This daily line chart of NTES is an example of a very strong uptrend. It is a strong trend because each swing high is higher than the previous swing high, and each swing low is higher than the previous swing low.
Figure 3-6 illustrates the transition from an uptrend to a downtrend on the daily chart of Bank of America (BAC). In this example a swing of at least four or five days is considered to be significant.
Figure 3-6: Daily chart of Bank Of America (BAC) In this daily chart, BAC
sold off from its high at point A and created a swing low at point B. Its rally from the low at point B was weak and created a swing high at point C which was lower than A. When BAC broke its swing low at point B significantly it was an indication that the uptrend was over. The new swing low at point D would then serve as confirmation of a new downtrend when it was broken by a further price decline.
How to use the swing trend in your trading
The reason for determining the condition of a stock based on its swing trend is summarized in the common expression, “The trend is your friend”. Looking at market action in terms of swings is a good way to see if there is a predominantly bullish or bearish bias to a stock. Swings are not always as clean as the examples you see here, but when they are it is a very powerful signal because it indicates a real bullish or bearish bias in the stock. Do not expect to be able to easily identify a bullish or bearish trend in every stock. It doesn’t always exist. But, now you know what to look for, and when you see it don’t ignore it. Trade with it using the principles of support and resistance covered next.
Support and Resistance Simplified
What is supportand resistance?
Support is the technical analyst’s term for a price level at which the stock is likely to stop going down. To help you remember this, think of support as something holding the market up or as a price level that will hold the market up. Resistance is the technical analyst’s term to describe the opposite condition. Resistance is a price level that holds the stock price down. The principles of support and resistance apply to all chart time frames. It doesn’t matter if you are looking at a tick chart, a one-minute chart or a monthly chart. Knowing that such price levels exist and understanding how to identify them is an important skill for most successful day traders.
How to identify and assess support and resistance
Your next question should be: "How do I find these areas of support and resistance on a chart?" There are many patterns that indicate support and resistance, but focusing
on the basics is enough to make a big impact on your trading. Identifying major areas of support and resistance is as simple as looking at the chart and finding the prices at which the market stopped advancing (swing highs) and stopped going down (swing lows). Swing highs represent resistance and swing lows represent support. Most technical analysis text books will define the support or resistance level created by the highs and lows as being the exact price of the high or low. As a trader, however, I strongly advise you to view support and resistance as being an area around the chart point. When the market approaches a support or resistance level you must watch the price and volume action to determine if, and where, the market will respect (stop at) the chart point. Sometimes the market will stop right at the high or low, but often it will stop slightly above or below the actual chart point.
Once you have identified a price level as being either support or resistance there are a number of factors that should be considered in determining how significant or strong the support or resistance level will be. These factors are as follows:
1. Time. The more time a stock trades at a price level the more significant that level becomes. This may not occur in the form of multiple clearly defined swings, but rather in a consolidation period where many of the lows of the consolidation area are at the same price level forming support.
2. Number of occurrences. This is another way of looking at how much time a
stock has traded at a particular level. If a stock has created multiple swing lows at the same price level over time, then that price level will be significant support in the future.
3. Volume. The higher the relative volume is at a particular price level, the more likely it is that the price level will become significant support or resistance. This should make sense. If support, for example, is a function of the number of buyers willing to purchase the stock at a certain price, then a price level which has attracted high volume in the past is more likely to act as support than the price level that has not attracted volume in the past.
4. How recently it was formed. Support and resistance are created by the fact
that there is real demand (creating support) or a big supply of stock (creating resistance) at certain price levels. Support and resistance levels that have been created recently are likely to be more significant than those that were formed weeks or months ago. It is for this reason that the day trader should always know the prior day’s high and low. These points represent the most recent support and resistance on the daily chart.
Let’s look at some examples. In the first example, Figure 3-7, Nextel (NXTL) is trading in a range between $11 and $14.60 on a daily chart. The support and resistance areas are labelled with a horizontal dotted line. Notice that between November and early December NXTL had established $14.60 as resistance by reversing its trend (swing highs) around that level twice, and it also established $11.00 as support by reversing its trend there twice (swing lows). Therefore, it should not have surprised traders in the following months when NXTL stopped near each of these levels two more times over the next three months. In
this example you can see that the real resistance area was from just above $14 up to the $14.60 level.
In the second example in Figure 3-8, Microsoft (MSFT) is in a trading range between $23.95 and $26.50 as indicated by the dotted horizontal lines. In June MSFT provided an example of why support should be considered an area. In the months before June MSFT had established $23.95 as support with three swing lows at this level. Then in June it broke the support and closed below it at $23.60 (labelled as point A), but the following day it did not continue to decline. Two days after breaking the support, MSFT traded back above its prior support level ($23.95) with real strength. While the chart points may have indicated that support was at $23.95, the market action revealed that there was support in the area right below $23.95 as well. When a stock is trading near a support or resistance level you must assess whether or not the stock will respect these levels. This respect might come
slightly above or below the point you are anticipating from reading the chart.
Figure 3-7: Daily chart of Nextel Comm. (NXTL)
This daily chart of NXTL is an example of how the $14.00-14.60 level acted as resistance while the $11.00 level was support for five months.
Figure 3-8: Daily chart of Microsoft Corp. (MSFT)
Point A in the MSFT chart illustrates how support is often an area rather than a specific point around a price level.
Old resistance becomes new support
So far I’ve described support as being identified by looking for swing or consolidation lows, and I’ve described resistance as being the result of swing or consolidation highs. However, whenever a support or resistance level is broken by a significant amount it reverses its role. This means that when a stock rises convincingly above a resistance level then the old resistance price level will now act as support.
A role reversal for support and resistance may be a little counterintuitive, but this is a very important concept in reading support and resistance. The best way to understand why this happens is to look at how the sentiment of the traders in a stock impacts support and resistance levels. Let’s break the traders in the stock into three categories based on their sentiment – bulls (longs), bears (shorts), and undecided.
Now let’s look at the condition where a stock breaks above resistance by a significant amount as shown in Figure 3-9.
In Figure 3-9 the stock has established a resistance level at the price indicated by the red dashed line labelled “Resistance”. This is considered resistance based on the numerous times that the stock has stopped going up when it reached that level. Consider what has been happening at or near that resistance level each time the stock gets there prior to the breakout. The shorts are selling to establish their short positions, and longs that bought the stock lower are selling to take profits. Both types of traders are selling because they think the stock’s uptrend may be ending at this level.
Now think about how these traders feel when the market moves above the resistance level to the point labelled “A”. Both the longs and the shorts will realize (or at least strongly suspect) that the stock’s uptrend is resuming. If the stock is above the resistance line the shorts are losing money, and they are going to be looking to buy back their short positions if the stock retraces close to their breakeven price. This breakeven price will be somewhere close to the resistance level. The longs that took profits at the resistance level are also going to be regretting their sales. Therefore, they will be looking to buy the stock if it dips back close to where they sold it. In addition, there are undecided traders, some of whom will become bullish as they see the stock’s uptrend resume. These traders are now also wishing they had gone long before the stock moved above the resistance level so they too will be looking to buy the next dip. Finally, the most bullish longs, the ones that did not even take profits, are now wishing that they had bought more before the stock moved above the resistance level.
As you can see, when the stock moved above the resistance level the sentiment of traders can easily be focused on a desire to buy the stock. And, as the stock begins to sell off from its high at point A and moves closer to the old resistance level each of the traders becomes a more interested buyer. This buying interest is what creates the support at the old resistance. The result of the support is a new swing low that is created as illustrated by point B.
This example started by assuming that the stock moved above the resistance level by a “significant amount”. You may be thinking – how much is significant? The answer is in the example. The reason old resistance becomes support is because traders become
Figure 3-9: Resistance Becoming Support
In this representation of a line chart point B represents the expected support level after the stock has traded up to point A.
more bullish when the stock breaks through the resistance level. This shift in sentiment causes them to want to buy the stock back at the level where they had previously sold it, or buy the stock at a level where they had previously wished they had bought it. For this shift in sentiment to occur the move above the resistance level must be enough to convince traders that they were wrong in thinking that the resistance was potentially the end of the uptrend. If a stock only moves slightly above a resistance level and then falls back below it, the increase in bullish sentiment will not occur. In fact, such price action can have the reverse effect and turn traders more bearish because they will see that the stock tried to move above the resistance and “failed”. This is one reason why support or resistance is an area and not a point!
The same principle applies when a stock moves below a support level. The old support becomes resistance. Think about how this relates to your own experiences in the market. How many times have you bought a stock because you had noticed that it had a tendency to stop at a particular level only to watch it continue to go lower? And then, when you are sitting with a losing position how often do you think about how nice it would be if you could get the opportunity to sell the position at the same price you bought it so that you wouldn’t have to take a loss? When you do this you become part of the collective market mood converting old support into new resistance.
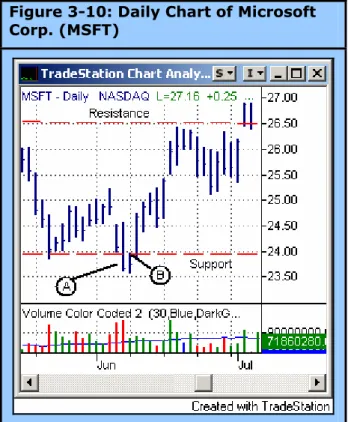
Before we look at an example where support and resistance successfully switch roles let’s look at a failure. If you take a closer look at the previously discussed MSFT chart you will see an example where the initial move below support was not significant enough for the support to become resistance. Figure 3-10 is the same June time frame shown in Figure 3-8 earlier in this chapter.
If you re-examine the break below the support at $23.95 in early June you will see the following sequence. First MSFT broke and closed below its support on big volume (labelled as point A). The next day MSFT’s high was the prior support level indicating that old support was now resistance - as you might expect (labelled as point B). On the other hand, there was also a strong indication that MSFT was still experiencing support. This indication was the fact that MSFT traded below the prior day’s low, but did not continue to move lower. In fact, it closed up for the day. The following day, two days from the breakdown day, MSFT traded above the prior day’s high which should
have been resistance for two reasons. One, it was the high of the prior day, and two, it was the old support level. The move above this high made it clear that the sentiment that had created the support at $23.95 had not been changed by the small and short move below it. When MSFT moved above this high traders should have realized that the bulls were in control and the breakdown of the $23.95 support level was going to fail and reverse.
Figure 3-10: Daily Chart of Microsoft Corp. (MSFT)
In early June MSFT broke below its support level but did not follow through. When it traded back up above the prior day’s high and the old support level it was clear that the support “area” had held.
Now let’s look at an example of resistance successfully switching roles. In Figure 3-11 you can see Netease.com (NTES) follow a sequence of old resistance becoming new support.
Figure 3-11: Daily Chart of Netease.com (NTES)
NTES demonstrates how a strongly trending stock will find support at its prior resistance levels.
In this example red dashed horizontal lines have been drawn at major resistance levels as the stock trended higher. Notice how each of these levels acted as support once NTES moved above them in a significant way. Also note the instance in which the resistance did not provide support - the failed move higher at point A. On this day NTES did not “follow through” after the prior-day close above the resistance point. The term “follow through” is another way of saying that the stock moved significantly beyond a support or resistance level. The volume on this day is not shown in the example but it was very light, which was a warning sign that NTES might not follow through. The following day was a big-volume down day that began a significant correction from the resistance level. Two weeks later, when the stock did break this resistance level in a significant way this resistance area became real support.
The basics of a breakout
The “breakout” is a commonly traded pattern. A breakout occurs when the stock moves above the resistance level of a consolidation period. A consolidation period is created when a stock trades in a well-defined range over a period of time. The examples of NXTL in Figure 3-7 and MSFT in Figure 3-8 previously discussed in this chapter are good examples of defined ranges. They are considered to be well-defined because they have numerous instances in which the particular support or resistance level was tested or reached and was followed by a reversal. In other words there are numerous swing highs and swing lows at the respective resistance and support levels.
The more time a stock spends trading in a consolidation phase the more significant the breakout from that consolidation becomes. This is because the longer a stock consolidates the more traders will establish positions based on the support and resistance levels of the consolidation. As I have already discussed, it is the sentiment
of these traders that is going to push the breakout to follow through. When a stock breaks below the support level it is also considered a breakout, although it is commonly referred to as a breakdown. A breakdown below support follows all the same principles of support and resistance as a breakout does – prior support becomes resistance.
The Opening Range approach to trading has many strategies that are based on following or fading breakouts and breakdowns. In the upcoming chapters I will describe in detail how to analyze the Opening Range as a breakout trade on an intraday chart, but the same concepts can be applied to daily charts.
Don’t Over-Analyze the Charts
The power of understanding technical analysis is not the ability to predict a stock’s every move. Good technical traders trade charts that make sense. They don’t try to make sense out of every chart.
If the chart does not have any obvious areas of support and/or resistance then don’t try to find something that doesn’t exist! One of the biggest mistakes new technical traders make is that they assume that every chart has some pattern that can be traded. The best approach to reading charts is to focus on the charts that have obvious patterns rather than trying to interpret patterns that are not clear.
The best way to trade using charts is to become your own expert in analyzing a select few chart patterns and then trade stocks that have your pattern. If you specialize and focus you will learn all the nuances of how stocks trade when they are in the condition you have defined as your pattern. When you have mastered one pattern it will be easy to add another pattern to your trading. You will find that mastering one type of pattern will make it easier to master others. For example, if you focus on buying breakouts you will quickly discover lots of nuances in price and volume action that will help you determine whether or not the breakout is going to follow through. Once you have mastered how to trade breakouts from the long side you will also know what to look for to determine which breakouts will fail. At that point looking for breakouts that are likely to fail as short candidates will be a natural extension of your expertise. To trade effectively find an efficient method of identifying stocks that have the pattern you are looking for and focus on those stocks. The most efficient way of doing this usually involves the use of software that scans the market for stocks that meet your criteria. As a co-founder of MarketGauge, I naturally think MarketGauge’s HotScans product at www.marketgauge.com is the best market scanning tool for identifying patterns based on intraday price and volume movements, but there are many other good tools available for this purpose. Find one that enables you to focus on the patterns you want to trade.
The rest of this book will be focused on helping you get started in becoming an expert in trading breakouts and other patterns based on the Opening Range. When you have mastered these patterns the same knowledge and techniques can be applied to following and fading gaps, fading the retracements to moving averages and many more setups.
Chapter 4. Assessing the Opening Range (OR)
• Getting Started with the OR
• Three Questions for Analyzing the OR
• Don’t Ignore the Stock’s Big Picture
Getting Started with the OR
Traders are always looking for insight
As a trader you have probably had an experience where something that seemed fuzzy about the markets suddenly became clear. It may have been related to reading charts, or new insight into what was really going on behind the numbers jumping around on your Level 2 screen. Suddenly and sometimes for no specific reason, you see or hear something that pulls lots of loose ends together and you experience a feeling of “Ahaa!” The concept becomes clear, obvious, and it makes you feel that you really understand. You believe you finally have insight.
Your understanding of the Opening Range trading approach will most likely come to you in two “Ahaas” or phases. First, you will realize that you can look at an intraday bar chart and clearly see the Opening Range. I don’t mean that you will be able to simply point out the high and the low and then do the math and recite the OR’s range. I mean you will be able to quickly identify the OR as bullish, bearish, tradable, not tradable, uninteresting, etc. You will have insight.
The second “Ahaa” will occur when you experience the ability to explain and anticipate a stock’s price action based on the footprint of the OR. Sound crazy? Do you think that you can use charts to explain and anticipate a stock’s price action? If you do then the OR will absolutely provide you with insight into a stock’s next intraday move. If you don’t believe in the power of the charts, studying the OR may change your mind. Insight is usually a function of experience combined with study. In this chapter I will discuss the characteristics and qualities that you should focus on in evaluating the OR. The intent is to help you experience or solidify what I described as the first phase of your understanding of the OR. If you have experience looking at the OR in your trading you may already have this level of insight and this chapter will serve as a refresher. If you have never traded using the OR as a guide, welcome to the OR! It is no coincidence that the prior chapters discussed basic technical analysis and money management. The Opening Range trading approach is powerful because it provides technical insight and trading opportunities that are based on good money management. Therefore, the Opening Range should be analyzed on two levels – technical setup and trade opportunity. The analysis of the stock’s technical condition answers the question of whether the stock is in a bullish, bearish or neutral condition. The analysis of a trading opportunity identifies whether or not the stock has a tradable OR setup. It is possible to have a bullish technical condition without having a good trading opportunity. In this case you should not try to trade! Sometimes the best trading decision you can make is to sit on your hands.
Defining the OR
The Opening Range is defined by both time and price. The time element is the first X number of minutes of the trading day. For example, if I am discussing the 30-minute OR then I am referring to the price action of the first 30 minutes of the trading day (9:30 AM-10:00 AM EST). In my trading I use the first 30 minutes of the trading day
as my default for day trades. I also look at the first 5 minutes in some situations where I may want to be more aggressive. While different trading styles do lend themselves to different OR time frames the analysis is the same. This book will focus on the 30 minute OR because I think it is the best place to start. As you will see, however, the time element is flexible.
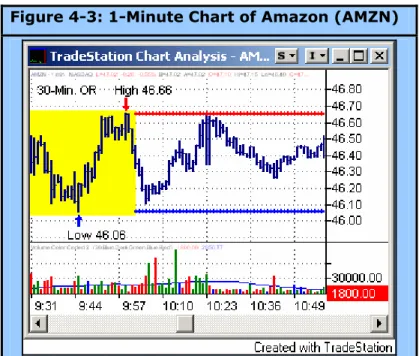
The price element of the OR definition is simply the range of the OR as defined by the high of the OR period and the low of the OR period. For example, at 10:00 AM the 30-minute OR can be defined, and it is the high for the day and the low for the day at 10:00 AM. In Figure 4-1 you will see a 1-minute chart of Amazon Inc. (AMZN) from the beginning of the day until about 11:00 AM. The first 30 minutes of the trading day are highlighted in yellow to illustrate the 30-minute OR. As you can see, on this day AMZN opened at $46.49 then sold off to a low of $46.06 at 9:45 AM, and then rallied to $46.63 by 9:52 AM where it consolidated and put in its 30-minute OR high of $46.66 at 9:59 AM. There are arrows indicating when the high ($46.66) and low ($46.06) for
the period occurred. On this day Amazon’s 30-minute OR was $46.06 – $46.66. The actual range is $0.60, but what we are more concerned with are two levels: $46.06 and $46.66. These price levels define the OR. The red and blue horizontal lines on the chart at the OR high and low are lines I put on my charts to mark the OR high and low for the remainder of the trading day. When I’m trading I often write down the OR high and low of the stocks that I am interested in trading. If I am watching the quote screen I can refer to my notes more quickly than requesting the charts to remind me of the OR levels.
How can something so simple be so important?
As you can see, defining the OR is easy. The 30-minute OR is strictly the high and the low of the first 30 minutes of trading. Now that you know how easy it is to define the OR it’s a good time to review why this simple concept is so important.
For emphasis, let’s restate some of the information from chapter 2. In the first 30 minutes of the day’s trading traders and investors are reacting to any news they have heard or analysis they have done since the close of the prior day. This makes the opening period emotionally charged and informationally rich. I call it informationally rich because traders have had time to analyze the prior day’s price action, any overnight news, the morning’s economic reports and even the opening price action. All this can represent a lot of new information for traders to act on. It is emotionally charged because it is the first chance traders have to trade based on their overnight conclusions. All this creates a lot of potential reasons why the traders may be in a hurry to get in or out of the stock. All these reasons manifest themselves in a flurry of
Figure 4-1: 1-Minute Chart of Amazon, Inc. (AMZN)
AMZN’s 30-minute Opening Range is highlighted in yellow. The red and blue horizontal lines mark the OR high and low for the rest of the day.
activity when the market opens. Sometimes this activity lasts a few seconds and sometimes it lasts all day. Generally, the initial flurry of activity will settle down by the end of the 30-minute OR period. Therefore, I like to think of the Opening Range as the day’s “price discovery” period. The first 30 minutes is the period when the emotionally charged bulls and bears are battling for control of the stock for the day. Ideally, this battle between the bulls and bears in the morning will result in a demonstration of the significant price levels for the day. In other words, the OR will define the critical price inflection points for the day.
The fact that the OR is such an emotionally charged and informationally rich period is also why the OR can determine the bias for the day as being bullish, bearish, or neutral. The OR represents the bulls and bears establishing their initial positions for the day. A move away from the OR indicates that one side is stronger than the other. If we look back at the AMZN chart in Figure 4-1 we see that AMZN traded lower after its 9:30 AM opening price, then traded higher than its opening price, all before 10:00 AM. If I were to analyze AMZN’s trading at 10:00 AM on that day I would say that AMZN attempted to go lower but at $46.06 the bulls were stronger than the bears. The rally from its low to a high of $46.66 represented its best attempt to go higher before the bears overtook the bulls.
You can see in the chart that after AMZN established its high during the OR it sold off. In fact, it continued to sell off until it reached the area of support at the low of the OR. And at the low of the OR it stopped! After bouncing off the support created by the OR low it rallied all the way back to the area of resistance created by the high of the OR, and stopped again! What next? It started to sell off from the resistance created by the high of the OR. By waiting until after 10:00 AM for the OR to define the day’s significant points of support and resistance you would have been able to anticipate AMZN’s support at the low of its OR and its resistance at the high of the OR.
As a trader you know that trading is not as easy as the AMZN example paints it to be. The real question is how could you have been confident that this time AMZN would stop at the high or the low of the OR. As with all market patterns or conditions you can never be certain of the outcome. There are, however, two principles of technical trading that apply to the OR trading approach, and that will improve your results.
1. Understand the nuances of the patterns you are trading. This means you understand all the clues to look for to separate the good from the bad.
2. Only trade the patterns you know!
This means that your analysis of any OR should result in your conclusion that the particular OR in question either offers some insight into the day ahead or it does not. If it doesn’t then you should not trade it! There are lots of trading opportunities so don’t trade a market condition where you don’t feel you have some insight. By using market scanning software like MarketGauge’s HotScans product you can easily find stocks that have the patterns you should be trading.
Three Questions for Analyzing the OR
I started this chapter by suggesting that your initial sense of understanding the OR would come in the form of being able to use the OR to gain insight into the condition of the stock. The analysis of the technical condition of the OR can be broken down into three questions. The answers to these questions will give you insight into the stock’s current condition. With a little practice the answers to these questions can be figured out very quickly, making the analysis of the OR very efficient. The three questions and their explanations are as follows: