Economics and Business Letters
8(3), 130-137, 2019
Capital structure and Board of Directors:
A quantile regression approach
Omar Farooq* • Zakir Pashayev ADA University, Baku, Azerbaijan
Received: 20 November 2018 Revised: 22 February 2019 Accepted: 27 February 2019
Abstract
This paper documents asymmetric impact of various board characteristics on capital structure in six European countries (Austria, Belgium, France, Germany, Luxembourg and Netherlands) during the period between 2008 and 2014. Quantile regression estimates show asymmetric impact of independence of board’s audit committee, presence of CEO in the board, and Chairmanship of Ex-CEO on capital structure at 10th and 90th quantile.
Keywords: Board of Directors; capital structure; agency problems; asymmetric effect
JEL Classification Codes: G34
1. Introduction
The interaction between managers and shareholders is characterized by situations, where managers may adopt a behaviour that benefits them at the expense of shareholders. Conventional arguments in finance suggest that such situations (called as agency problems) arise when shareholders cannot costlessly and perfectly monitor the managers (Myers and Majluf, 1984; Jensen, 1986; Asquith and Mullins, 1986; Gamba and Triantis, 2014). One of the ways via which agency problems can be resolved is by inducing firms to finance projects with debt. Asquith and Mullins (1986) argue that the presence of debt sets certain limitations on firms and forces managers to generate positive future cash flows. Harvey et al. (2004) note that debt subjects managers to external monitoring and enforces strict reporting guidelines. Above findings suggest that lower levels of debt are associated with higher agency problems than relatively higher levels of debt. Moderating effect of debt on agency problems, however, cannot be overstated. Mello (1992) claims that unjustified increase of debt levels leads to higher agency costs. Some of the agency problems that arise at higher levels of debt are related to under-investment and over-under-investment. High levels of debt introduce agency costs in the form of loss of flexibility and inability to invest in profitable projects (Jerzemowska, 2006).
* Corresponding author. E-mail: omar.farooq.awan@gmail.com.
Citation: Farooq, O., and Pashayev, Z. (2019) Capital structure and Board of Directors: A quantile regression approach, Economics and Business Letters, 8(3), 130-137.
In this paper, we argue that the way various dimensions of board characteristics affect capital structure depend on the level of agency problems faced by the board. Given that very high and very low levels of debt are associated with high agency problems, the affect of board characteristics on capital structure should vary across different levels of debt. For example, the monitoring role of audit committees requires that, at low levels of debt, they should advocate relatively higher debt in capital structure to align the goals of managers and shareholders. While at high levels of debt, audit committees should recommend relatively low debt levels to curb agency costs of financial distress. Consistent with these expectations, this paper finds that firms with more independent audit committees have significantly higher debt in their capital structure than their counterpart part firms at the 10th quantile. The relationship, however, reverses at high debt levels. Our findings show that firms with more independent audit committees have signif-icantly lower debt levels in their capital structure than their counterpart part firms at the 90th quantile. We argue that independent audit committees monitor managers more effectively due to the absence of any economic or personal relationships with the management (Abbot et al., 2003; Beasley, 1996). Klein (1998) notes that independent audit committees are better control-lers of firms due to no personal and economic ties with the management. Erickson et al. (2005) complement Klein (1998) by documenting positive relationship between audit committee inde-pendence and firm performance. They argue that assessment of financial information done by independent audit committees is more objective, which leads to the reinforcement of internal control and results in low agency problems.
This paper also shows that CEOs impact on capital structure is consistent with their self inter-est. This conclusion is consistent with Ntim (2012) who argues that the CEO should not hold position in the board. Our findings show that, at the 10th quantile, firms where CEOs sit on the board have significantly lower debt ratios than firms where CEOs do not sit on the board. The relationship, however, reverses at the 90th quantile. We argue that this result is driven by the
fact that, when debt levels are low, CEOs do not favor extra debt because any extra debt will put them under additional external monitoring. Lack of monitoring allows them to act in their self interest. However, at the high levels of debt, firms face financial distress problems. CEOs advocate additional debt with the hope that additional debt will allow them to invest in projects that may help the firm get out of financial distress.
Lastly, our results show negative impact of predecessor CEO’s retention as the chairman of the board on firms’ capital structure. The negative effect increases in magnitude as the amount of borrowing increases. We argue that this phenomenon occurs because former CEOs aspire toward less volatility in firm performance and encourage their successors to avoid undertaking decisions that would lead to significant alterations in performance (Quigley et al., 2010). Taking on extra debt increases the probability of default and results in increased variability of perfor-mance (either upward or downward). In order to reduce the probability of financial distress, we expect firms with high debt levels to be forced more aggressively by former CEO-chairman to reduce the amount of debt in capital structure than firms with low financial leverage. Consistent with our expectations, our findings document that the negative relationship between the reten-tion of the former CEO as a chairman and capital structure becomes stronger as the levels of debt move from 10th quantile to 90th quantile.
The remainder of the paper is structured as follows: Section 2 and Section 3 briefly describe the methodology and the data, respectively. Section 4 presents results, and the paper ends with Section 5 where conclusions are presented.
2. Methodology
conditional quantiles for examining the asymmetric impact of board characteristics on capital structure. Similar to our approach, Fattouh et al. (2005) employ quantile regression to study determinants of capital structure. They argue that determinants of leverage have a different impact depending on the firm’s degree of leverage. Therefore, in order to test the validity of our arguments, we estimate the following regression equation at five quantiles (namely 0.10, 0.30, 0.50, 0.70, and 0.90). All variables are as defined below. For the purpose of completeness, we also include country dummies (CDUM), industry dummies (IDUM), and year dummies (YDUM).
CS = α + β1(CEO) + β2(EXCEO) + β3(INDEPENDENCE) + β4(SIZE) + β5(EPS)
+ β6(GROWTH) + β7(PoR) + β8(ANALYST) + ∑ δC(CDUM)
NC−1
C=1
+ ∑ ϑY(YDUM)
NY−1
Y=1
+ ∑ θI(IDUM) + ε
NI−1
I=1
(1)
3. Data
This paper investigates the relationship between board characteristics and capital structure of non-financial firms from six Western European countries (Austria, Belgium, France, Germany, Luxembourg and Netherlands) during the period between 2010 and 2016. We exclude financial firms because high level of debt, that is typical for such firms, does not have the same meaning as for their non-financial counterparts, where high leverage indicates financial distress. All of the data used in this study is obtained from the Worldscope. Following sections will explain the data in detail.
3.1 Board characteristics
This paper uses the following board characteristics to investigate their impact on capital struc-ture:
▪ CEO is a dummy variable that takes the value of 1 if the CEO is a member of Board and 0 otherwise.
▪ EXCEO is a dummy variable that takes the value of 1 if ex-CEO is the Chairman of Board and 0 otherwise
▪ INDEPENDENCE is defined as the proportion of independent members in the audit committee.
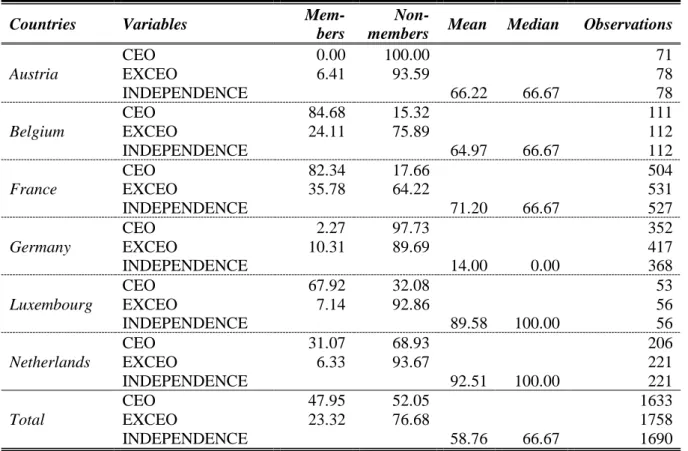
Table 1 provides descriptive statistics for variables representing board characteristics. Our data shows that, in Belgium, France and Luxembourg, the majority of CEOs appear to be the members of board. Opposite holds for CEO of Austrian, German, and Dutch firms. Table 1 also shows that most of Ex-CEOs do not hold the chairman position in boards in our sample coun-tries. Moreover, Table 1 shows that German firms do not tend to have greater proportion of independent members in their audit committees. In contrast to Germany, the proportion of in-dependent members in the audit committees of Dutch and Luxembourgish firms is excessively high with average values of 92.51% and 89.58%, respectively.
3.2 Capital structure
Table 1. Descriptive statistics for board characteristics.
Countries Variables
Mem-bers
Non-members Mean Median Observations
Austria
CEO 0.00 100.00 71
EXCEO 6.41 93.59 78
INDEPENDENCE 66.22 66.67 78
Belgium
CEO 84.68 15.32 111
EXCEO 24.11 75.89 112
INDEPENDENCE 64.97 66.67 112
France
CEO 82.34 17.66 504
EXCEO 35.78 64.22 531
INDEPENDENCE 71.20 66.67 527
Germany
CEO 2.27 97.73 352
EXCEO 10.31 89.69 417
INDEPENDENCE 14.00 0.00 368
Luxembourg
CEO 67.92 32.08 53
EXCEO 7.14 92.86 56
INDEPENDENCE 89.58 100.00 56
Netherlands
CEO 31.07 68.93 206
EXCEO 6.33 93.67 221
INDEPENDENCE 92.51 100.00 221
Total
CEO 47.95 52.05 1633
EXCEO 23.32 76.68 1758
INDEPENDENCE 58.76 66.67 1690
Table 2. Descriptive statistics for capital structure.
Countries Mean 25th percentile Median 75th percentile Observations
Austria 26.84 15.08 30.27 37.62 79
Belgium 27.80 15.22 26.27 36.57 112
France 24.51 14.57 23.32 32.95 533
Germany 24.60 15.61 24.35 33.41 424
Luxembourg 20.03 6.01 15.04 34.38 60
Netherlands 28.63 17.91 27.07 38.15 230
Total 23.15 12.30 22.10 32.54 1787
3.3 Control variables
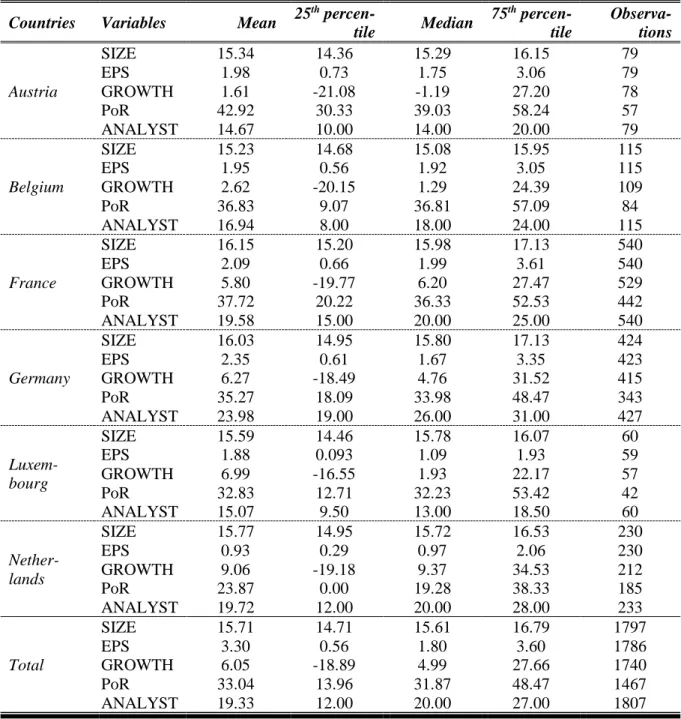
For the purpose of this paper, we use log of total assets (SIZE), earnings per share (EPS), growth in sales (GROWTH), dividend payout ratio (PoR), and extent of analyst coverage (ANALYST) as control variables. All of these variables affect capital structure to varying degrees. Table 3 shows the descriptive statistics for control variables used in our analysis. Interesting observa-tions from the following table are low dividend payout ratios for the Dutch firms and very low growth for the Austrian firms. In addition, the following table also shows that Austrian and Luxembourgish firms are followed by fewer analysts relative to firms from other countries.
4. Results
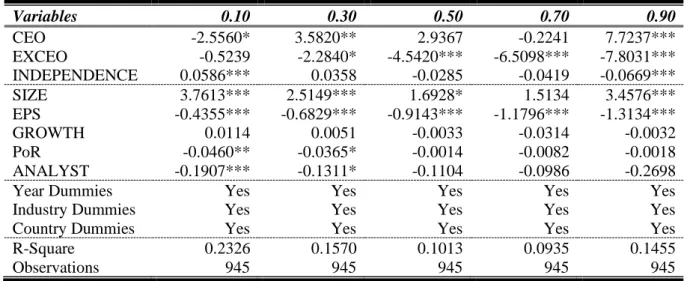
that CEOs of firms with low debt in their capital structure do not aspire towards greater lever-age. This phenomenon exists because managers do not want to be monitored as a result of additional borrowing. Lack of proper monitoring allows managers to act in a way that does not align with shareholders’ best interests. The relationship, however, reverses at the 90th quantile. We show that, at the 90th quantile, firms where CEOs sit on the board have significantly higher debt ratios than firms where CEOs do not sit on the board. We report significantly positive coefficient of CEO at the 90th quantile. The result is consistent with the notion that when firms face financial distress, CEOs push firms to take on more debt, in order to invest in projects that may, in case of success, take firms away from financial difficulties.
Table 3. Descriptive statistics for control variables.
Countries Variables Mean 25
th
percen-tile Median
75th
percen-tile
Observa-tions
Austria
SIZE 15.34 14.36 15.29 16.15 79
EPS 1.98 0.73 1.75 3.06 79
GROWTH 1.61 -21.08 -1.19 27.20 78
PoR 42.92 30.33 39.03 58.24 57
ANALYST 14.67 10.00 14.00 20.00 79
Belgium
SIZE 15.23 14.68 15.08 15.95 115
EPS 1.95 0.56 1.92 3.05 115
GROWTH 2.62 -20.15 1.29 24.39 109
PoR 36.83 9.07 36.81 57.09 84
ANALYST 16.94 8.00 18.00 24.00 115
France
SIZE 16.15 15.20 15.98 17.13 540
EPS 2.09 0.66 1.99 3.61 540
GROWTH 5.80 -19.77 6.20 27.47 529
PoR 37.72 20.22 36.33 52.53 442
ANALYST 19.58 15.00 20.00 25.00 540
Germany
SIZE 16.03 14.95 15.80 17.13 424
EPS 2.35 0.61 1.67 3.35 423
GROWTH 6.27 -18.49 4.76 31.52 415
PoR 35.27 18.09 33.98 48.47 343
ANALYST 23.98 19.00 26.00 31.00 427
Luxem-bourg
SIZE 15.59 14.46 15.78 16.07 60
EPS 1.88 0.093 1.09 1.93 59
GROWTH 6.99 -16.55 1.93 22.17 57
PoR 32.83 12.71 32.23 53.42 42
ANALYST 15.07 9.50 13.00 18.50 60
Nether-lands
SIZE 15.77 14.95 15.72 16.53 230
EPS 0.93 0.29 0.97 2.06 230
GROWTH 9.06 -19.18 9.37 34.53 212
PoR 23.87 0.00 19.28 38.33 185
ANALYST 19.72 12.00 20.00 28.00 233
Total
SIZE 15.71 14.71 15.61 16.79 1797
EPS 3.30 0.56 1.80 3.60 1786
GROWTH 6.05 -18.89 4.99 27.66 1740
PoR 33.04 13.96 31.87 48.47 1467
ANALYST 19.33 12.00 20.00 27.00 1807
independent. We report significantly positive coefficient of INDEPENDENCE at the 10th quantile. We also show that this result reverses at the 90th quantile. We report significantly
negative coefficient of INDEPENDENCE at the 90th quantile. We argue that, due to extreme levels of agency problems at very low (very high) debt ratios, more independent audit commit-tees push firms to increase (decrease) debt in capital structure. Advocating greater debt, when debt ratios are low, will subject management to greater monitoring and lead to lower agency problems. While, at high debt ratios, encouraging lower debt will reduce agency problems be-tween bondholders and stockholders.
Lastly, our results show that firms where ex-CEOs chair the boards have significantly lower debt ratios than firms where ex-CEOs do not chair the boards. We report significantly negative coefficient of EXCEO for all quantiles, except for the 10th quantile. This relationship gradually becomes stronger as firms take on more debt. We report that the coefficient estimate of EXCEO increases as the proportion of debt in capital structure increases. We argue that former CEOs tend to keep the variability in firms’ performance as low as possible. This variability might increase as a result of extra debt undertaken by corporations. Since high debt ratios lead to higher default risk, the negative impact of EXCEO on capital structure increases in magnitude as debt ratios become higher.
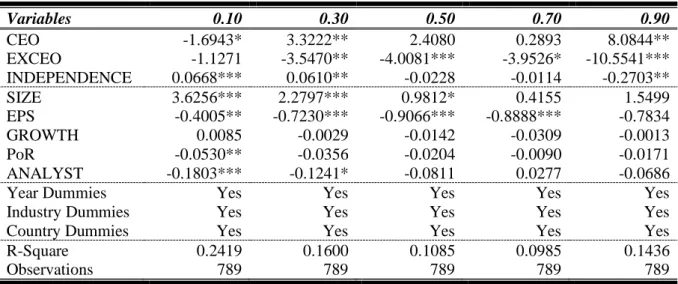
There may be concern regarding endogeneity of board variables. In order to address this concern, we re-estimate Equation (1) by using one period ahead capital structure as a dependent variable. The result of our analysis is reported in Table 5. The results of this table are qualitatively identical to those presented in Table 4. As was shown in earlier, Table 5 also shows an asymmetric impact of CEO’s board membership and independence of board’s audit committee on capital structure. Similarly, it is also shown in Table 5 that firms where ex-CEOs chair the boards have significantly lower debt ratios than firms where ex-CEOs do not chair the boards.
Another concern that may arise is that the findings of previous tables may be driven by France and Germany. In order to address this concern, we re-estimate Equation (1) for firms from Austria, Belgium, Luxembourg and Netherlands. The results of our analysis are reported in Table 6. As was shown earlier, this table also shows an asymmetric impact of CEO’s board membership and independence of board’s audit committee on capital structure. However, this table shows no significant difference between the debt ratios of firms where ex-CEOs chair the boards and firms where ex-CEOs do not chair the boards.
Table 4. Effect of board characteristics on capital structure.
Variables 0.10 0.30 0.50 0.70 0.90
CEO -2.5560* 3.5820** 2.9367 -0.2241 7.7237***
EXCEO -0.5239 -2.2840* -4.5420*** -6.5098*** -7.8031***
INDEPENDENCE 0.0586*** 0.0358 -0.0285 -0.0419 -0.0669***
SIZE 3.7613*** 2.5149*** 1.6928* 1.5134 3.4576***
EPS -0.4355*** -0.6829*** -0.9143*** -1.1796*** -1.3134***
GROWTH 0.0114 0.0051 -0.0033 -0.0314 -0.0032
PoR -0.0460** -0.0365* -0.0014 -0.0082 -0.0018
ANALYST -0.1907*** -0.1311* -0.1104 -0.0986 -0.2698
Year Dummies Yes Yes Yes Yes Yes
Industry Dummies Yes Yes Yes Yes Yes
Country Dummies Yes Yes Yes Yes Yes
R-Square 0.2326 0.1570 0.1013 0.0935 0.1455
Observations 945 945 945 945 945
Table 5. Effect of board characteristics on one period ahead capital structure.
Variables 0.10 0.30 0.50 0.70 0.90
CEO -1.6943* 3.3222** 2.4080 0.2893 8.0844**
EXCEO -1.1271 -3.5470** -4.0081*** -3.9526* -10.5541***
INDEPENDENCE 0.0668*** 0.0610** -0.0228 -0.0114 -0.2703**
SIZE 3.6256*** 2.2797*** 0.9812* 0.4155 1.5499
EPS -0.4005** -0.7230*** -0.9066*** -0.8888*** -0.7834
GROWTH 0.0085 -0.0029 -0.0142 -0.0309 -0.0013
PoR -0.0530** -0.0356 -0.0204 -0.0090 -0.0171
ANALYST -0.1803*** -0.1241* -0.0811 0.0277 -0.0686
Year Dummies Yes Yes Yes Yes Yes
Industry Dummies Yes Yes Yes Yes Yes
Country Dummies Yes Yes Yes Yes Yes
R-Square 0.2419 0.1600 0.1085 0.0985 0.1436
Observations 789 789 789 789 789
NOTE: The coefficients with 1% significance are followed by ***, coefficients with 5% by **, and coefficients with 10% by *.
Table 6. Effect of board characteristics on capital structure (excluding Germany and France).
Variables 0.10 0.30 0.50 0.70 0.90
CEO -11.0978*** -8.1210*** -7.9190*** -5.3771 0.7943
EXCEO 0.8092 3.0694 1.9970 -4.2373 3.1603
INDEPENDENCE 0.1241** 0.0138 -0.0222 -0.2566** -0.0864***
SIZE 3.8609*** 4.6454*** 4.8210*** 1.8336 2.9424
EPS -0.3583** -0.2045** -0.2421 -0.8873 -1.3561**
GROWTH 0.0331 0.0053 -0.0067 -0.0473 -0.0835**
PoR -0.0121 -0.0535** -0.0383 -0.1053 -0.1182
ANALYST -0.2794** -0.2953*** -0.2906*** -0.1398 -0.6038**
Year Dummies Yes Yes Yes Yes Yes
Industry Dummies Yes Yes Yes Yes Yes
Country Dummies Yes Yes Yes Yes Yes
R-Square 0.3767 0.3314 0.2764 0.2001 0.2720
Observations 320 320 320 320 320
NOTE: The coefficients with 1% significance are followed by ***, coefficients with 5% by **, and coefficients with 10% by *.
5. Concluding remarks
References
Abbott, L. J., Parker, S., Peters, G. F., and Raghunandan, K. (2003) The Association Between Audit Committee Characteristics And Audit Fees, Auditing: A Journal of Practice and Theory, 22(2), 17-32.
Asquith, P., and Mullins, D. (1986) Equity Issues and Offering Dilution, Journal of Financial Economics, 15(1-2), 61-89.
Beasley, M. S. (1996) An Empirical Analysis of the Relation between the Board of Director Composition and Financial Statement Fraud, The Accounting Review, 71 (4), 443-466. Erickson, J., Park, Y. W., Resing, J., and Shin, H-H. (2005) Board Composition and Firm Value
under Concentrated Ownership: The Canadian Evidence, Pacific-Basin Finance Journal, 13(4), 387-410.
Fattouh, B., Scaramozzino, P., and Harris, L. (2005) Capital Structure in South Korea: A Quantile Regression Approach, Journal of Development Economics, 76, 231 – 250
Gamba, A., and Triantis, A. (2014) How Effectively Can Debt Covenants Reduce Financial Agency Costs?, working paper, Warwick Business School, Coventry (UK).
Harvey, C., Lins, K., and Roper, A. (2004) The Effect of Capital Structure When Expected Agency Costs are Extreme, Journal of Financial Economics, 74(1), 3-30.
Jensen, M. (1986) Agency Cost of Free Cash Flow, Corporate Finance, and Takeovers,
American Economic Review, 76(2), 323-329.
Jerzemowska, M. (2006) The Main Agency Problems and their Consequences, Acta Oeconomica Pragensia, 2006(3), 9-17.
Klein, A. (1998) Firm Performance and Board Committee Structure, Journal of Law & Economics, 41(1), 275-303.
Koenker, R., and Basset, G. (1978) Regression Quantiles, Econometrica, 46(1), 33-50.
Mello, A., and Parsons, J. (1992) Measuring the Agency Cost of Debt, Journal of Finance, 47(5), 1887-1904.
Myers, S., and Majluf, N. (1984) Corporate Financing and Investment Decisions when Firms have Information that Investors do not have, Journal of Financial Economics, 13(2), 187-221.
Ntim, C. G. (2012) Does the South African Stock Market Value Independent Dual Board Leadership Structure?, Economics and Business Letters, 1(1), 35-45.