Development of Computational Pipeline Software
for Genome/Exome Analysis on the K computer
Kento Aoyama1,2, Masanori Kakuta1, Yuri Matsuzaki1, Takashi Ishida1 ,
Masahito Ohue1 , Yutaka Akiyama1
c
The Authors 2020. This paper is published with open access at SuperFri.org
Pipeline software that comprise tool and application chains for specific data processing have found extensive utilization in the analysis of several data types, such as genome, in bioinformatics research. Recent trends in genome analysis require use of pipeline software for optimum utiliza-tion of computautiliza-tional resources, thereby facilitating efficient handling of large-scale biological data accumulated on a daily basis. However, use of pipeline software in bioinformatics tends to be prob-lematic owing to their large memory and storage capacity requirements, increasing number of job submissions, and a wide range of software dependencies. This paper presents a massive parallel genome/exome analysis pipeline software that addresses these difficulties. Additionally, it can be executed on a large number of K computer nodes. The proposed pipeline incorporates workflow management functionality that performs effectively when considering the task-dependency graph of internal executions via extension of the dynamic task distribution framework. Performance results pertaining to the core pipeline functionality, obtained via evaluation experiments per-formed using an actual exome dataset, demonstrate good scalability when using over a thousand nodes. Additionally, this study proposes several approaches to resolve performance bottlenecks of a pipeline by considering the domain knowledge pertaining to internal pipeline executions as a major challenge facing pipeline parallelization.
Keywords: pipeline software, software development, K computer, message passing interface, genome analysis, exome analysis.
Introduction
The cost of analyzing the enormous amounts of life science data that accumulate on a daily basis has become a major research bottleneck because the appearance of next-generation DNA sequencers (NGS) has drastically improved the efficiency of sequencing. Today, pipeline software that automates a series of analytic tasks on a computer and provides functions that utilize computational resources effectively is indispensable for research work. In fact, data analysis using pipeline software on parallel computers is being performed daily at various research sites [1–3]. The “K computer” [4], located at RIKEN Advanced Institute for Computational Science, is representative of large-scale parallel computers in Japan and has a track record of winning the 9-th consecutive first place in the Graph500.org contest. Likewise, the K computer is expected to achieve exceptional results when performing bioinformatics analysis. However, to date, results obtained in this regard using the K computer are limited by several challenges that must be overcome.
First, several large-scale genome analysis requires large memory and storage capacity; how-ever, the specification of the K computer is that each computing node has a small memory capacity. In addition, pipeline software tend to assume that a large number of jobs can be run during internal execution. However, such an operation is not conducive for efficient functioning of the K computer. The above-mentioned problems can be attributed to the architectural
con-1Department of Computer Science, School of Computing, Tokyo Institute of Technology, 152-8550, Tokyo, Japan 2AIST-Tokyo Tech Real World Big-Data Computation Open Innovative Laboratory (RWBC-OIL), National
cept of the K computer aimed at realization of massive parallel processing through use of a large number of lightweight nodes connected by a high-speed network.
Secondly, implementation of a general bioinformatics pipeline software on the K computer requires different software that are coded in different programming languages and different li-braries to be modified to suit the SPARC architecture of the K computer. For instance, pro-gramming language environments, such as Java, are necessary to execute the software required in certain pipelines, but the same may not be officially provided within the K computer system. Therefore, the cost of developing an environment for bioinformatics analysis on the K computer can be considered a major challenge.
Exome analysis, the focus of this study, is one of the bioinformatics analysis methods that require a large-scale computing environment. In particular, exome analysis is a technique based on genome sequence analysis and is designed to efficiently detect functionally important muta-tions by analyzing only the “exon regions” in the whole human genome [5]. In exome sequencing, because the exon sequencing cost per sample is lower than general whole genome sequencing, a large number of samples is expected to be processed; thus, the computational resources are re-quired to be more powerful. The acceleration of exome analysis to enable us to process hundreds of samples urgently requires the development of an efficient analysis pipeline on a large-scale computer system.
This motivated us to develop pipeline software that performs exome analysis on the K com-puter and an extension of the task management framework for this research. We consider the affinity of our task management system and job management system of the K computer to enhance the pipeline performance.
To summarize, this study makes the following key contributions:
• We developed pipeline software that performs exome analysis on the K computer to satisfy the demands of the vast amount of exome sequencing data.
• We developed an extension of the task management framework to enable effective execution by considering the task dependencies, and to run on the K computer.
• We propose approaches to resolve the bottleneck of parallel performance of the pipeline by re-arranging the internal process.
The remainder of this manuscript has been compiled as follows.
Section 1 discusses core implementations of the proposed pipeline software to be used on the K computer. The section provides an overview of the K computer, design and implementation of the proposed pipeline software. Additionally, performance results obtained for a core function – i.e., mapping for reference genome – of the said software have been discussed.
Section 2 describes pipeline parallelization based on an execution profile, thereby demon-strating means to improve pipelining performance. In this section, the authors propose several approaches to resolve performance bottlenecks and discuss the effects of proposed approaches through evaluation experiments.
1. Development of a Genome/Exome Pipeline by Extending
a Task Management Framework on the K computer
1.1. Overview of the K Computer
The K computer [4] is a large-scale parallel computer consisting of 88,128 nodes and 864 racks in total. Each node is equipped with a Fujitsu general-purpose scalar processor SPARC64 VIIIfx, in which eight processor cores, cache memory, and a memory controller are integrated into one chip. These nodes constitute the six-dimensional mesh/torus network connected by the “Tofu” interconnect [6] to ensure that the network achieves high throughput and high availability. Table 1 shows the system specification of the K computer3,4.
Table 1. System specification of K computer # compute nodes 82,944
CPU SPARC64 VIIIfx [2.0 GHz] (8 cores) Memory DDR3 SDRAM 16 [GB]
Interconnect Tofu interconnect [6] Topology 6D mesh/torus Operating System Linux (customized)
File system Lustre (Fujitsu Exabyte File System) [8, 9]
1.1.1. Two-layer file system model and staging process
Compute node Login node
Global-FS Local-FS
User data
Application
User data
Application
Stage-out Stage-in
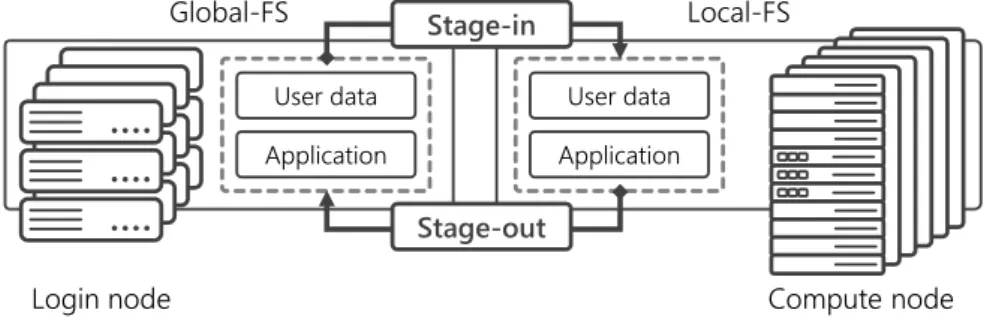
Figure 1. Two-layer file system model on K computer
The K computer supports large-scale file access from tens of thousands of nodes by adopting a two-layer file system model (Fig. 1). The first is a Local File System (Local-FS) that is used as a high-speed temporary storage area dedicated to the jobs running on the compute nodes. The second is a Global File System (Global-FS) that is used as a large-capacity shared storage area widely accessed from login node and other related systems. Both of them use the Fujitsu Exabyte File System [9] based on Lustre [8].
Users can access data stored in the large-capacity Global-FS from the login node, whereas when executing a job, the files necessary for running jobs must be transferred to the Local-FS. Specifically, by describing options such as the files path to the script at job submission, the following “staging” process will be started: input target files are copied from Global-FS to
3The K computer was operated by RIKEN in Japan between June 2012 and September 2019.
4“Fugaku” – a successor system of the K computer equipped with ARM-based CPU (A64FX) – is currently under
Local-FS before the job execution (stage-in), and after the job completion, the output target files are copied from Local-FS to Global-FS (stage-out).
All users must keep the staging process in mind when submitting a job to the K computer; consequently, the pipeline we developed on this research is also designed to be compatible with the two-layer file system model and to minimize data transfers in the staging process.
1.2. Genomon-exome: an Exome Analysis Pipeline Software
We selected “Genomon-exome” as a target for the proposed pipeline software developed for the K computer. Genomon-exome is exome analysis pipeline software designed to run in a general PC cluster environment. It provides various functions composed by using well-known open source software (OSS) in the bioinformatics field, and its entire source code is available on the web [3]. It also supports parallel execution of its pipeline internal processes by submitting jobs into the PC cluster to utilize the computational resources comprehensively. Genomon-exome has contributed to the exome sequencing data analysis in the biological field, and was extensively used to process and analyze data in various studies [1, 2].
1.2.1. General genome/exome analysis pipeline software
Supercomputer
DNA sequencer DNA sequence
Application A Application B
Application C
Pipeline software
AGGTCGTTACGTACGCTAC GACCTACATCAGTACATAG GCATGACAAAGCTAGGTGT
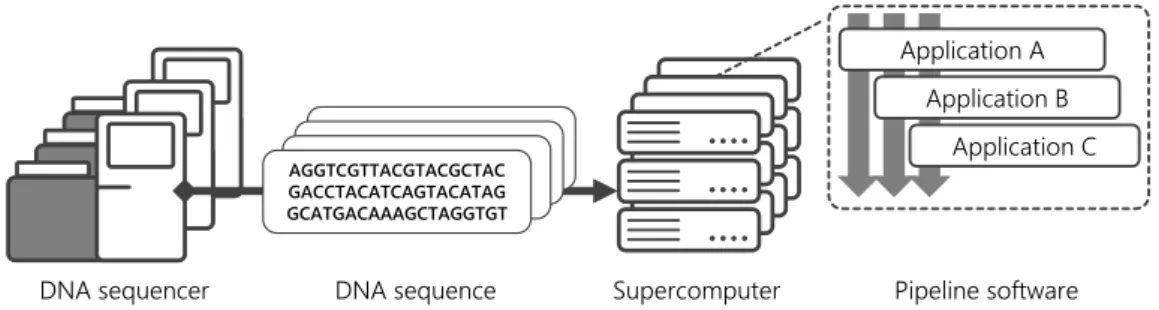
Figure 2. Computational experiments in general genome analysis workflow
The computational processes of exome analysis and general genome analysis are almost the same. Pipeline software is used to analyze the DNA sequencing data generated by the DNA sequencers or obtained from public databases to achieve its various purposes. The software is designed to perform in computing environments of various scales ranging from a small-scale PC cluster to a large-scale supercomputer (Fig. 2).
In the case of exome analysis, DNA fragments in a sample corresponding to “exonic regions” are specially hybridized and selected at the previous biological experiments, such that exome data performs effectively in specific analysis processes with metadata of exonic regions and can help to reduce the computational cost.
The following are general functions of a genome/exome analysis pipeline software.
Mapping (Alignment) Align the base sequences of several short DNA fragments (so-called “reads”) with the positions of a similar sequence in a reference genome.
Mutation call Detect mutations by comparing the differences among the aligned sequences from several types of samples.
1.2.2. Overview of mapping in Genomon-exome
・・・
・・・
・・・
・・・
・・・
・・・ i. split input
ii. alignment
iii. post-processing
iv. output
type1_R1_aaa type1_R2_aaa typeX_R1_xxx typeX_R2_xxx
type1/ga.sam typeX/ga.sam
type1/ga.bam typeX/ga.bam
FASTQ (type1, type2, … type𝑇)
type1_R1 type1_R2 typeX_R1 typeX_R2
type1_R1_aaa type1_R1_aab typeX_R2_xxx typeX_R2_xxx
bwa_aln.sh map_bwa.sh
split.sh split.sh
bwa_aln.sh bwa_aln.sh
bwa_sampe.sh
sam_join.sh
sam2orgbam.sh
checkLineSizeAlignmentBam.sh
my_mergeAlignmentBam.sh
bam2summary.sh
bwa_aln.sh
bwa_sampe.sh
sam_join.sh
sam2orgbam.sh
checkLineSizeAlignmentBam.sh
my_mergeAlignmentBam.sh
bam2summary.sh
split.sh split.sh
checkLineSizeAlignmentBam.sh
my_mergeAlignmentBam.sh
bam2summary.sh
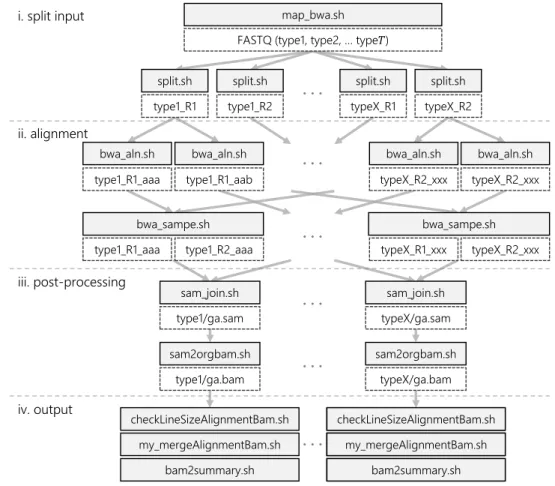
Figure 3. Task-dependency graph in mapping
Here, we present an overview of the mapping function of the pipeline in Genomon-exome (Fig. 3). Each task is defined as a shell-script that executes necessary binaries (or commands) to process input data for each purpose. All tasks in the mapping function are executed in parallel, to the extent possible, by submitting jobs to the scheduler.
i. split input Split input FASTQ format files based on parameters (split.sh), and submit jobs in parallel (map bwa.sh).
ii. alignment Do alignment of all reads in files to reference genome using the Burrows-Wheeler Aligner (BWA) [10] (bwa aln.sh), output the Sequence Alignment/Map (SAM) for-mat [11] files as mapping results using the pair-end sequence (bwa sampe.sh).
iii. post-processing Merge separated SAM files into one file by each sample (sam join.sh). Convert into a compressed format (BAM), sort the reads based on aligned position, remove duplicated reads, and create an index of reads (sam2orgbam.sh) using SAMtools [12].
1.2.3. Other functions within Genomon-exome
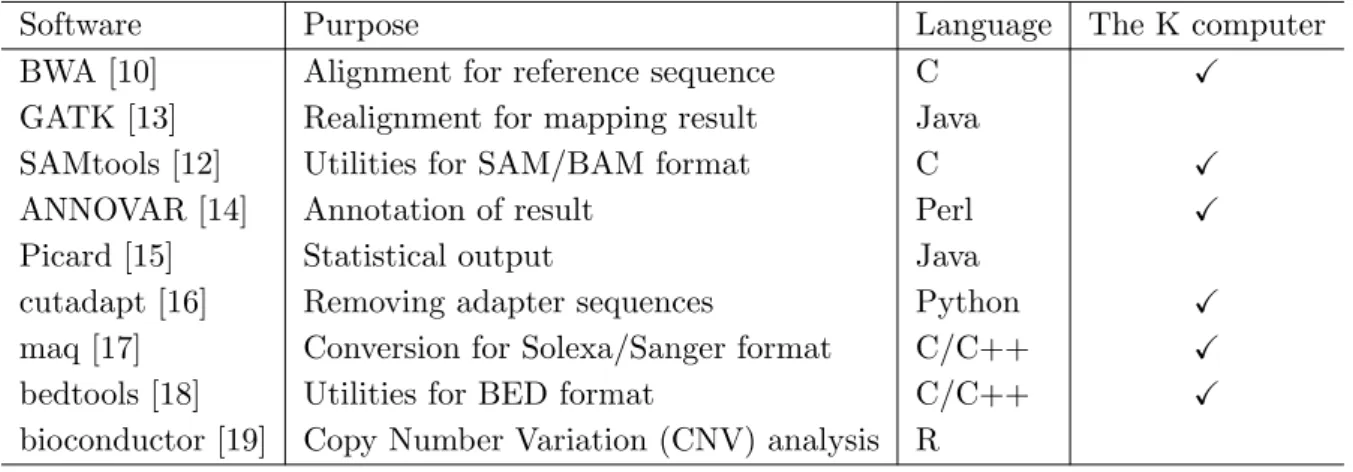
The original Genomon-exome includes other functions such as mutation calling and gene annotation. However, these functions do not necessarily perform efficiently in large-scale parallel processing because their computational cost is much smaller than that of the mapping function. Furthermore, on the K computer, the supported programming language environments in the computing nodes do not meet the full requirements of the pipeline (Tab. 2); thus, it was difficult to develop full functions of the pipeline.
Therefore, we assumed that the remaining functions in the pipeline are executed on the “pre/post-processing node” – a general-purpose computing environment accessible from the login node with support for ’R’ and ’Java’ languages. We focus on the mapping function and its large-scale parallel performance on the computing node of the K computer in the following sections. Moreover, we first focus on the alignment task on the mapping function (i. splitand
ii. alignmentin Fig. 3), because that task tends to be a dominant part of the entire mapping function.
Table 2.Software requirements of original Genomon-exome and language support in K computer
Software Purpose Language The K computer
BWA [10] Alignment for reference sequence C X GATK [13] Realignment for mapping result Java
SAMtools [12] Utilities for SAM/BAM format C X
ANNOVAR [14] Annotation of result Perl X
Picard [15] Statistical output Java
cutadapt [16] Removing adapter sequences Python X maq [17] Conversion for Solexa/Sanger format C/C++ X bedtools [18] Utilities for BED format C/C++ X bioconductor [19] Copy Number Variation (CNV) analysis R
1.3. Design and Implementation of Proposed Pipeline on K Computer System
Two major difficulties need to be solved to develop a pipeline on the K computer: those related to the pipeline task management and those related to the job management system of the K computer. The first problem is the increasing staging time due to an increase in the number of input jobs. The second problem is the increasing waiting time by unnecessary synchronization.
Problem 1: Increasing the staging time in job queuing
However, every job submission on the K computer incurs file transfer (staging) cost because of the differences of the file systems between Local-FS and Global-FS. Thus, an increase in the staging time of each job in a pipeline was a matter of pipeline development.
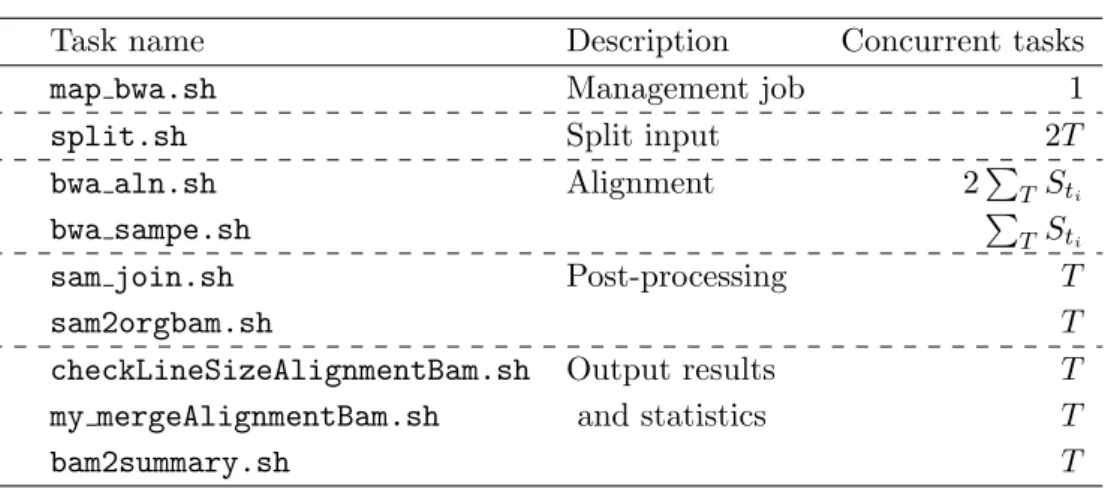
Here we present an example of the number of tasks used in the original Genomon-exome to show the maximum concurrent tasks in the mapping function (Tab. 3). In Tab. 3, T is the number of samples, ti is thei-th sample,Sti is the number of split files of thei-th sample.
During the mapping function, the alignment task (bwa aln.sh) can be performed effectively in parallel by increasing the number of split files (Sti) because it directly increases the number of running tasks simultaneously. However, increasing the number of job submissions also incurs increased waiting time for resource allocation and the staging process, thus requiring the problem to be resolved by appropriate task management on the K computer.
Table 3.Example of number of tasks in mapping function for pair-end sequence
Task name Description Concurrent tasks
map bwa.sh Management job 1
split.sh Split input 2T
bwa aln.sh Alignment 2PT Sti
bwa sampe.sh PT Sti
sam join.sh Post-processing T
sam2orgbam.sh T
checkLineSizeAlignmentBam.sh Output results T
my mergeAlignmentBam.sh and statistics T
bam2summary.sh T
Problem 2: Increasing the waiting time by unnecessary synchronization
In the original pipeline, the “management job”, which controls the workflow, always syn-chronized all jobs within a given task before proceeding to the next task. This required all tasks to wait for completion of the task with the longest execution time, albeit target data were in-dependent of those involved the other tasks. This suboptimum task balance led to performance degradation. Therefore, it is important to resolve inter-task dependencies as well as determine the necessity for task synchronization.
1.3.1. Introducing master–worker framework for task management
We introduce the MPIDP framework [20], a dynamic task-processing framework developed by the authors, as an alternative to the “management job” role in the original pipeline. MPIDP is based on the master-worker model using the MPI library, which dynamically distributes the tasks in the given list with the point-to-point MPI communications. While it is processing tasks, the master sends a new task to an available free worker, and workers execute the assigned task or request the next task, until all tasks have been completed. The data exchanges between processes are performed via the file system.
Since then, the MapReduce framework [21], which performs well by utilizing the affinity of file system access on the K computer, became available. However, it was not available at the time of the beginning of this research, and its implementation design was developed with reference to the source code of MPIDP. Therefore, in this research, we adopted MPIDP as a task-processing framework for the pipeline on the K computer.
1.3.2. Developing extension to resolve task dependencies
We also developed a new extension of MPIDP to solve another problem of the original pipeline related to unnecessary synchronization. The original MPIDP does not have the function to resolve task dependencies because it was developed for the embarrassingly parallel data-processing model. However, because each task in the pipeline depends on each target data that are not independent, the original MPIDP cannot be applied straightforwardly.
To resolve this issue, we developed an extension that enables tasks to be executed by con-sidering data dependencies. The extension provides a function that allows a task to wait only for the task it directly depends on, and awards them executable status when the dependent tasks are completed.
The extension is implemented by the simple wait queuing program to resolve the directed acyclic graph (DAG) of the task-dependency graph. Users can simply use the extension by adding theidfield of dependent tasks to the line in the task list; consequently, the next task is executed after waiting for the completion of dependent tasks without unnecessary synchronization.
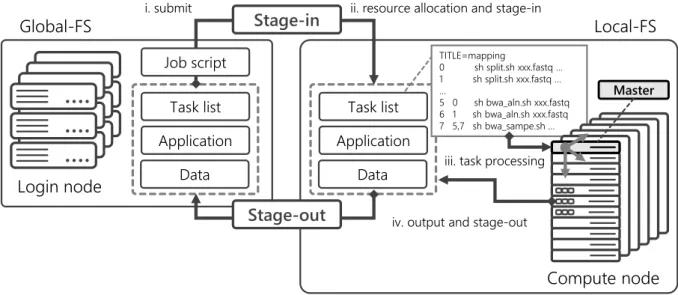
1.3.3. Building a pipeline with task management on the K computer
Login node Global-FS
Compute node Local-FS
Task list
Application
Data
Application
Data Task list
Stage-out Stage-in
i. submit ii. resource allocation and stage-in
iv. output and stage-out iii. task processing
Job script TITLE=mapping0 sh split.sh xxx.fastq…
1 sh split.sh xxx.fastq… …
5 0 sh bwa_aln.sh xxx.fastq 6 1 sh bwa_aln.sh xxx.fastq 7 5,7 shbwa_sampe.sh …
Master
Figure 4. Diagram of exome pipeline on K computer using extended MPIDP
Figure 4 diagrammatically presents the exome pipeline that uses extended MPIDP on the K computer. The applications (e.g., BWA and SAMtools) and data (e.g., FASTQ files) required in the pipeline are stored in the data partition of the Global-FS on the login node.
ii. Resource allocation and stage-in The job scheduler allocates computing resources, and starts data transfer of the target files from the Global-FS to the Local-FS.
iii. Task processing using extended MPIDP The master process of MPIDP assigns the tasks to workers, and workers start to process the tasks. Tasks are dynamically distributed by MPI communications and performed by considering the task dependencies.
iv. Output results and stage-out After the job is completed, the results are transferred from the Local-FS to the Global-FS.
1.4. Performance Evaluation
We present a performance experiment to evaluate the exome pipeline on the K computer. The experiment shows the execution time and the scalability of the alignment task of the map-ping function using our pipeline.
1.4.1. Experimental setup
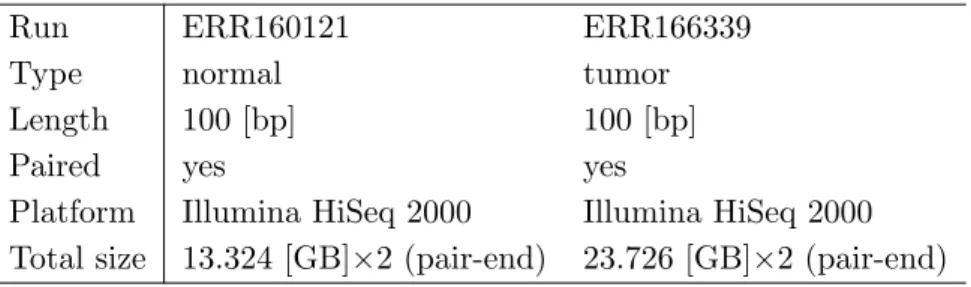
The input data we used were data from a real exome project obtained from ERP001575 [22], the lung cancer exome dataset (Tab. 4). We selected samples of normal data and samples con-taining tumors, such that the number of samples in all experiments is two (T = 2).
System and software specifications used in the experiments are provided in Tab. 5. The measured data were from elapsed timeprovided by the system stats, and internal task execu-tion of MPIDP by the gettimeofdayfunction. For configuration of the internal execution, the number of threads was set as 8 in the alignment task using BWA [10], and the others were run by using a single thread.
Table 4. Description of lung-cancer data (exome)
Run ERR160121 ERR166339
Type normal tumor
Length 100 [bp] 100 [bp]
Paired yes yes
Platform Illumina HiSeq 2000 Illumina HiSeq 2000 Total size 13.324 [GB]×2 (pair-end) 23.726 [GB]×2 (pair-end)
1.4.2. Experiment 1: alignment performance of mapping function
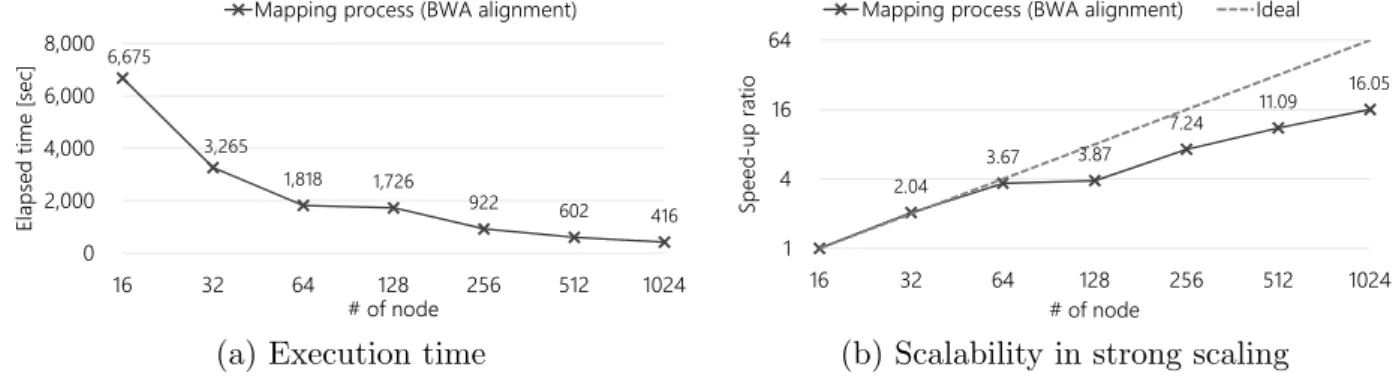
The execution time of the alignment task in the mapping function (map bwa.sh) is shown in Fig. 5a, the scalability in strong scaling is shown in Fig. 5b.
First, it was confirmed that the output of the proposed pipeline was equivalent to the result obtained using the original Genomon-exome environment on a regular PC cluster. This, in turn, implies successful development of a genome/exome analysis pipeline software on the K computer system.
Table 5. System and software settings pertaining to the K computer (Dec. 2014)
# compute nodes 82,944
CPU SPARC64 VIIIfx [2.0 GHz] (8 cores) Memory DDR3 SDRAM 16 [GB]
Operating System Linux ver. 2.6.32
C/C++ Fujitsu C Compiler ver. 1.2.0 Python Python ver. 2.6.2
Java N/A
Perl Perl ver. 5.10
MPI FUJITSU MPI Library (OpenMPI ver. 1.4.3)
6,675
3,265
1,818 1,726
922 602 416 0 2,000 4,000 6,000 8,000
16 32 64 128 256 512 1024
El ap se d tim e [s ec ]
# of node
Mapping process (BWA alignment)
(a) Execution time
2.04
3.67 3.87
7.24 11.09 16.05
1 4 16 64
16 32 64 128 256 512 1024
Sp ee d-up ra tio
# of node
Mapping process (BWA alignment) Ideal
(b) Scalability in strong scaling
Figure 5. Alignment performance of mapping function (map bwa.sh)
performed well but that gradually slowed down. Finally, its speed-up was×16.05 at 1024 nodes (based on 16 nodes) on the K computer.
On the other hand, because of the issue of total memory capacity of the compute node, our pipeline could not run with less than 16 nodes. It is because the BWA, which is software mainly used in the alignment task, consumes a large amount of memory, thereby causing an internal error in the program.
2. Further Challenges Facing Whole-Pipeline Parallelization
on K Computer
In this study, we successfully developed an exome pipeline on the K computer. The said pipeline can dynamically distribute tasks within a given job whilst efficiently eliminating un-necessary synchronizations (Sec. 1.3). In this section, to improve the performance of the entire pipeline, we extend the proposed pipeline parallelization to latter parts of the mapping function with the objective of improving performance based on an execution profile.
2.1. Performance Analysis of the Mapping Function
To clearly demonstrate the performance bottleneck of the pipeline, we obtained an execution profile of the pipeline for real exome data and estimated the total amount of execution time for each task. Table 6 lists the total execution time of each task of the mapping function. The result in each line is the summation of the execution time of 16 computing nodes. The table data include an amount to correct the measured overhead to compensate for the duplicated file I/O overhead.
Table 6.Execution time of each task and its ratio
Task name Description Elapsed time [sec] ratio
map bwa.sh Management Job -
-split.sh Split input 683 0.005
bwa aln.sh Alignment 59,876 0.448
bwa sampe.sh 29,555 0.221
sam join.sh Post-processing 1,920 0.014
sam2orgbam.sh 39,419 0.295
checkLineSizeAlignmentBam.sh Output results 3,081 0.023
my mergeAlignmentBam.sh and statistics 125 0.001
bam2summary.sh -
-TOTAL 127,094 1.00
The results show, as we expected, the most dominant task of the mapping function was bwa aln.sh (44.8%) as the main task of alignment. However, the second most time-consuming task was sam2orgbam.sh (29.5%) which is the post-processing of alignment. The tasksam2orgbam.sh, called to perform post-process alignment, shared approximately 30% of all execution time but the degree of concurrency is not as high as that of other tasks. This suggests that only a number of samples are running simultaneously, i.e., two (T = 2) in this case.
Consequently, attempts to improve the performance and increase the number of nodes would be affected by this parallel bottleneck, which would detrimentally affect the parallel performance of the pipeline. Thus, we propose several approaches to solve this problem and improve the parallel performance of the pipeline.
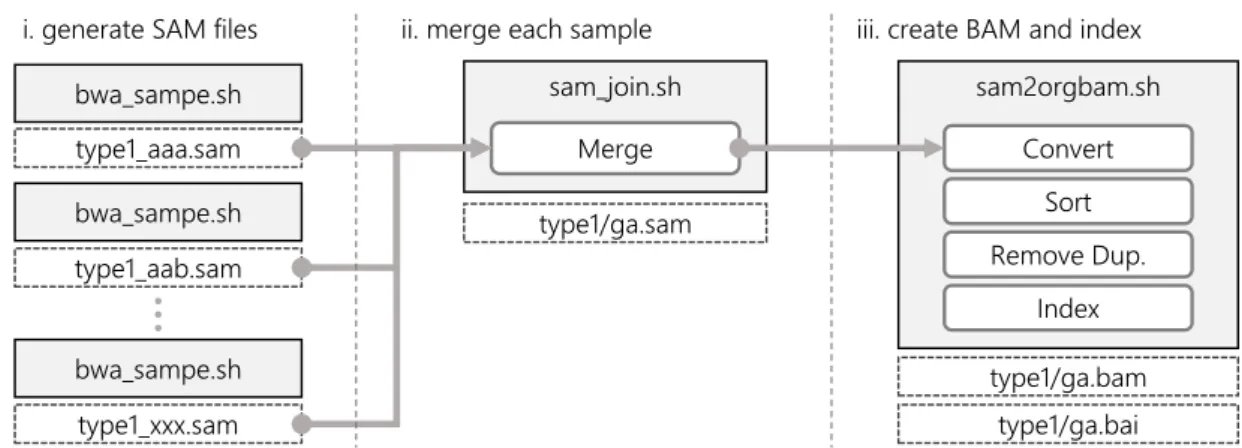
2.2. Overview of the Alignment-post-process
bwa_sampe.sh
bwa_sampe.sh
bwa_sampe.sh
sam_join.sh
Merge
sam2orgbam.sh
type1_aaa.sam
type1_aab.sam
type1_xxx.sam
type1/ga.sam
type1/ga.bam type1/ga.bai
Sort Convert
Remove Dup. Index i. generate SAM files ii. merge each sample iii. create BAM and index
The alignment-post-process is composed of several tasks such as that of merging the align-ment result files for each sample, and converting them into a compressed format (Fig. 6).
First, split SAM format [11] files are generated as the alignment result using “pair-end” information. Next, all SAM files are merged into a single SAM file for each sample. After that, each merged SAM file is converted into compressed BAM format [11], sorted based on the result of the alignment position, the duplicated reads in a file removed, and finally a BAM index created.
The Sequence Alignment/Map (SAM) format stores the result of mapping, including align-ment information of reads described in human-readable text. The BAM (binary SAM) format is a compressed SAM file intended to reduce the file size, and is compressed by BGZF (Blocked GNU Zip Format) of GZIP. These two formats are compatible and they can be converted to each other by various tools without information loss.
2.3. Proposed Approaches to Improve the Performance of the Alignment-post-process
Timeline
Parallel Proc.
Approach A Convert Sort Merge Remove Dup. Index
Approach B Convert Merge Sort Remove Dup. Index
Baseline Merge Convert Sort Remove Dup. Index
Approach C Split SAM Convert Sort Remove Dup. BAM concat Index
Serial Proc.
Figure 7. Overview of the proposed approaches
We propose 3+1 approaches to improve the parallel performance of the alignment-post-process. The first three approaches are mutually exclusive, but the last approach can be used with other approaches. No approach results in information loss, and results obtained were found to be compatible to those obtained using the baseline approach. Figure 7 shows an overview of the first three approaches.
Approach A) Rearrangement of processing order
In the alignment-post-process, the conversion of separated SAM format to BAM format can be executed independently from each other, and apart from this, the separated BAM files can be merged into one BAM file if they are sorted. Accordingly, it is possible to execute both the conversion and sorting processes in parallel prior to merging files. Subsequently, all sorted BAM files can be merged into a single BAM file (Approach A in Fig. 7).
By contrast, the “remove duplicates” process cannot be performed properly in parallel by using this approach. This is because the possibility of the existence of “duplicated reads” over other files would not allow the process to exclude the duplicates between files.
Approach B) Introduction of parallel merge sort
using two-way merge sort (Approach B in Fig. 7), where N is the number of separated files. If the sorting process dominates the execution time of alignment-post-process, it is expected to be accelerated using parallel merge sort.
Approach C) Processing individual chromosomes in parallel
Here we propose a method to parallelize the “remove duplicate” process. Once a read oper-ation is aligned to a chromosome it cannot be aligned to another chromosome; thus, by dividing the input SAM files among each of the chromosomes, the process of removing the duplicates from each file can be executed independently from each other.
First, the script parses the read operation of the aligned chromosome and splits it into tiny SAM files. Second, the script gathers and merges these tiny SAM files with each of the SAM files aligned to the same chromosome. Then, the processes of converting, sorting, and removing duplicates can be performed in parallel (Approach C in Fig. 7).
Moreover, if all regions are sorted by each chromosome, it is possible to simplify the con-catenation in the last merge process without internal sorting.
Additional) Tuning of BAM compression level
The file size of BAM format can be tuned by changing its “compression level” — similarly to gzip [23] compression level setting — and a trade-off exists between the file size and compres-sion/decompression time. Note that, if the compression level is configured as high, the execution time of processes using BAM format increases because its internal program includes converting processes from BAM to SAM, and inverse.
Therefore, we configured the compression level to zero, which implies no compression of the internal output of the pipeline, to optimize performance for all proposed approaches. Finally, it set to the default value at the terminal output, to reduce the size of output file. There are still internal conversion processes of SAM/BAM format but the performance is expected to be improved.
2.4. Performance Evaluation
We present a performance experiment to evaluate the effectiveness of our proposals from the viewpoint of resolving the bottleneck of parallel performance. We apply each proposed approach to the pipeline and measure the execution time of the entire mapping process for each approach.
2.4.1. Experimental setup
The computational environment that was used is the same as in the previous experiment.
2.4.2. Experiment 2: performance of the entire mapping function by applying the proposed approaches
32,863
31,302 30,199 29,641 28,986
18,948 19,055 18,248
17,727
13,393
11,661 10,827 10,370
15,587 13,886 13,106 12,719
7,000
5,464 4,644 4,359
0 5,000 10,000 15,000 20,000 25,000 30,000 35,000
16 32 48 64 80 96 112 128 144 160 176 192 208 224 240 256
El
ap
se
d
tim
e[
se
c]
# of node
baseline (vanilla) baseline (tuned) approach A approach B approach C
Figure 8. Execution time of the entire mapping function by applying the proposed approaches
shows the result of tuning the BAM compression level. The other labels of approach A, B, C
show the result of applying each of the proposed approaches to the baseline (tuned).
First, we confirmed that the result of tuning the BAM compression level is effective in all cases with an acceptable trade-off. Importantly, it reduces the bottleneck of internal format conversions in the alignment-post-process; therefore, we assumed that the tuning would also be effective in the other approaches.
Our experiments confirmed thatapproach C, with parallelizing for each chromosome, deliv-ers the most effective performance improvement of all.approach C, in which almost all processes of the alignment-post-process are performed in parallel, yielded good results, and simple BAM concatenation also performed well because it reduces the time for internal BAM conversion. The other approaches also outperformed the baseline (tuned). That is, approach A, Balso showed good results but they were not comparable with the result obtained withapproach C.
However, no results were obtained in cases of executions involving a small number of nodes (N = 16). This was attributed to occurrence of the segmentation-fault error during the alignment process when generating the result of alignment from using “pair-end” information. Investigation of what led to occurrence of the said error yielded no concrete results.
3. Discussion
In the last experiment, we confirmed our proposed approaches performed effective to reduce the execution time; however, even when we used the most effective of all the proposed approaches, the scalability was not as good as we expected.
Limitation of the parallelization of chromosomes
problem, we consider splitting the SAM files into a larger number of small regions, rather than depending on the number of chromosomes to improve the performance.
Task load balancing between worker nodes
Additionally, to confirm the stats of load balancing, we calculated the average idle time in experiment 2 (Fig. 9). The average idle time increases with the number of nodes and approxi-mately 56.5% of the execution time is also included in the idle time even for the most satisfactory case at 32 nodes on approach C. Therefore, our proposed approaches show certain improvements in parallel performance; however, they remain problematic with respect to concurrency.
0.865
0.930 0.964 0.981
0.565
0.695
0.811
0.886
0.5 0.6 0.7 0.8 0.9 1.0
32 64 128 256
Id
le
ti
m
e
ra
tio
# of node
baseline (vanilla) baseline (tuned) approach A approach B approach C
Figure 9. Average idle time ratio of each node during the mapping function
4. Related Work
Container-based virtualization that generates less performance overhead, such as the con-tainer systems Docker, Singularity [24], is spreading into the cloud and HPC environments. Benchmarks and system reports of container technology have been increasing in bioinformat-ics, especially in pipeline deployment, because the reproducibility and availability of a pipeline would be improved by container technology as application-level virtualization. Although con-tainer compatible pipelines (e.g., Nextflow [25]) are spreading in the bioinformatics field, the K computer does not provide such a container environment.
NGS analyzer [26] is a whole-genome analysis pipeline developed at RIKEN that can be implemented in HPC environments such as the K computer. We used its implementations as a reference for our pipeline development but the purpose of the pipeline is different from ours.
Conclusions
Furthermore, we attempted to extend the pipeline parallelization to the alignment post-process, for which we proposed 3+1 approaches to resolve the performance bottleneck by focusing on the number of concurrent tasks in alignment-post-process. The experimental results showed that our approaches are able to effectively improve the performance of the pipeline, which achieved a maximum speed-up of ×6.6 on 256 nodes, compared with the baseline.
The proposed pipeline has been tailored to the system architecture of the K computer. However, the MPIDP framework extended in this study is based on the general MPI framework, and therefore, it is compatible with regular pipelines and PC clusters. In addition, the proposed pipeline would be expected to contribute to address the vast cost of genome analysis, and to the personalized drug development based on genomic information.
Code Availability
The source code pertaining to the extended MPIDP framework is available in the author’s GitHub repository5. The source code of the original Genomon-exome pipeline software [3] has
been distributed under the Genomon License6.
Acknowledgements
We gratefully acknowledge contributions by the following people who provided us with the Genomon-exome and useful advice: Satoru Miyano, Seiya Imoto, Yuichi Shiraishi, Yoshinori Tamada, Satoshi Ito, and Kenichi Chiba. This research used computational resources of the K computer provided by the RIKEN Advanced Institute for Computational Science through the HPCI System Research project (Project ID: hp130017, hp140230). This research was supported by Core Research for Evolutional Science and Technology (CREST) “Extreme Big Data” (Grant No. JPMJCR1303) from the Japan Science and Technology Agency (JST).
This paper is distributed under the terms of the Creative Commons Attribution-Non Com-mercial 3.0 License which permits non-comCom-mercial use, reproduction and distribution of the work without further permission provided the original work is properly cited.
References
1. Yoshida, K., Yoshizato, T., Shiraishi, Y., et al.: Integrated molecular analysis of clear-cell renal cell carcinoma. Nature Genetics 45(8), 860–867 (2013), DOI: 10.1038/ng.2699
2. Yoshida, K., Sanada, M., Shiraishi, Y., et al.: Frequent pathway mutations of splicing ma-chinery in myelodysplasia. Nature 478(7367), 64–69 (2011), DOI: 10.1038/nature10496
3. Genomon-exome. http://genomon.hgc.jp/exome/en/, accessed: 2019-02-20
4. Miyazaki, H., Kusano, Y., Shinjou, N., et al.: Overview of the K computer system. Fujitsu Scientific Technical Journal 48(3), 302–309 (2012)
5. Bamshad, M.J., Ng, S.B., Bigham, A.W., et al.: Exome sequencing as a tool for Mendelian disease gene discovery. Nature Reviews 12(11), 745–755 (2011), DOI: 10.1038/nrg3031
6. Ajima, Y., Inoue, T., Hiramoto, S., et al.: The Tofu Interconnect. IEEE Micro 32(1), 21–31 (2012), DOI: 10.1109/MM.2011.98
7. Shimizu T.: Supercomputer “Fugaku”. ISC High Performance 2019, 16-20 June 2019, Frank-furt, Germany. (2019)
8. Braam, P.J.: The Lustre Storage Architecture. CoRR abs/1903.01955v1 (2019), http:// arxiv.org/abs/1903.01955
9. Sakai, K., Sumimoto, S., Kurokawa, M.: High-performance and highly reliable file system for the K computer. Fujitsu Scientific and Technical Journal 48(3), 302–309 (2012)
10. Li, H., Durbin, R.: Fast and accurate short read alignment with Burrows-Wheeler transform. Bioinformatics 25(14), 1754–1760 (2009), DOI: 10.1093/bioinformatics/btp324
11. Sequence Alignment/Map Format Specification - The SAM/BAM Format Specification Working Group. http://samtools.github.io/hts-specs/, accessed: 2019-02-20
12. Li, H., Handsaker, B., Wysocker, A., et al.: The Sequence Alignment/Map format and SAMtools. Bioinformatics 25(16), 2078–2079 (2009), DOI: 10.1093/bioinformatics/btp352
13. McKenna, A., Hanna M., Banks E., et al.: The Genome Analysis Toolkit: a MapReduce framework for analyzing next-generation DNA sequencing data. Genome Research 20(9), 1297– 1303 (2010), DOI: 10.1101/gr.107524.110
14. Wang, K., Li, M., Hakonarson, H.: ANNOVAR: functional annotation of genetic vari-ants from high-throughput sequencing data. Nucleic Acids Research 38(16), e164 (2010), DOI: 10.1093/nar/gkq603
15. Picard. http://broadinstitute.github.io/picard, accessed: 2020-01-20
16. Marcel, M.: Cutadapt removes adapter sequences from high-throughput sequencing reads. EMBnet.journal 17(1), 10–12 (2011), DOI: 10.14806/ej.17.1.200
17. Li, H., Ruan, J., Durbin, R.: Mapping short DNA sequencing reads and call-ing variants uscall-ing mappcall-ing quality scores. Genome Research 18(11), 1851–1858 (2008), DOI: 10.1101/gr.078212.108
18. Quinlan, A.R., Hall, I.M.: BEDTools: a flexible suite of utilities for comparing genomic features. Bioinformatics 26(6), 841–842 (2010), DOI: 10.1093/bioinformatics/btq033
19. Gentleman, R.C., Carey, V.J., Bates, D.M., et al.: Bioconductor: open software devel-opment for computational biology and bioinformatics. Genome Biology 5(10), R80 (2004), DOI: 10.1186/gb-2004-5-10-r80
20. Ohue, M., Shimoda, T., Suzuki, S., et al.: MEGADOCK 4.0: an ultra-high-performance protein-protein docking software for heterogeneous supercomputers. Bioinformatics 30(22), 3281–3283 (2014), DOI: 10.1093/bioinformatics/btu532
22. Seo, J.S., Ju, Y.S., Lee, W.C., et al.: The transcriptional landscape and mu-tational profile of lung adenocarcinoma. Genome Research 22(11), 2109–2119 (2010), DOI: 10.1101/gr.145144.112
23. Deutsch, P.: “GZIP file format specification version 4.3”, RFC Editor (1996), DOI: 10.17487/RFC1952
24. Kurtzer, G.M., Sochat, V., Bauer, M.W.: Singularity: Scientific containers for mobility of compute. PLOS ONE 12(5), 1–20 (2017), DOI: 10.1371/journal.pone.0177459
25. Tommaso, D.P., Chatzou, M., Floden, E.W., et al.: Nextflow enables reproducible compu-tational workflows. Nature Biotechnology 35(4), 316–319 (2017), DOI: 10.1038/nbt.3820