136
REACTION OF SUNFLOWER GENOTYPES TO THERMAL STRESS
CONDITIONS IN THE SANDY SOILS AREA OF SOUTHERN OLTENIA
Drăghici I. (1), Maria Joița Păcureanu (2), Reta Drăghici (1), Mihaela Croitoru (1),
Aurelia Diaconu (1), Ploae Marieta (1), Alina Paraschiv (1)
(1) Research & Development Center for Agricultural Plants on Sands, Dabuleni, Romania; E-mail: [email protected]
(2) National Agricultural Research and Development Institute, Fundulea; E-mail:
Keywords: physiology, drought, production, quality
ABSTRACT
The researches carried out during 2016-2017 at RDCSPS Dabuleni aimed at the behavior of biological sunflower material, created at NARDI Fundulea, under conditions of thermal water stress from the sandy soils in southern Oltenia. The results obtained at 109 sunflower genotypes underline the favorability of Romania's southern area for sunflower culture. It showed significantly distinct positive correlation between the rate of photosynthesis in the plant, and photosynthetic active radiation (r = 0.282 **) as well as between foliar sweating rate and leaf surface temperature (0.412 **). The production was differentiated according to the genotype and the climatic conditions of the agricultural year, ranging from 2299-5180 kg / ha, with an average of 4307 kg / ha.
INTRODUCTION
The spectacular growth of sunflower crops in recent years, is due to the ability of farmers to establish crop structure by market, the involvement of oil factories in cultivation and subsidies, higher stability of sowing, due to greater tolerance to stress (Maria Păcureanu-Joita et al., 2007). The pedoclimatic conditions of sandy soil offer the possibility of heliophilous plant cultivation, such as sunflower, given that this species presents structural anatomical and physiological adaptations, which give it great tolerance to drought. Drought resistance of sunflower is explained by the large number of stomata on the leaf level through deep root system, which explores the soil and water stress tolerance (Merien A.,1992, Lawlor D,V.1995, Vrînceanu A.V., 2000).
Sunflower culture has wide adaptability and poor abiotic conditions, where yields are seriously affected (R. Amutha si alții, 2007). In general, drought determines the concentration of the soil solution, the reduction of foliar absorption by the accumulation of abscisic acid, which closes stomata and which increases the resistance of plants to water stress 100 times (Salisbury şi Ross-1991). The researches carried out by Marinica Gh. and Dascălu D., 1984, have shown that the prolonged drought, as well as its repeated return during vegetation period, has negative repercussions on the production of sunflower, therefore it is necessary to ensure water consumption of approx. 1200-2400
m3/ha. In the context of climate change and the fact that Romania's agriculture has more
than 3 million hectares affected by drought, the research in this of this scientific report
aims at testing a biological sunflower material with the purpose of selecting genotypes, which is drought resistant / drought tolerance.
MATERIALS AND METHODS
Analele Universităţii din Craiova, seria Agricultură – Montanologie – Cadastru (Annals of the University of Craiova - Agriculture, Montanology, Cadastre Series) Vol. XLVII 2017
137
Development of Romania. There were studied 109 genotypes created at NARDI Fundulea, of which 60 genotypes in 2016 and 49 genotypes in 2017, located in the field according to randomized block method in three repetitions. The investigations were carried out under irrigation conditions on an eutric psamosol, which on the 0-25 cm depth recorded the following chemical composition: humus = 1.06%, total nitrogen = 0.06%, extractable phosphorus = 38 ppm, exchangeable potassium = 83% and a pH in water of 5.62. During the vegetation period, in the flowering phase of plants, determined rate of photosynthesis and leaf transpiration rate, with the LCpro + Portable Photosynthesis System, in 3 moments of the day (9 o'clock, 12 o'clock, 15 o'clock). At harvest, seed production and fat percentage were determined. The obtained results were calculated and interpreted statistically by variance analysis and mathematical functions.
RESEARCH RESULTS
Analyzing the evolution of climatic conditions during the period 2016-2017, during the growing season of the sunflower, there is an increase of the drought phenomenon over the study period compared to the multiannual average (Table 1). There were temperature increases of 1.54-1.62 ° C, compared to the multiannual average, which were favorable for the growth and development of sunflower plants. Sunflower has medium requirements for humidity. Due to its deep root system, the sunflower carries the drought better than other cultivated plants. However, prolonged drought as well as its repeated return over the vegetation period has negative repercussions on production (Marinica Gh. and Dascălu D., 1984). The authors mention a consumption of 1200-2400 m3 / ha, in which the rainfall recorded during the vegetation period in the two years (250,4-308,4 mm) was insufficient. It is necessary to fill it with the irrigation work in order to providing 70% of the active humidity range on a 50 cm depth.
Table 1 Climatic conditions of CCDCPN Dăbuleni weather station
during the growing sunflower genotypes
Year/Climatic parameters April May June July August Average
(0C)
∑ 0
C /mm
2016 Monthly average
temperature (0C)
15 16.8 23.6 24.8 23.5 20.74 3173.22
Maximum monthly (0C) 31.4 32.9 37.3 38.0 38.0
Monthly rainfall amount (mm)
60.2 104.4 53.2 31.6 1 250.4
2017 Monthly average
temperature (0C)
12 17.8 24 24.8 24.8 20.68 3164.04
Maximum monthly (0C) 29.8 29.0 41.2 40.8 40.4
Monthly rainfall amount (mm)
62.8 78.6 17.4 120.8 28.8 308.4
Multiannu al average (1956-2016)
Monthly average temperature (0C)
11.8 16.8 21.6 23.1 22.4 19.14 2928
Monthly rainfall amount (mm)
138
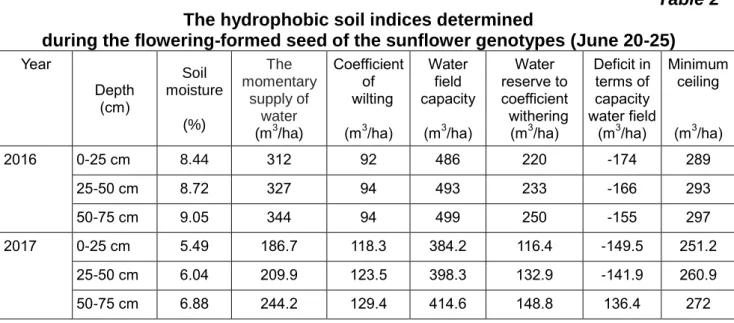
Table 2 The hydrophobic soil indices determined
during the flowering-formed seed of the sunflower genotypes (June 20-25)
Year
Depth (cm)
Soil moisture
(%)
The momentary
supply of water (m3/ha)
Coefficient of wilting
(m3/ha)
Water field capacity
(m3/ha)
Water reserve to coefficient withering (m3/ha)
Deficit in terms of capacity water field
(m3/ha)
Minimum ceiling
(m3/ha)
2016 0-25 cm 8.44 312 92 486 220 -174 289
25-50 cm 8.72 327 94 493 233 -166 293
50-75 cm 9.05 344 94 499 250 -155 297
2017 0-25 cm 5.49 186.7 118.3 384.2 116.4 -149.5 251.2
25-50 cm 6.04 209.9 123.5 398.3 132.9 -141.9 260.9
50-75 cm 6.88 244.2 129.4 414.6 148.8 136.4 272
The influence of climatic conditions, during the blooming-seed period, when the water the plant consumption is maximum, is highlighted by low values of the soil's hydrophysical parameters (Table 2). Thus, in the last decade of June, the small amount of precipitated precipitation caused the soil moisture to be reduced per profile, with very low values of 8.44-9.05%, in the year 2016 and 5.49-6.88%, in the 2017, the momentary supply of water was also low (186.7-344 m3 / ha), in relation to plant requirements. All the other elements of the irrigation regime (Coefficient of wilting, Water field capacity, Minimum ceiling and Water reserve to coefficient withering) showed low values, indicating the installation of the atmospheric and pedological drought phenomenon, just as the sunflower plants were in the pollination period and the filling of the seeds, which determines the soil moisture replenishment by applying irrigations. Sunflower physiology research has been aimed at monitoring the physiological reactions under the influence of climatic factors. As a result, can be selected tolerant and drought resistant genotypes for their expansion into culture on sands. Because the foliar appliance plays a decisive role in the formation of seed production, the following were analyzed: the middle floor leaves; the leaves at the base and at the top of the plants, are less active, as the first grow fast and the others use, like seeds, the nutrients developed by the leaves of the middle floor. Physiological determinations carried out at 37 genotypes of sunflower in the year 2016 and in 28 genotypes studied under the conditions of 2017, have underlined a significant diurnal variation in the photosynthesis and perspiration processes of the plant (Figures 1, 2). The rate of photosynthesis was influenced by studied hybrids and the active radiation in photosynthesis in the moments of the determinations (Figure 1, Table 3). The literature indicates that the photosynthetic activity of the plants remains stable up to 30 0C, then
decreases and is inhibited to 400C, because under heat stress conditions, the
photosynthesis process is inhibited by the decrease of Ribuloso-diphosphate-carboxylase enzyme activity (Sage and Cubien, 2007). In potato, for example, Hammes' research in
1990, showed that raising the temperature from 15 0C to 40 0C resulted in a decrease in
the net intensity of the photosynthesis process by 37%, compared to that determined at 20
Analele Universităţii din Craiova, seria Agricultură – Montanologie – Cadastru (Annals of the University of Craiova - Agriculture, Montanology, Cadastre Series) Vol. XLVII 2017
139
Table 3 Climate conditions recorded on the foliar surface area
with the LCpro + Portable Photosynthesis System
Year Active radiation in photosynthesis
(µmol/m2 /s)
Temperature at the surface of the leaf (0C)
9 o'clock 12 o'clock 15 o'clock 9 o'clock 12 o'clock 15 o'clock
2016 931-1421 1095-1803 394-1956 26,6-34,1 29,3-37,3 30-38,8
2017 1006-1619 1436-1620 219-1101 26,6-30,9 30,8-36,3 31,2-34,8
In 2016, considered a normal year in terms of climate, the plant photosynthesis rate in most sunflower genotypes, recorded maximum values at 15 o'clock, when the active radiation in photosynthesis reached a maximum of 1956 µmol/m2/s. The photosynthesis process in 2017 recorded a higher value from 9 o'clock, which was maintained at high intensity and at 12 o'clock. Beginning at 15 o'clock, although the temperature was optimal for photosynthesis (32.1 oC), the reduced amount of photosynthetic radiation with an average value of 402 µmol/m2/s significantly reduced photosynthetic yield. Sunflower plants grown in the sandy soil area, they lose large amounts of water in the form of vapor through sweat, the largest amount being eliminated in the ambient air by stomata. Compared to other species grown on sands, sunflower the number of stomata is much larger, with only one leaf having about 13 million stomates (depending on the variety / hybrid cultivated). In the blooming phenophase (Figure 2) the foliar sweating rate exhibited a diurnal variation under the influence of the hybrids studied and the climatic conditions of the year, such as the intensity of light, wavelength of light radiation, water supply status of the leaves, relative air humidity, air temperature. At 9 o'clock, at a leaf temperature of 26.6-34.10C, foliar sweating was minimal throughout the day, with values between 1.83-5.23 mmol H2O / m2 / s (Year 2016) and 2.53-6.71 mmol H2O / m2 / s (Year 2017). At 12 o'clock,
the action of the environmental factors on the plants was maximum.
The temperature at the leaf level, with a maximum of 36.3-37.3 ° C, the high amount of light radiation, the relative humidity of the low air (only 35.3%), amid a good supply of soil water (through irrigation) determined the intensification of foliar sweating in all studied
hybrids with 2.45-7.25 mmoli H2O/m2/s (Year 2016) and 2.56-9.49 mmoli H2O/m2/s (Year
2017). At 15 o'clock, the reduced amount of light radiation caused the photoactive shut-off of stomata with repercussions and foliar sweating. Its values were lower than at 12 o'clock. Statistical analysis, using mathematical functions, highlights positive, distinctly positive correlations between active radiation in photosynthesis and the rate of photosynthesis (Figure 3), between leaf surface temperature and foliar sweating rate (Fig. 4) as well as between sweat and photosynthesis plant (Figure 5). If we look at the results presented in this figure, we can see that there are sunflower hybrids, which, although they lose a significant amount of water through the sweat process, are effectively utilized by
intensifying the process of CO2 accumulation in the plant by photosynthesis. Thus, in the
year 2016, the hybrids FAVORIT, FDIL HS 15 M6, FDI 15 T12 A have been registered, with daily average values of the plant sweat of 4.16-5.39 mmol H2O / m2 / s and the rate of
photosynthesis of the plant of 22.98-25.47 μmol CO2 / m2 / s, and in the year 2017 the
hybrids are: 708/2017, 18e/2017, 26e/2017, 27e/2017, with daily average values of plant sweat of 5.9-6.48 mmol H2O / m2/s and plant photosynthesis rate of 27.95-32.4 μmol CO2 /
140
Figure 1. The diurnal variation of the photosynthetic process recorded in the sunflower genotype assortment in the flowering phase of the plant
Figure 2. The diurnal variation of the foliar sweating process
registered in the range of sunflower genotypes in the flowering phase of the plant
0 10 20 30 40 50 F 7 0 8 FAV O R IT PE R FO R M ER FD IL H S 1 5 M 6 FD I 1 5 T 5 A FD I 1 5 T 3 A FD IL H S 1 5 M 1 0 FD I 1 5 T 2 A 2 FD SL H C 1 5 M 5 FD I 1 5 T 1 2 A SU M AMA 2 C H SU 10 A T7 A1 T1 1 A V L IM
I - M
1
V
L
IM
I - M
5 4 9 D 2 5 D 5 5 D 5 2 D 2 2
D 1 D
4 8 D 4 6 D 2 3 D 3 7 D 3 6 D 1 9 D 2 0 D 2 1 D 1 5
D 4 D
1 0 D 3 2 D 1 7 D 3 1 D 3 0 D 7 0 8 /2 0 1 7 1 e /2 0 1 7 2 e /2 0 1 7 3 e /2 0 1 7 4 e /2 0 1 7 5 e /2 0 1 7 6 e /2 0 1 7 7 e /2 0 1 7 8 e /2 0 1 7 9 e /2 0 1 7 1 0 e /2 0 1 7 1 1 e /2 0 1 7 1 2 e /2 0 1 7 1 3 e /2 0 1 7 1 4 e /2 0 1 7 1 5 e /2 0 1 7 1 6 e /2 0 1 7 1 7 e /2 0 1 7 1 8 e /2 0 1 7 1 9 e /2 0 1 7 2 0 e /2 0 1 7 2 1 e /2 0 1 7 2 2 e /2 0 1 7 2 3 e /2 0 1 7 2 4 e /2 0 1 7 2 5 e /2 0 1 7 2 6 e /2 0 1 7 2 7 e /2 0 1 7
2016, Dabuleni 2017, Dabuleni
P h o to sy n th e si s rate (μ m o l C O2/m 2/s)
9 o'clock 12 o'clock 15 o'clock
0 2 4 6 8 10 F 7 0 8 FA VO R IT PE R FO R M ER FD IL H S 1 5 M 6 FD I 1 5 T 5 A FD I 1 5 T 3 A FD IL H S 1 5 M 1 0 FD I 1 5 T 2 A 2 FD SL H C 1 5 M 5 FD I 1 5 T 1 2 A SU M A M A 2 CH SU 1 0 A T7 A 1 T1 1 A VL I M I M 1 VL I M I M 5 4 9 D 2 5 D 5 5 D 5 2 D 2 2
D 1 D
4 8 D 4 6 D 2 3 D 3 7 D 3 6 D 1 9 D 2 0 D 2 1 D 1 5
D 4 D
1 0 D 3 2 D 1 7 D 3 1 D 3 0 D 7 08 /2 0 1 7 1 e/ 2 0 1 7 2 e/ 2 0 1 7 3 e/ 2 0 1 7 4 e/ 2 0 1 7 5 e/ 2 0 1 7 6 e/ 2 0 1 7 7 e/ 2 0 1 7 8 e/ 2 0 1 7 9 e/ 2 0 1 7 1 0 e/ 20 1 7 1 1 e/ 20 1 7 1 2 e/ 20 1 7 1 3 e/ 20 1 7 1 4 e/ 20 1 7 1 5 e/ 20 1 7 1 6 e/ 20 1 7 1 7 e/ 20 1 7 1 8 e/ 20 1 7 1 9 e/ 20 1 7 2 0 e/ 20 1 7 2 1 e/ 20 1 7 2 2 e/ 20 1 7 2 3 e/ 20 1 7 2 4 e/ 20 1 7 2 5 e/ 20 1 7 2 6 e/ 20 1 7 2 7 e/ 20 1 7
2016, Dabuleni 2017, Dabuleni
Fo liar swe at rate ( H 2O/m 2/s)
Analele Universităţii din Craiova, seria Agricultură – Montanologie – Cadastru (Annals of the University of Craiova - Agriculture, Montanology, Cadastre Series) Vol. XLVII 2017
141
Figure 3. The correlation between active radiation in photosynthesis and the rate of plant photosynthesis in some sunflower genotypes (2016)
Figure 4. The correlation between leaf temperature and foliar sweating rate in some sunflower genotypes (2016)
y = -1E-06x2 + 0,0112x + 5,6123 r = 0,412**
0 5 10 15 20 25 30 35 40
0 500 1000 1500 2000 2500
P
h
o
to
sy
n
th
e
si
s
rate
(μ
m
o
l C
O2/m
2/s)
Active radiation in photosynthesis (µmol/m2/s)
Series1 Poly. (Series1)
y = 9,8146ln(x) - 30,065 r = 0,769**
0 1 2 3 4 5 6 7 8
20 25 30 35 40 45
R
ate
o
f fol
iar
sw
e
ating
(m
m
o
l
H2
O/m
2/s
)
Temperature at the surface of the leaf (o C)
142
Figure 5 . The correlation between plant sweat and photosynthesis rate recorded in sunflower genotypes in sandy soil conditions
Figure 6. Production results obtained from sunflower hybrids tested under sandy conditions during the period 2016-2017
The production results obtained in the 109 sunflower genotypes (Figure 6), show for the year 2016 an average production of 4680 kg / ha with variation limits in the range of 3580-5180 kg / ha and in 2017 an average of 3933 kg / ha with variation limits between 2999-4424 kg / ha. In 2016, it is evidenced a number of nine genotypes by production increases, statistically assured, compared to the average of genotypes (FDI 15 T12 A, 23 D, 38 D, 39 D, 6 D, 14 D, 24 D, 20 D, 15 D) and within the tested biological material, eight genotypes have produced significantly lower yields than the average of 4680 kg / ha. In 2017, the production was less by about 26% compared to 2016, and among the experimental genotypes, six showed statistically negative production differences compared to the tested biological material and the rest recorded production differences plus or minus, but insignificant to the average. This year, it was highlighted by differences in production over the average, the following genotypes: 16 e / 2017, 17 e / 2017, 19 e /
y = 0,9002x2 - 5,7382x + 26,462 r = 0,466**
0 5 10 15 20 25 30 35
1 1.5 2 2.5 3 3.5 4 4.5 5 5.5 6 6.5 7 7.5 8
P
hot
os
ynt
he
si
s
rat
e
(μ
m
ol
C
O
2/
m
2/
s)
Foliar sweat rate (H2O/m2/s Series1 Poly. (Series1)
10 20 30 40 50 60 70
2500 3000 3500 4000 4500 5000 5500 6000
1 3 5 7 9 11 13 15 17 19 21 23 25 27 29 31 33 35 37 39 41 43 45 47 49 51 53 55 57 59
Fat
co
n
te
n
t
(%
)
Se
e
d
p
ro
d
u
ction
(k
g/
h
a)
Sunflower genotypes
"Seed production (kg / ha) / 60 sunflower genotypes tested in 2016 (average=4680 kg/ha; maximum=5180 kg/ha; minimum= 3580 kg/ha; LSD 5%=276 kg/ha
Seed production (kg / ha) / 49 sunflower genotypes tested in 2017 (average=3933 kg/ha; maximum=4424 kg/ha; minimum= 2999 kg/ha; LSD 5%=548 kg/ha)
Average production of sunflower genotypes, in 2016
Average production of sunflower genotypes, in 2017
Analele Universităţii din Craiova, seria Agricultură – Montanologie – Cadastru (Annals of the University of Craiova - Agriculture, Montanology, Cadastre Series) Vol. XLVII 2017
143
2017, 23 e / 2017, 24 e / 2017, 25 e / 2017, 37 e / 2017, 38 e / 2017 , 44 e / 2017, 45 e / 2017. The climatic conditions of 2017, with many consecutive days with temperatures above 400C, during the blooming-seeded period, led to a significant absence of production potential in the 49 sunflower cultivation. The average of all sunflower genotypes tested in the two years was 4307 kg / ha. In terms of seed quality, the fat content determined in the year 2017 varied according to the genotype in the range 51.1-57.7%, with an average of genotypes of 56.67% most of them (65%) exceeding the average.
CONCLUSIONS
1. The climatic conditions in the area of sandy soils in southern Oltenia are favorable for the growth and development of the sunflower culture.
2. Significantly positive correlations were found between the plant photosynthesis rate and the active radiation in photosynthesis (r = 0.282 **), as well as between foliar sweating rate and leaf surface temperature (0.412 **).
3. In 2016, the hybrids: FAVORIT, FDIL HS 15 M6, FDI 15 T12 A, which recorded daily average values of the plant sweat of 4.16-5.39 mmol H2O / m2 / s and of rate
of plant photosynthesis of 22.98-25.47 μmol CO2 / m2 / s, and in 2017, genotypes
708/2017, 18e / 2017, 26e / 2017, 27e / 2017 were noted with average daily sweating of the plant of 5.9-6.48 mmoles H2O / m2 / s and plant photosynthesis rate
of 27.95-32.4 μmol CO2 / m2 / s.
4. The production was differentiated according to the genotype and climatic conditions of the agricultural year, ranging from 2299-5180 kg / ha, with an average of 4307 kg / ha.
5. Fat content ranged from genotype 51.1-57.7%, with an average of 56.67%, most of them (65%) exceeding the average fat percentage.
BIBLIOGRAPHY
1. Hammes, P.S. 1990, Net photosynthetic rate of potato hgh temperature. Journal
potato, Research,vol.33, 515-520.
2. Lawlor D. W.1995.The efects of water deficit on photosynthesis. Enviroment and
plant metabolism.Oxford, Bios Scientific Publishers,19-160.
3. Maria Păcureanu-Joiţa, Alexandru Viorel Vrânceanu, Danil Stanciu, 2007. Fifty
years of activity in amelioration of sunflower at Fundulea, Anale. N.A.R.D.I. FUNDULEA, VOL. LXXV, 2007, JUBILIAR VOLUME
4. Marinică Gh., Dascălu D., 1984 - Water consumption and the sunflower irrigation
regime on the sands improved in southern Oltenia. Scientific Papers.SCCCPN Dăbuleni, vol. VI.
5. Merrien A.,1992. Some aspects of sunflower crop physiology.Conference
Pisa,Italy,I,481-498.
6. R. Amutha, S. Muthulaksmi, W. Baby Rani, K. Indira and P. Mareeswari, 2007.
Physiological Studies on Evaluation of Sunflower (Helianthus annus L.) Genotypes for High Temperature Stress. Research Journal of Agriculture and Biological Sciences, 3(4): 245-251, 2007. ISSN (printed): 1816-1561. ISSN (electronic): 1819-5415
7. Sage, R.F. & Kubien, D.S. 2007. The temperature response of C3 and C4
photosynthesis. Plant. Cell and Environment 30: 1086
8. Salisburi,F.B .Ross,1991.Plant Physiology. Belmont, California