APPLICATION OF A LATTICE GAS MODEL FOR SUBPIXEL
PROCESSING OF LOW-RESOLUTION IMAGES OF BINARY
STRUCTURES
Z
BISŁAWT
ABORDepartment of Image Analysis, Institute of Applied Computer Science, Cracow University of Technology, Al. Jana Pawła II 37, 31-864 Cracow, Poland
e-mail: [email protected]
(Accepted October 17, 2006)
ABSTRACT
In the study an algorithm based on a lattice gas model is proposed as a tool for enhancing quality of low-resolution images of binary structures. Analyzed low-low-resolution gray-level images are replaced with binary images, in which pixel size is decreased. The intensity in the pixels of these new images is determined by corresponding gray-level intensities in the original low-resolution images. Then the white phase pixels in the binary images are assumed to be particles interacting with one another, interacting with properly defined external field and allowed to diffuse. The evolution is driven towards a state with maximal energy by Metropolis algorithm. This state is used to estimate the imaged object. The performance of the proposed algorithm and local and global thresholding methods are compared.
Keywords: image processing, Ising model, trabecular bone.
INTRODUCTION
For the most common types of image acquisition devices, pixels of an acquired image represent an averaging of the signal across a finite area of the scene or specimen. If the imaged object is a binary structure (i.e., structure built of two distinct phases), image pixels, which straddle a boundary between two phases average their brightness and have an intermediate intensity, depending on the fraction of both phases contained in a pixel.
Frequently the resolution of an acquired image is not sufficient to extract all interesting features of the object. In such a case super-resolution algorithms (Park et al., 2003) can be applied to enhance the resolution. It is crucial, that the super-resolution algorithms require at input multiple low-resolution images, which differ from one another because of the object movement or exposition conditions. The number of scenes on which any super-resolution algorithm operates depends on the size of the smallest feature, which has to be extracted.
The central problem of any algorithm enhancing resolution of the images of binary structures is, how the interface between two phases should be drawn across the relatively large in size pixels of the acquired image. In this paper it is demonstrated that a lattice gas model can be a useful tool to address the
above formulated problem. The proposed method requires one low-resolution input image to produce its enhanced (in a sense of decreased pixel size) representation. Strictly speaking, super-resolution can not be achieved with the developed algorithm under arbitrary conditions, because the information contained in the enhanced image is the same as in the acquired one. However, if the phase interface can be described by a suitably low-dimensional family of functions, improvement of the quality of the low-resolution data can be achieved by suitable subpixel processing, which however is not superresolution restoration in a strict sense (no subpixel features exist if all information is already present in the low-resolution image).
PROBLEM FORMULATION
L
G
N
(int)
p
,IJ2 1 N 0 j ,i j J ,i I
⋅
=
∑
− = + + , (1)where GI,J is the gray level intensity of the (I,J)-th
pixel of the low-resolution image and M2·N2
unknown pI+i,J+j are the 0 or 1 values attributed to the
(I+i,J+j)-th pixel of the restored image.
All information contained in the acquired image is used to write Eq. 1. To enable the solution, prior assumptions are necessary. In particular, if it is assumed that phase interface of the object can be parameterised by suitably low-dimensional family of functions (the phase interface is sufficiently smooth), then super-resolution could be achieved. More formally, the number K of parameters, describing phase interface must be less than M2. If K >> M2 superresolution is
not possible.
Indeed, assume that a phase interface within a pixel of a low-resolution image can be represented by a straight line. Then, for any selected slope of the straight line segment, intercept can be calculated from Eq. 1, which determines the fraction of white and black phases within a pixel of a low-resolution image. The slope can be determined from the demand that the phase interface at the border of neighbouring pixels is continuous. In such a case Eq. 1, together with the assumption about simplicity of the phase interface deliver sufficient information to reproduce an object. Having specified some data set, the validity of the above assumption must be tested by suitable comparison of known objects and their restored images. Here I present an algorithm for subpixel processing of images of binary structures. The assumption about smoothness of the phase interface is not necessary for the algorithm to work. Conversely, satisfactory performance of the algorithm suggests that this assumption is fulfilled at least approximately.
As an example of a binary structure, trabecular bone is considered in the present study. Trabecular bone is especially interesting porous material, because it develops under the control of a living organism (Tabor et al., 2002), it is highly optimized, comparing its strength to its density and adapts to varied load conditions (Huiskes et al., 2000).
al., 1998), while only low-resolution images of trabecular bone are clinically available (pixel size of the order of 150 µm), because on the limitation on applied dose of X-rays and acquisition time.
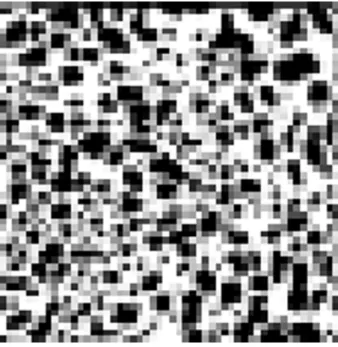
Fig. 2. A low-resolution image of the structure shown in Fig. 1 (300 µm pixel size). The range of grey levels present in the image is due to the partial volume effect.
IMAGE RECONSTRUCTION
Pixel subdivision and ridge images
The final goal of a resolution enhancement algorithm is to draw the phase interface across the interior of the pixels of the LR images. At the first stage of the algorithm, the first guesses of the restored images are created. For this purpose each pixel of a LR image is replaced by an N × N matrix, N2·G/L elements of which are set to 1 and the rest to
0 (where G is the grey level of the replaced pixel). In Fig. 3 a 10 × 10 matrix replacement of a part of the structure shown in Fig. 2 is shown.
To find the ridges of the white phase, a bicubic interpolation M·NxM·N image is obtained from each corresponding LR image. Then the ridge detection procedure (Ross, 1994; Elmoutaouakkil et al., 2002) is applied to the interpolated images. In Fig. 4 a bicubic interpolation image of the image shown in Fig. 1 is depicted, together with the white phase ridges.
Fig. 3. A first guess particle model binary image - the result of transformation of a part of the image depicted in Fig. 2 (30 µm pixel size).
Lattice gas model
The following method is introduced to assign black and white labels to the pixels of enhanced image. The assumption about smoothness of the phase interface leads to a model, according to which each white pixel of the first guess image is identified with a particle allowed to diffuse inside the N × N matrix, to which the pixel belongs. It is further assumed that the particles interact with one another. The interaction is chosen to be Ising-like. Besides self-interaction, particles interact also with an external field. This interaction is defined as attraction to the ridges of the white phase. Thus the energy of the system is defined as follows:
∑
∑
⋅ −αα =
>
<,ij i j 2 i i 1 w w d(w )
E , (2)
where α1 and α2 are some parameters, wi is set to 1
for white pixels and 0 for black pixels. The second term of the energy (2) is responsible for aligning the phase interface along the white phase ridges, i.e., it specifies locally the slope of the phase interface. The first term ensures that the phase interface is smooth.
I have found it experimentally, that for N = 10 two-pixel range of the self-interaction is an optimal choice. d(wi) denotes the distance of wi from the
nearest ridge. The distance field was computed only once, at the beginning of the simulation, using the digital distance transform (Ross, 1994).
The diffusion is driven by standard Metropolis algorithm towards a state with maximal energy. I choose α2 a few times larger than α1 (e.g.α1 = 2, α2 =
15) and thus there is much higher penalty for increasing the distance from the ridge, than for decreasing the number of neighbors. Thus I can split the maximization procedure in two parts. First, I maximize the distance part of the energy with the self-interaction term turned-off (α1 = 0). Typically a
few dozens of iterations (a single iteration consisting of attempts to change the state of each particle) are necessary to complete this step. Then to make phase interface smooth I maximize the self-interaction term, with the distance term turned-off, but now I allow the particles to move in more broad boxes (not larger
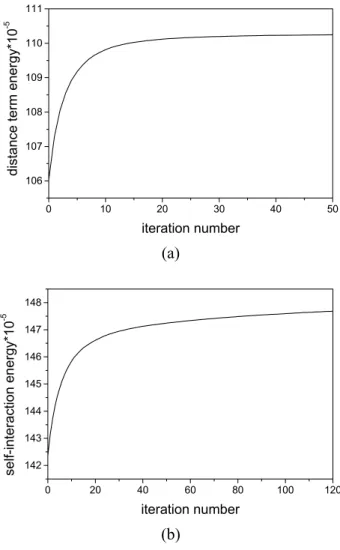
pixels. The values of the distance term energy, obtained during reconstruction of the structure shown in Fig. 1 are plotted vs. the iteration number in Fig. 5a. The values of the self-interaction term energy, obtained for the same structure are plotted vs. the iteration number in Fig. 5b.
0 10 20 30 40 50 106 107 108 109 110 111 dista nce ter m ener g y*10 -5 iteration number (a)
0 20 40 60 80 100 120 142 143 144 145 146 147 148 sel f-i nterac tion e nerg y* 10 -5 iteration number (b)
Fig. 5. The evidence of the convergence of the distance term energy (a) and self-interaction term energy (b), during the maximization procedure.
Pruning
Fig. 6. A binary image (30 µm pixel size), which is the results of maximization of the energy defined in Eq. 2 can contain isolated clusters of white or black pixels (especially in the presence of noise).
Fig. 7. A binary images after pruning operation (30
µm pixel size) is the final reconstruction of the original image, depicted in Fig. 1. The reconstruction, based on the novel algorithm, uses only the data present in Fig. 2.
PERFORMANCE
The performance of the introduced algorithm was compared with standard thresholding techniques applied to:
1. Globally thresholded bicubic interpolation images: in this case the threshold value is set to achieve the fraction BV/TV of white pixels of the thresholded image equal to the BV/TV of the original image (Fig. 8).
2. Locally thresholded bicubic interpolation images: in this case the threshold is set locally in n × n matrices of pixels to achieve local BV/TV (i.e., BV/TV evaluated for nxn matrix of pixels) of the thresholded image equal to the corresponding local BV/TV of the original image. n in the range from 10 to 50 was used in the calculations (n = 50 shown in Fig. 9).
Fig. 9. A binary image (30 µm pixel size), which is the result of local thresholding of the image depicted in Fig. 4. The threshold value is set locally in 50 × 50 matrix of pixels to achieve local BV/TV of the thresholded image equal to the corresponding local BV/TV of the image depicted in Fig. 1.
Following quantities were used to test the performance of the introduced algorithm vs. the performance of standard thresholding procedures: 1. Mean pore area P.Ar.
2. Euler number density E.N.
3. Mean thickness of white phase Wh.Th. 4. Mean thickness of black phase B.Th.
5. The badly reconstructed area – the half of the number of white pixels of the image being the difference between the original image and the reconstructed image, related to the number of white pixels of the original image. The pixel of a difference image is white if pixels of subtracted binary images are different and it is black otherwise. 6. Mean area of bad clusters: a badly reconstructed pixel is any pixels of the reconstructed image, which is white, while the corresponding pixel of the original image is black. Badly reconstructed pixels are grouped in clusters. The reconstruction errors are smaller if the mean area of bad clusters is lower.
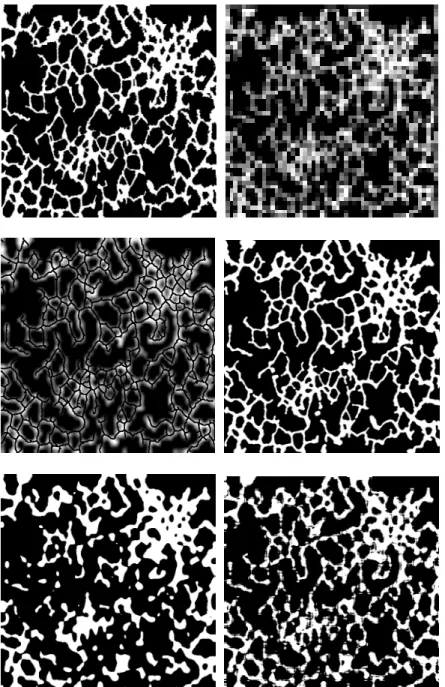
The results of comparison (mean value, standard error) are summarized in Table 1. The introduced method allows quantifying the reconstructed structure with errors smaller than thresholding techniques. This is true for both structural parameters (P.Ar, E.N, Wh.Th and B.Th) and measures of badly reconstructed area. The advantages of the presented algorithm are especially noticeable in the cases, when porous structure with low thickness of the white phase has to be restored from a low-resolution image. An example is presented in Fig. 10. The badly reconstructed area is equal to 5%, 21% and 19% for lattice gas model, global and local thresholding, respectively. The main drawback of the thresholding method is that they do not recover the connectivity of the original structure. The Euler number of the original structure is equal to -126. The Euler number for lattice gas model, global and local thresholding is equal to -108, 26 and 90, respectively.
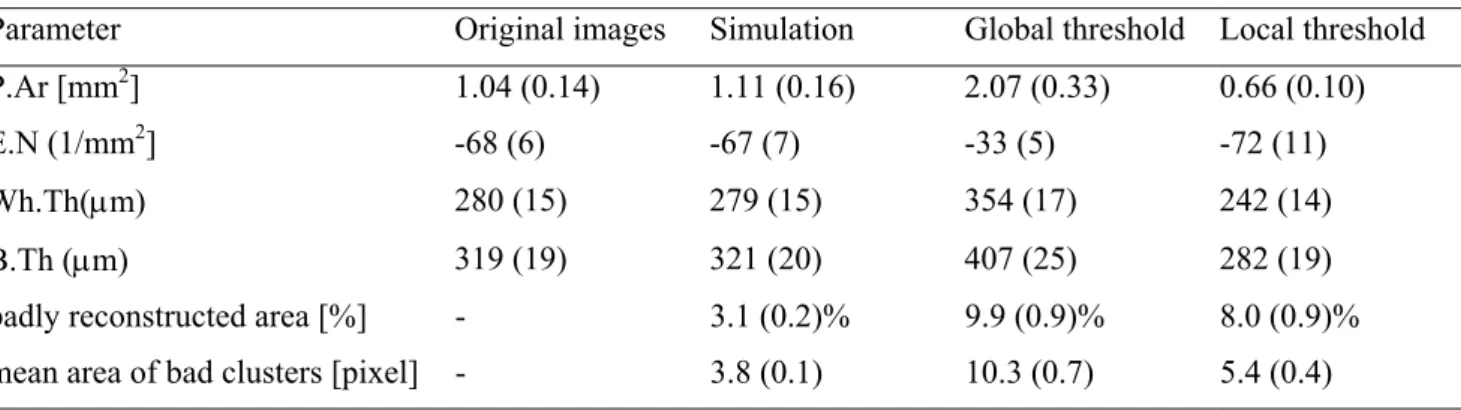
Table 1.The comparison of the performance of the novel algorithm vs. threshold techniques.
Parameter Original images Simulation Global threshold Local threshold
P.Ar [mm2] 1.04 (0.14) 1.11 (0.16) 2.07 (0.33) 0.66 (0.10)
E.N (1/mm2] -68 (6) -67 (7) -33 (5) -72 (11)
Fig. 10. A high- (top-left) and low-resolution (top-right) image of a low-thickness structure, its ridges (middle-left), lattice gas model (middle-right), global (bottom-left) and local (bottom-right ) thresholding restoration.
DISCUSSION
There are at least two reasons, why thresholding methods lead to relatively poor results. The first reason is significant variation of the thickness of the white phase (trabeculae) over the analyzed field of view. Generally, thick trabeculae are properly recognized as white phase. With decreasing trabcular thickness it becomes more problematic to properly recognize trabeculae. This is clearly seen from the results of the measurement of the Euler number. Small value of E.N for global threshold is just the
result of the described process. In the case of the local threshold, E.N is close to E.N of the original sections but it is due to the existence of small loops – artifacts of the local threshold method – which compensate the lack of trabeculae. Thresholding methods lose trabeculae, because they do not “feel” the presence of trabecular ridges, what is the second reason, why these methods produce large restoration errors. Exactly for this reason the distance term in the energy (Eq. 2) is set much more important, by appropriate choice of the parameters α1 and α2. Diffusion with
The results presented above were obtained for idealized case of no noise imposed on the low-resolution data. Extensive calculation were also performed for the case of Gaussian noise added to the low-resolution data (signal-to-noise ratio from 30 to 40 dB). In this case reasonable restoration of an object was possible if the input low-resolution images of the objects were an average over multiple (typically not more than two dozens) low-resolution noisy expositions.
From the comparison of the object and restored images (e.g. Fig. 10, Fig. 1 and Fig. 7) it is evident that super-resolution was not achieved with the proposed method (i.e., certainly the number of parameters parameterizing phase interface is larger than the number of pixels in the low-resolution image). Indeed, there are fine features, present in the object images but not reconstructed. Badly reconstructed area, although relatively small, is nonzero. The increase of quality, comparing to thresholding methods, was however achieved with the number of unknowns 100 times larger (N = 10) than the number of equations.
REFERENCES
Elmoutaouakkil A, Peyrin F, Elkafi J, Laval-Jeantet AM (2002). Segmentation of cancellous bone from high-resolution computed tomography images: influence on trabecular bone measurements. IEEE Trans Med Imaging 21:354-62.
Huiskes R, Ruimerman R, van Lenthe GH, Janssen GH (2000). Effects of mechanical forces on maintenance of form in trabecular bone. Nature 405:704-6.
Müller R, Koller B, Hildebrand T, Laib A, Gianolini S, Rüesegger P (1996). Resolution dependency of micro-structural properties of cancellous bone based of three-dimensional µ-tomography. Technol Health Care 4: 113-9.
Park CP, Park MK, Kang MG (2003). Super-resolution image reconstruction: a technical overview. IEEE Signal Processing Magazine, May 2003:21-36. Ross JC (1994). The Image Proccesing Handbook. Boca
Raton: CRC Press.
Tabor Z, Rokita E (2000). Comparison of trabecular bone architecture in young and old bones. Med Phys 27: 1165-73.
Tabor Z, Rokita E, Cichocki T (2002). Origin of the pattern of trabecular bone: an experiment and a model. Phys Rev E 66:051906.
Ulrich D, van Rietbergen B, Weinans H, Rüegsegger P (1998). Finite element analysis of trabecular bone structure: a comparison of image based meshing techniques. J Biomech 31:1187-92.