Precision and Accuracy of Thyroid Dysfunction Questionnaire
(TDQ) for Hyperthyroidism Screening in Childbearing Age Women
Mutalazimah1), Budi Mulyono2), Bhisma Murti3), Saifuddin Azwar4)
1)Department of Nutritional, Muhammadiyah University of Surakarta 2)Department of Clinical Pathology, DR. Sardjito Hospital 3)Masters Program of Public Health, Sebelas Maret University 4)Faculty of Psychology, Gajah Mada University of Yogyakarta
ABSTRACT
Background: Community-based case finding efforts of hyperthyroidism rather not to do, but constrained because accurate markers measurements using hormones. TDQ as a screening in-strument which meets several criteria diagnostic tests, provide more convenience for the patient, cheaper, easier and simpler. This study aimed to determine the precision and accuracy of diagnostic test of hyperthyroidism screening in childbearing age women.
Subjects and Method: The study was a diagnostic study with cross sectional design. It conducted in Prambanan, Sleman, Yogyakarta. The sample consisted of 112 randomly selected of childbearing age women.Clinical symptoms of hyperthyroidism were measured using the TDQ, thyroid status measured by thyroid stimulating hormone (TSH) and free thyroxin (FT4). TDQ diagnostic precision and accuracy were tested using the percent agreement (PA), Kappa coefficient, sensitivity (Se), specificity (Sp), LR (+), LR (-), Youden’s index, the area under the curve (AUC) in the receiver operating curve (ROC) and diagnostic odds ratio (DOR).
Results: The best value in diagnostic precision is TDQ score with cutoff point score of 40, with PA 81.2 % and Kappa coefficient 0.62. Similarly, the best accuracy value Se 90%, Sp 76%, LR(+) 3.75, LR(-) 0.13, Youden’s index 0.66, AUC 0.831 and DOR 28.8.
Conclusion: The values and the optimal accuracy obtained from the best score of 40 and this cut off point of the score is sufficient to be used as a threshold determination of a diagnosis of hyperthyroidism by TDQ scores.
Keywords: diagnostic tests, thyroid dysfunction questionnaire (TDQ), hyperthyroidism, child-bearing age women.
Correspondence:
Mutalazimah. Department of Nutritional, Muhammadiyah University of Surakarta
BACKGROUND
A region with characteristics that cause a reduction in the iodine content in the soil is referred to as iodine deficiency endemic area (Black, 2003; Djokomoeljanto 2008; Bayram et al., 2009). Prambanan, Sleman is endemic, based on measurements of thyroid goitre rate (TGR) in 2003 was found to be 35.8%. The endemic areas, causing risk of iodine deficiency in all age groups, ranging from fetal, neonatal, children, adolescents, adults and the elderly. The impacts of iodine deficiency include a very wide spectrum,
such as: abortion, stillbirth, congenital de-fects, perinatal mortality, infant mortality, cretin,goiter, hypothyroidism, decreased IQ, impaired mental function, impaired muscle function, growth retardation and iodine-induced hyperthyroidism or Iih (Dillon and Milliez, 2000; Verma and Raghuvanshi, 2001; Sebotsa et al., 2009).
and supplementation yodiol within a rela-tively long period (Fountoulakis et al., 2007; Burgi, 2010; Henjum et al., 2010). No dif-ferent from iodine deficiency, excess iodine is also risk to health, such as lead thy-roiditis, hyperthyroidism, hypothyroidism, goiter (Henjum et al., 2010) and the various impacts with various manifestations, such as increased pulse rate, weight loss, exces-sive sweating and tremor.
Several studies have found, the case of excess iodine in endemic areas, such as Al-sayed et al., (2008) found 54.8% of women in Egypt, suffered excess iodine and correlated with subclinical hypothyroid con-dition. Mutalazimah and Asyanti (2010), urinary iodine measurement of primary school students, in Cangkringan, Sleman, showed iodine excess of 10%. Henjum et al., (2010) showed a very extreme, ie, finding 84% of school children in endemic areas Saharawi experiencing excess iodine. Muta-lazimah (2013) found cases of subclinical hyperthyroidism, in women of reproductive age in endemic areas of iodine deficiency by 26%. This study supported by Hermann et al., (2004) and Lamfon (2008) about the existence of subclinical hyperthyroidism, which is marked by the tendency of decrease in serum thyroid stimulating hormone (TSH), on the subject in endemic areas of iodine deficiency.
Various problems related to iodine and thyroid in adult groups, occur 4-10 times more often in women than men, especially during the reproductive age (Stri-eder et al., 2003; Gonen et al., 2004; Fountoulakis et al., 2007; Lamfon, 2008; Watt, 2009). Based on the data that women are more susceptible to disruption of thy-roid function, so it is recommended to per-form screening in women on a regular basis, especially those aged over 35 years, even the
younger the better to prepare for pregnancy (Glinoer, 2008; Stockigt, 2010).
In Indonesia, screening measurement using of urinary iodine, TSH and FT4, felt very expensive. There is a shortage of screening methods thyroid dysfunction by measurement of SE, led to the discovery of a case to be less accurate, since SE cannot dis-tinguish between hypothyroidism and hy-perthyroidism. Thus are blurring the inter-vention measures preinter-vention of iodine de-ficiency as a cause of hypothyroidism and hyperthyroidism. Comprehensive the ins-truments screening reveals more detail and specific the symptom with thyroid disorder. The instruments are developed through ela-boration of other symptoms in addition to SE.
Several studies on the association of thyroid disorders and symptoms such bio- psychosocial, strengthen the basis for re-searchers to develop a questionnaire called the TDQ, aims to be an alternative measure-ment tool for screening for thyroid disorders including hypothyroidism in women of child bearing age. TDQ developed through a se-ries of instrument construction process, from the identification of items, expert jus-tification, content validity testing, to test the validity and reliability. As a screening ins-trument, TDQ must qualify, not only more comprehensive and proven reliability, but also must meet several criteria for diagnos-tic tests, ie the value of the diagnosdiagnos-tic is not much different from diagnostic testing stan-dards, provide more convenience for the patient, easier and simpler (user friendly), cheaper, and can diagnose in the early phase (Sastroasmoro and Ishmael, 2011; Knott-nerus, 2002; Dopson and Fitzgerald, 2006; Mc.Dowell, 2006; Mayer, 2010).
question-naire for the screening, is the first step in an effort to further diagnosis. Thus, this study aims to perform diagnostic tests TDQ, which includes the values of precision and accuracy through analysis of percent agree-ment (PA), the coefficient of Kappa, Se, Sp, LR (+), LR (-), the index Youden, AUC on the curve ROC and DOR.
SUBJECTS AND METHOD
This was a diagnostic study with cross sec-tional design. Population were all women aged 18-45 years in endemic areas of iodine deficiency, while the source population is women aged 18-45 years living in Gayam-harjo, Wukirharjo and SumberGayam-harjo, Pram-banan, at 2,760 Childbearing age women.
Application of sample size calculation method, had the formula for the case of the population, and obtained 112 WUS subject, taken at random by simple random samp-ling technique. Scores obtained using TDQ hyperthyroidism through interviews and examination of signs and symptoms of the
subject, with the range of scores ranging from 0 - 158.
As the gold standard, measurement of TSH and FT4 by trained analysts bioche-mistry and analyzed in the laboratory de-partment of clinical pathology Dr. Sardjito. Hyperthyroidism interpreted if TSH <0.4 μU/ l, or FT4 levels> 2.1 ng / dl.
Analysis of diagnostic tests was using analytical precision with percent agreement (PA) and the Kappa coefficient, and analysis accuracy with Se, Sp, LR (+), LR (-), Youden index, the AUC ROC curve and BANG.
RESULTS
Measurement of TSH and FT4 showed that subjects with hyperthyroidism by 31 (27.7%) and normotiroid by 81 (72.3%). TDQ score for hyperthyroidism, are in the range 8-113, to interpret the threshold scores are used determine the indication subject suffering from hyperthyroidism, then do exploration on several scores of hyperthyroidism, using a threshold score of 20, 30, 40, 50, 60 and 70.
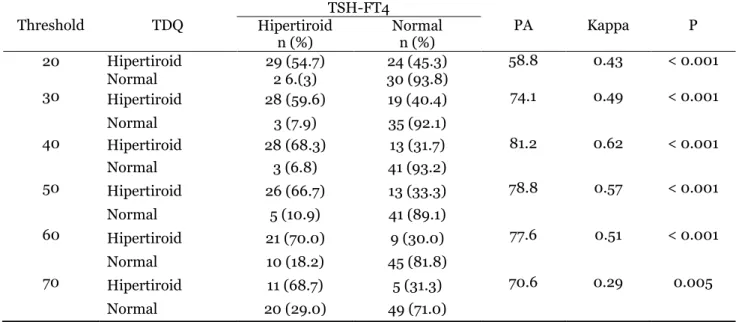
Table 1. Correlation test TDS-FT4 and TSH on the subject of hyperthyroidism
Threshold TDQ Hipertiroid TSH-FT4 PA Kappa P n (%) Normal n (%)
20 Hipertiroid 29 (54.7) 24 (45.3) 58.8 0.43 < 0.001 Normal 2 6.(3) 30 (93.8)
30 Hipertiroid 28 (59.6) 19 (40.4) 74.1 0.49 < 0.001 Normal 3 (7.9) 35 (92.1)
40 Hipertiroid 28 (68.3) 13 (31.7) 81.2 0.62 < 0.001 Normal 3 (6.8) 41 (93.2)
50 Hipertiroid 26 (66.7) 13 (33.3) 78.8 0.57 < 0.001 Normal 5 (10.9) 41 (89.1)
60 Hipertiroid 21 (70.0) 9 (30.0) 77.6 0.51 < 0.001 Normal 10 (18.2) 45 (81.8)
70 Hipertiroid 11 (68.7) 5 (31.3) 70.6 0.29 0.005 Normal 20 (29.0) 49 (71.0)
Furthermore, category thyroid status based on scores TDQ and categories of thy-roid status by TSH-FT4 at each threshold
hyperthy-roidism between TDQ and TSH-FT4 through value PA and the Kappa coefficient, and correlation analysis using chi square (Table 1). In addition to the values of pre-cision, table 2x2 is also used as the basis for calculating the values of diagnostic accuracy that includes Se, Sp, LR (+), LR (-), the in-dex Youden, AUC in the ROC curve and BANG, the summary results of the analysis can be seen in Table 2.
Table 1 seen agreement between TDQ and TSH-FT4 in determining thyroid status of the subject, which measured by the value
of pa, varied range between 58.8 to 81.2%; while the Kappa coefficients ranged from 0.29 to 0.62. p value of the chi square test showed that all threshold score correlated between TDQ-FT4 and TSH (<0.05).
Table 1 also shows the comparison of the values of precision, the best value is on the threshold score TDQ 40, namely with PA 81.2% and Kappa coefficient of 0.62.
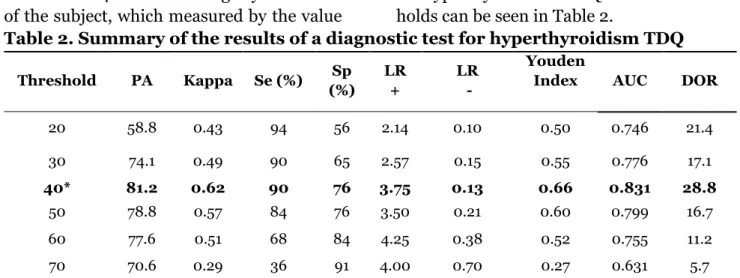
Summary results of the analysis of precision and accuracy of a diagnostic test for hyperthyroiddism TDQ at various thres-holds can be seen in Table 2.
Table 2. Summary of the results of a diagnostic test for hyperthyroidism TDQ
Threshold PA Kappa Se (%) Sp
(%)
LR +
LR -
Youden
Index AUC DOR
20 58.8 0.43 94 56 2.14 0.10 0.50 0.746 21.4
30 74.1 0.49 90 65 2.57 0.15 0.55 0.776 17.1
40* 81.2 0.62 90 76 3.75 0.13 0.66 0.831 28.8
50 78.8 0.57 84 76 3.50 0.21 0.60 0.799 16.7 60 77.6 0.51 68 84 4.25 0.38 0.52 0.755 11.2 70 70.6 0.29 36 91 4.00 0.70 0.27 0.631 5.7
Table 2 various indicators of precision and accuracy score of hyperthyroidism, which varies. There are quite accurate, there is also inaccurate. The use of various indicators in this study, is intended to get the value of the threshold score TDQ for hyperthyroidism, the most optimal namely score of 40. In addition to having Kappa coefficient value PA and the highest score of 40 also pro-duces value Se, Sp, LR (+), LR (-), Youden index, ROC curves and the AUC in the most optimal BANG ie 90% respectively; 76%; 3.75; 0.13; 0.66; 0.831 and 28.8.
DISCUSSION
A. Value PA and Kappa coefficient
Percent agreement also commonly referred to as an overall percent agreement. It ob-tained by dividing the number of
>40, the value becomes lower. Most thres-hold score TDQ, showed Kappa coefficients were classified as good and not found a very good category. Interpretation Kappa coeffi-cient on the diagnostic test of hyperthy-roidism is included in both categories with the highest value reached 0.62 on a thres-hold score of 40.
B. Sensitivity, specificity and Youden index
Sensitivity is the ability of measuring ins-trument to recognize a sore subject. The sensitivity and specificity of an indicator of the intensity a positive and negative test when applied to the subjects, both of which have unknown status or not (Davidson, 2002). According to the table 2x2, the for-mula calculate the accuracy of diagnostic test; sensitivity= a/(a+c) and specificity= d/(b+d). Sensitivity and specificity can also be correlated, of course, a negative correla-tion with the results, because if the increase-ed sensitivity, the specificity will decrease, and vice versa (Verhagen et al., 2008).
Sensitivity indicates the proportion of subjects with positives results, both on TDQ-FT4 and TSH measurements. Table 2., show the sensitivity of the diagnostic test of hyperthyroidism varies from 36-94%, in-crease were based on a threshold score de-creased. The specificity is the ability of a diagnostic test to determine that the subject does not hurt. That is, the specificity is the proportion of subjects with a negative re-sult, both TDQ-FT4 and TSH measurement.
Interval specificity in diagnostic tests for hyperthyroidism TDQ this, ranging from 56-91%, which increases with the increase in the threshold score. The highest sensitivity value of 94 was obtained at a threshold score of 20. When combined with speci-ficity, the sensitivity values are optimal with the specificity, obtained in the threshold score of 40. Youden index has a minimum
and maximum value from -1 to 1. A value of 1 represents the optimum value for an algorithm (Bohning et al., 2008). Thus, the Youden index, with the highest (0.66) obtained at the threshold score of 40. These results confirm that three indicators, the threshold, score of 40 selected optimal.
C. LR (+), LR (-) and DOR
LR calculation using the following formula, LR (+) = sensitivity / (1-specificity), LR (-) = (1-sensitivity)/ specificity (Davidson, 2002, Indra et al., 2004). LR shows that pre-test and posttest change probability, the interpretation as follows (Indra et al., 2004; Elavunkal and Sinert , 2009) LR (+)> 10 or LR (-) <0.1 produces changes very large (excellent); LR (+) between 5-10 and LR (-) between 0.1-0.2 produce big changes (very good); LR (+) between 2-5 and LR (-) between 0.5 to 0.2 generate moderate changes (fair), whereas LR (+) between 1-2 and LR (-) between 0.5-1 produce change small (useless).
function of screening hyperthyroidism, quite good.
D. AUC and ROC curves
The area under the ROC curve, or common-ly referred to as area under the curve (AUC), indicating the size of the overall perform-ance of a diagnostic test. The bigger ROC triangle, optimize combination of sensitivity and specificity (Jones and Athanasiou, 2005; Akobeng, 2007). ROC curve analysis is also a method used to evaluate the logistic regression model. This analysis calculated the strength of the predictive value of the model to distinguish between positive and negative cases. It is calculated by AUC wide. As the AUC wide c-statistic or concordance index, a value that varies from 0.5 meaning no discriminatory power, up to 1.0, which means having the perfect discriminatory power (Cook, 2008).
The resulting comprehensive AUC of the ROC curve, the accuracy test for hyper-thyroidism TDQ at various threshold score TDQ this, ranging from 0.631 to 0.831 ROC (Picture 2). Comparative curves (Picture 1),
set up under the assumption prediction sco-re TDQ for hyperthyroid against thyroid sta-tus, using logistic regression test basis (pre-diction probability).
Picture 1. ROC curve hyperthyroid score TDQ as predicted probability
Picture 1 shows that the vast reaches 0.851 and the AUC will become a standard benchmark, which will be used to compare the AUC on a wide variety of scores TDQ threshold for hyperthyroidism (Picture 2).
Picture 2. ROC curves at various threshold score TDQ for hyperthyroidism
Based on the images of ROC curves at various threshold score TDQ for hyper-thyroidism (Picture 2), each comprehensive look AUC, can add justification to determine the basis of the interpretation of the election threshold score, earning the most accurate diagnostic test. The AUC vast increase of the threshold score of 20, 30 and wide reaching the highest (0.831) was obtained from the threshold score of 40 and decreased again at a score of 50, 60 and 70. Size AUC>0.8, generally indicates that the test is accurate, and more close to the curve at the top left corner, which is the point (0, 1) the more
accurate. The larger AUC makes more accu-rate diagnostic test (Jones and Athanasiou, 2005; Chaudron et al., 2010). However, for screening purposes, the value of higher sensitivity is preferred, although the AUC have the same size.
TDQ. The vast AUC on the threshold score of 40 is the highest, but it also evaluates Youden index, Kappa coefficient and LR (+) and LR (-), which is enough to show the accuracy. For institution involved to make the results of this study into policy input program updating data related to iodine deficiency and thyroid disorders through routine screening and sustainable.
REFERENCE
Akobeng AK (2007). Understanding diag-nostic tests 3: receiver operating cha-racteristic curves. Acta Paediatrica, 96(5): 644-647.
Alsayed A, Gad AM, Baset HA, Fattah AA, Ahmed A, Azab A (2008). Excess uri-nary iodine is associated with immune subclinical hypothyroidism Among Egyptian women. Endocrine Journal, 55 (3): 601-605.
Bayram F, Beyazyildiz A, Gökçe C, Slaves N, Erdoğan N, Kurtoğlu S, Kula M, Ünlü-hızarcı K, Keleştimur S (2009). The prevalence of iodine deficiency, serum thyroglobulin, anti-thyroglobulin and thyroid peroxidase antibody levels in the urban areas of Kayseri, Central Anatolia. Experimental and Clinical Endocrinology and Diabetes, 117 (2): 64-68.
Biswas B (2006). Assessing agreement for diagnostic devices. FDA/Industry Sta-tistics Workshop, September 28 to 29, Division of Biostatistics Office of Surveillance and Biometrics Center for Devices and Radiological Health, FDA. www. amstat.org.
Black MM (2003). Micronutrient deficienci-es and cognitive functioning. Prdeficienci-esent- Present-ed at the conference '' Animal source foods and nutrition in developing countries '' held in Washington, D.C. June 24-26, 2002. Published as a
sup-plement to The Journal of Nutrition: 3927S-31s.
Bohning DW, Bohning, Holling H (2008). Revisiting Youden's index as a useful measure of the misclassification error in meta-analysis of diagnostic studies. Statistical Methods in Medical Re-search, 17: 543-554.
Bruno A, Shah N, Lin C, Hess DC, Davis K, Baute V, Switzer JA, Waller JL, Nichols FT (2010). Improving modi-fied ranking scale assessment with a simplified questionnaire. Stroke, 41: 1048-1050.
Burgi H (2010). Excessive iodine intake: a short guideline. International Council for Control of Iodine Deficiency Disor-der (ICCIDD), Science and Technology Committee.
Chaudron LH, Szilagyi OG, Tang W, Anson L, Talbot NL, Wadkins HIM, Tu X, Wisner KL (2010). Accuracy of de-pression screening tools for identifying postpartum depression Among urban mothers. Pediatrics, 125: e609-e617. Cook NR (2008). Statistical evaluation of
prognostic versus diagnostic models: beyond the ROC curve. Clinical Che-mistry, 54:117-23.
Davidson M (2002). The interpretation of diagnostic tests: A primer for physio-therapists. Australian Journal of Phy-siotherapy.48.
Dillon JC, Milliez J (2000). Reproductive failure in women living in iodine-defi-cient areas of West Africa. British Journal of Obstetrics and Gynaeco-logy; May, 107: 631-636.
Sleman District Health Office (2003). The results of the monitoring of iodized salt and updating IDD District Sle-man.
Seminar Papers Improving the Quality of Human Resources Through Pre-vention of Iodine Deficiency Disorders (GAKI), Research and Development Center GAKI MOH Magelang, January 19, 2008.
Dopson S, Fitzgerald L (2006). Knowledge to action? Evidence-based health care in context, Oxford University Press, New York.
Elavunkal J, Sinert RA (2009). Screening and diagnostic tests. Department of Emergency Medicine, State University of New York Downstate Medical Cen-ter, Brooklyn, Kings County Hospital Center.
Fountoulakis S, Philippou G, Tsatsoulis A (2007). The role of iodine in the evo-lution of thyroid disease in Greece: from endemic goiter to thyroid auto-immunity. Hormones, 6 (1): 25-35. Glinoer D (2008). Thyroid regulation and
dysfunction in the pregnant patient, University Hospital Sant-Pierre-Uni-versite Libre de Bruxelles, Brussels Belgium, www. thyroidmanager.co.id Gonen MS, Kisakol G, Cilli US, Dikbas O,
Gungor K, Inal A, Kaya A (2004). Assessment of anxiety in subclinical thyroid disorder. Endocrine Journal, 51 (3): 311-315.
Henjum H, Barikmo I, Gjerlaug AK, Le-habib AM, Oshaug A, Strand FY, Tor-heim LE (2010). Endemic goitre and iodine in urine and excessive drinking water Among the Saharawi refugee children. Public Health Nutrition, 13 (9): 1472-1477.
Hermann D, Hewer W, Lederbogen F (2004). Testing the association bet-ween thyroid dysfunction and psy-chiatric diagnostic group in an iodine-deficient area. Journal of Psychiatry and Neuroscience, 29 (6): 444-449.
Indra R, Patil SS, Joshi R, Pai M, Kalantri SP (2004). Accuracy of physical exa-mination in the diagnosis of hypothy-roidism: a cross-sectional, doubleblind study. Journal of Postgraduate Medi-cine, 50: 7-10.
Jones CM, Athanasiou T (2005). Summary receiver operating characteristic curve analysis techniques in the evaluation of diagnostic tests. Annals of Thoracic Surgery, 79: 16-20.
Knottnerus J (2002). The evidence base of clinical diagnosis, by BMJ Books,
BMA House, Tavistock Square,
London.
Lamfon HA (2008). Thyroid disorders in Makkah, Saudi Arabia. Ozean Journal of Applied Sciences, 1 (1): 55-58. Mahfoud Z, Abdulrahim S, Taha MB,
Har-pham T, Hajj TE, Makhoul J, Nakkash R, Kanj M, Afifi R (2011). Validation of the Arab Youth mental Health scale as a screening tool for depression/ anxiety in Lebanese children. Child and Adolescent Psychiatry and Mental Health, 5 (9): 1-7.
Mayer D (2010). Essential evidence-based medicine, second edition, published in the United States of America by Cambridge University Press,New York. Mc.Dowell I (2006). Measuring health: a guide to rating scales and question-naires, third edition, Oxford Univer-sity Press, New York.
Murti B (1996). The application of non-parametric statistical methods in health sciences, Publisher PT Grame-dia Pustaka Utama, Jakarta.
Mutalazimah, Asyanti S (2010). Figures intelligence school children from the perspective of iodine levels in urine, Nutrisia Journal, 12 (1): 1-7.
pathophysio-logical symptoms as clinical and psycho-social impact of thyroid dys-function in women of childbearing age. Health Journal, 6 (1), 2013.
Sastroasmoro S, Ismael S (2011). Funda-mentals of clinical research metho-dology. 4th edition. Sagung Seto. Ja-karta.
Sebotsa MLD, Dannhauser A, Mollentze WF, Oosthuizen GM, Mahomed FA, Jooste PL (2009). Knowledge, attitud-es and practicattitud-es regarding iodine Among Patients with hyperthyroidism in the Free State, South Africa. South African Journal of Clinical Nutrition, 22 (1): 18-21.
Stockigt J (2010). Clinical strategies in the testing of thyroid function, Monash University and Alfred and Apworth Hospital, Melbourne, Australia, Pu-blished by thyroid manager.org
Strieder TGA, Prummel MF, Tijssen JGP, Endert E, Wiersinga WM (2003). Risk factors for and prevalence of thyroid disorders in a cross-sectional study of healthy Among female relatives of Patients with autoimmune thyroid
disease. Clinical Endocrinology, 59: 396-401.
Szklo M, Nieto FJ (2007). Epidemiology beyond the basics, Department ofPo-pulation Health Sciences, University of Wisconsin School of Medicine and Public Health Madison WI, Jones and Bartlett Publishers, Sudbury, Massa-chusetts.
Verma M, Raghuvanshi RS (2001). Dietary iodine intake and prevalence of iodine deficiency disorders in adults. Journal of Nutritional and Environmental Medicine, 11: 175-180.
Verhagen TEM, Hendriks DJ, Bancsi LFJMM, Mol BWJ, Broekmans FJM (2008). The accuracy of multivariate models predicting ovarian reserve and pregnancy after in vitro fertilization: a meta-analysis. Human Reproduction Update, 14 (2): 95-100.