5
A NAVAL APPROACH ON PROJECT RISK MANAGEMENT
1
JABIR ERANTHODI, 2N.THIRUGNANASAMBANTHAM
1
PG Scholar, 2Assistant Professor, Department of Civil Engineering,
Shree Venkateshwara Hi-Tech Engineering College, Gobichettipalayam
ABSTRACT
Managing risks in construction projects has been recognized as a very important management process in order to achieve the project objectives in terms of time, cost, quality, safety and environmental sustainability. This paper aims to identify and analyze the risks associated with the high rise building construction. The construction industry is always surrounded by many uncertainties which cause risk. One of the attempts to handle risks is by allocating project cost contingency. Traditionally, contractors determine cost contingency simply by adding; say 10% contingency onto the estimated cost of a project. However, this conventional method is arbitrary and difficult to justify or defend. This paper also aims to develop a method to estimate cost contingency based on risk analysis and fuzzy interference system.
1.
INTRODUCTION
Construction, like many other industries in a free-enterprise system, has sizable risk built into its profit structure. From beginning to end, the construction process is complex and characterized by many uncertainties. Risk management is a core of any business or organization, and construction industry and construction companies are no exception to this. Construction companies can lose substantial sum of money as a result of failure to identify and evaluate risk at time. Companies may even forego their opportunity to take advantage of potentially beneficial opportunities arising in the course of their activities if risk is not recognized in good time.
Most contractors, however, have developed a series of rules of thumb that they apply when dealing with risk. These rules generally rely on the contractor‟s experience and judgment. Rarely do contractors quantify uncertainty and systematically assess the risks involved in a project. Furthermore, even if they assess these risks, they even less frequently evaluate the consequences (potential impact) associated with these risks. One reason might be the lack of a rational straightforward way to combine all the facts of risk systematically into a prioritized and manageable scheme. Risk management is about looking ahead to
identify future opportunities as it is about avoiding or mitigating losses.
Risk should be systematically identified during initial stages of planning project. It is well known that managers and their teams generally know what could go wrong and what worthwhile opportunities might occur. Even when an analysis is undertaken team will not always maintain and update it equally. Sometimes when risks are foreseen, they are dismissed on the grounds that it couldn‟t happen here. Risk assessment must be adopted as a part of continuous review process.
6 One concept which is widely used within the field of RM is called the risk management process (RMP) and consists of four main steps: identification, assessment, taking action and monitoring the risks (Cooper et al., 2005). In each of these steps, there are a number of methods and techniques which facilitate handling the risks.
The construction industry operates in a very uncertain environment where conditions can change due to the complexity of each project (Sanvido et al., 1992). The aim of each organization is to be successful is not a tool which ensures success but rather a tool which helps to increase the probability of achieving success. Risk management is therefore a projective rather than a reactive concept.
Many previous studies (Klemetti, 2006; Lyons and Skitmore, 2002; Zou et al. 2006) have been conducted within the field of RM but each presents a different approach to this concept. The research in this master thesis focuses on the construction industry and how the subject is practiced in the everyday operation.
1.1 OBJECTIVE OF THE THESIS
The purpose of this master thesis is to evaluate what are the major risks in construction industry, how the risk management process is used in the construction industry and how the practitioners are managing risks in everyday situations. Quality targets, time targets, cost targets are the three objectives of project management. especially in the construction project, the time objective is closely and inseparably related to the cost objective. Thus the impact of risk in quality, time, and cost are to be found out. In order to achieve the purpose, the following research questions have been formulated to support the investigation:
What is the process of risk management? What risks are there in construction projects? What are the risks that affect time?
What are the risks that affect quality? What are the risks that affect cost? How risks can be controlled?
Development of a model for the estimation of project cost contingency as a risk mitigation measure
1.2 RISK
“Risk” is used in many different ways and with many different words, such as “hazard” or “uncertainty”. Risk can be of many kinds: safety risk, social risk, business risk, investment risk, military risk, political risk, etc. The riskier the activity is, the costlier the consequences, if the wrong decision is made. Businesses would like to quantify risk for many reasons. Knowing how much risk is involved will help decide if costly measures to reduce the level of risk are justifiable. It can also help to decide if sharing the risk with an insurance company is justified. Some risks, such as natural disasters, are virtually unavoidable and affect many people. Other risks are relatively personal, such as crossing busy streets. All choices in life involve risk. These risks cannot be totally avoided, but the choice can be made so that risk is minimized. This study is mainly concerned with the assessment of pure risk in construction, where managers need to know how much risk is involved in an activity to decide how to go about it. Risk has been defined in a variety of ways,
Webster‟s dictionary defines risk as “the possibility of loss, injury, disadvantage, or destruction.”
The Random House College Dictionary defines risk as “exposure to the chance of injury or loss.”
Symbolically, we could write this as:
Risk = f (Uncertainty of event, Potential loss/ gain from event).
The uncertainty of the event: How likely the event is to occur, i.e., the change of the event occurring. A sure or certain event does not create risk, although it may create gain or loss.
7 will use “loss” as a general term to include personal injury and physical damage, and “gain” to include profit and benefit.
From this definition, uncertainty and potential loss or gain are necessary conditions for riskiness. It may seem strange to refer to uncertainties about potential gains as risks. However, even in situations of potential gains, uncertainty is unattractive since the knowledge of the exact gains is unknown, and contractors are reluctant to give credit to an unknown gain.
2. LIKELIHOOD AND OUTCOMES
The concept of risk is used to assess and evaluate uncertainties associated with an event. Risk can be measured as a pair of the likelihood (probability of occurrence) of an event and the outcomes (consequences) associated with the event‟s occurrence. This pairing is not a mathematical operation, a scalar or vector quantity, but a matching of an event‟s likelihood of occurrence with the expected outcome. This pairing can be represented by the following equation:
Risk
In this equation is the likelihood of event x,
and is the occurrence outcome of the event.
3. METHODOLOGY
The preceding chapter described in some detail the concepts and the practices of risk management in construction projects for full understanding of risk management concepts and practices. In this chapter, a description of data collection procedure adopted for this research is described. This chapter also provides the information about research strategy, research design, target population and sample size. A detailed methodology and tools used are described.
3.1 Research design
The term “research design” refers to the plan or organization of scientific investigation, designing of a research study involves the development of a plan or strategy that will guide the collection and analysis of
data (Polit&Hungler, 1999). In this research a closed-ended questionnaire with interview is used to collect data from respondents to identify the risk affecting time, cost and quality. One of the attempts to handle risks is by allocating project cost contingency. Traditionally, contractors determine cost contingency simply by adding; say 10 percentage contingency onto the estimated cost of a project. However, this conventional method is arbitrary and difficult to justify or defend. This paper also aims to develop a method to estimate cost contingency using a flexible and rational approach that could accommodate contractors‟ subjective judgment based on risk analysis and fuzzy interference system.
The term “research design” refers to the plan or organization of scientific investigation, designing of a research study involves the development of a plan or strategy that will guide the collection and analysis of data (Polit&Hungler, 1999). In this research a closed-ended questionnaire with interview is used to collect data from respondents to identify the risk affecting time, cost and quality. One of the attempts to handle risks is by allocating project cost contingency. Traditionally, contractors determine cost contingency simply by adding; say 10 percentage contingency onto the estimated cost of a project. However, this conventional method is arbitrary and difficult to justify or defend. This paper also aims to develop a method to estimate cost contingency using a flexible and rational approach that could accommodate contractors‟ subjective judgment based on risk analysis and fuzzy interference system.
8 3.2 PROJECT RISK MANAGEMENT
This part focuses on defining and explaining the elements of risk management and presents the recommended overall structure for implementing risk management. (The Figure 4.1) reflects a structure that mirrors the perspective of the Project Management Institute‟s PMBOOK (Guide (2004) within the organizational environmental context.
Figure 3.2 project risk management
4. Risk identification
A critical step in the risk management process, risk identification is an organized, thorough approach to finding real risks associated with a project. After risks are identified and described, then they can be assessed or managed. Perhaps the keyfailing of project managers attempt to identify risks simply as “schedule” or “cost”. A risk event is something that may happen to the benefit or bad effect of the project. Risk events are most effective when they are described clearly and in depth. A high-quality risk event description will describe the potential occurrence and how it would influence the project. On a construction project, the risk that a “wall will collapse, causing a delay” is different from the risk that a “wall will collapse, killing someone.”
Information gathering
methods
Workshops
Brainstorming
Interviews
Questionnaires
Benchmarking
Consulting experts
Past experience
Delphi technique
Risk breakdown structure
Visit locations
Documentation Databases, historical data
from similar projects Templates
Checklists
Study project documentation
(plan, files etc.)
Study specialist literature
Research Stakeholder analysis
Research assumptions
Research interfaces
Table 3.1 Risk identification techniques
4.1 Identification by risk analyst
Risk identification by the risk analyst is where
the identification is solely done by the risk analyst, or a
small risk analyzing team and it is done by whatever
information the risk analyst can gather by him selves
and those techniques he got. Experience from other
projects where the same risk has occurred or otherwise
had been assessed is a great way to identify risks.
Especially if the project is similar to the current project
then there will be an even better opportunity to manage
the risks, through experience of previous successes and
mistakes. There is a good opportunity to improve
through each project completed.
When risks are identified they should be placed
in the project risk register which is a document of risks
that might occur. The risk register should include a list
9 with a disadvantage for the project, and also the effect
of the event will have to be documented there. Further
it also includes what actions there will be made to
prevent the risk from occurring, this will of course
happen after the identified risks have been analysed.
But if it should be the case that the organization has
made risk registers from previous projects it is a great
tool for collecting data for the risk identification of a
current and future projects.
4.2. Risk identification by work group
A work group for identifying risks is led by a
responsible risk analyst and is aid to identify risks with
supplementary tools and techniques. You can get
information from many different people such as the
project manager, different appropriate project team
members, risk management team, experts of project
risk management, which may or may not be involved
in the project, customers or the end users. Some of the
above mentioned people, such as end users, project
team members and customers, can provide their
information through structured questionnaires or
structured interviews, which can be processed to
identify risks.
4.3 Brainstorming
Brainstorming is an effective technique to
identify risks, where a select group is getting the
freedom of imagination to come up with every likely
(or maybe even unlikely) risk they can think of. The
ideas will then have to be sorted or review for further
development. The identified risk will have to be
described with course of impact and the affect on the
project, so it later will be able to be documented in the
risk register. The brainstorming is based on that there
will be a synergy effect, where group thinking is more
productive than individual thinking, where ideas can be
combined or further build by others. The brainstorming
is also based on that avoidance of criticism improves
the production of ideas, whereas more ideas gives a
higher chance of being useful ones and with no
criticism people are encouraged to think more out of
the box, which may give new discoveries.
4.4. Nominal group technique
The nominal group technique (NGT) could be
classified as a kind of brainstorming technique, where
people in an assembled group individually in silence
write down what they see as potential risks. After that
each person briefly presents in turn their ideas until
none in the group has any more ideas. After that each
potential risk will be discussed and all the group
members rank the risks, which in the end will give an
aggregated risk evaluation. In comparison to
brainstorming the NGT is more structured and does not
have the risk of be dominated by few individuals and
therefore there is an opportunity that the number of
ideas, numbers of unique ideas and the quality of ideas
is to be better.
4.5. Delphi technique
The Delphi technique is a method for
systematic collection and collation of judgment from
isolated suitable individuals on a specific topic. It is
done through carefully designed questionnaires with
sections for summaries and feedback from earlier
responses. The Delphi technique is done over at least
10 revise their opinion, through the answers from the
earlier questionnaire. After each round the estimates
for the variable are collected and summarized along
with reason for the estimation. The rounds continue
until the estimates stabilize.
4.6. Risk assessment
Risk analysis is the second stage in the RMP
where collected data about the potential risk are
analyzed. Risk analysis can be described as short
listing risks with the highest impact on the project, out
of all threats mentioned in the identification phase
(Cooper et al. 2005). Although some researchers
distinguish between terms risk assessment and risk
analysis and describe them as two separate processes,
for the purpose of this paper, this part of RMP will be
consistent with the model provided by Smith et al.
(2006) and described as one process.
Risk assessment is performed in numerous
ways. In the analysis of the identified risk, two
categories of methods – qualitative and quantitative –
have been developed. The qualitative methods are most
applicable when risks can be placed somewhere on a
descriptive scale from high to low level. The
quantitative methods are used to determine the
probability and impact of the risks identified and are
based on numeric estimations (Winch, 2002).
Companies tend to use a qualitative approach since it is
more convenient to describe the risks than to quantify
them (Lichtenstein, 1996).
4.7 Quantitative methods
Quantitative methods need a lot of work for the
analysis to be performed. The effort should be weighed
against the benefits and outcomes from the chosen
method, for example smaller projects may sometimes
require only identification and taking action on the
identified risks, while larger projects require more in
depth analysis. The quantitative methods estimate the
impact of a risk in a project (PML, 2009). They are
more suitable for medium and large projects due to the
number of required resources such as complex
software and skilled personal (Heldman, 2005).
Table 4.2: Quantitative Risk Assessment
Simulation Imitate the operation of a
process or system over time,
space, or operation cycles.
Failure Modes and
Effects Analysis
(FMEA)
Identifies the components
(equipment) failure modes and
the impacts on the surrounding
components and the system.
Fault Tree Analysis
(FTA)
Identify combinations for
equipment failures and human
errors that can result in an
accident.
Event Tree Analysis
(ETA)
Identify various sequences of
events, both failures and
success that can lead to an
accident.
Success Tree
Analysis
Model functions needed in
order for system to perform
properly.
Accident
Progression and
Identify the initiating events,
11 Frequency Analysis failure path.
Sensitivity Factors Importance factors are applied
to systems or components that
greatly lead to failure scenarios.
Fuzzy Stochastic
Applications
Fuzzy logic and set theory is
applied to linguistic terms.
Expected Monetary
Value (EMV) and
Expected Net Value
(NPV)
Incorporates probability cost
assessments and the time value
of money.
4.8 Qualitative methods
Qualitative methods for risk assessment are
based on descriptive scales, and are used for describing
the likelihood and impact of a risk. These relatively
simple techniques apply when quick assessment is
required (Cooper et al. 2005) in small and medium size
projects (Heldman, 2005). Moreover, this method is
often used in case of inadequate, limited or unavailable
numerical data as well as limited resources of time and
money (Radu, 2009). The main aim is to prioritize
potential threats in order to identify those of greatest
impact on the project (Cooper et al. 2005), and by
focusing on those threats, improve the project‟s overall
performance (PMI, 2004). During the phases of the
PLC, risks may change, and thus continuous risk
assessment helps to establish actual risk status (Cooper
et al. 2005) Limitations of quantitative methods lie in
the accuracy of the data needed to provide credible
analysis. In order for the risk analysis to be of use for
the project team, the accuracy, quality, reliability, and
integrity of the information as well as understanding
the risk is essential.
PMI (2004) identifies four qualitative methods
for risk assessment: Risk probability and impact
assessment, Probability/ impact risk rating matrix, Risk
Categorization and Risk Urgency Assessment. These
methods are briefly discussed below.
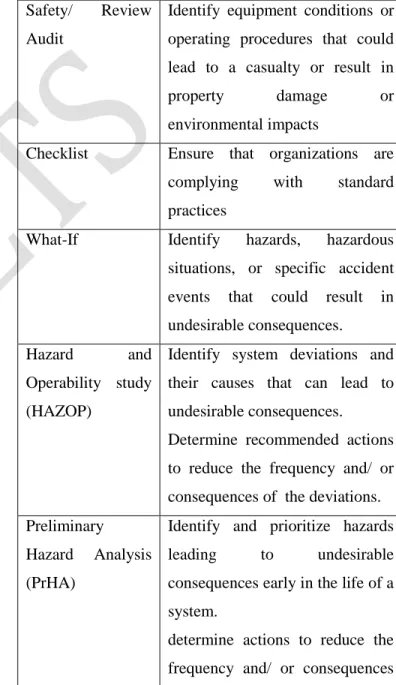
Table 4.3 Qualitative risk assessment methods
Safety/ Review
Audit
Identify equipment conditions or
operating procedures that could
lead to a casualty or result in
property damage or
environmental impacts
Checklist Ensure that organizations are
complying with standard
practices
What-If Identify hazards, hazardous
situations, or specific accident
events that could result in
undesirable consequences.
Hazard and
Operability study
(HAZOP)
Identify system deviations and
their causes that can lead to
undesirable consequences.
Determine recommended actions
to reduce the frequency and/ or
consequences of the deviations.
Preliminary
Hazard Analysis
(PrHA)
Identify and prioritize hazards
leading to undesirable
consequences early in the life of a
system.
determine actions to reduce the
12 of prioritized hazards
Risk Assessment
Matrix Tables
Frequency and consequences
qualitatively described, yet risk is
described quantitatively.
Analytic
Hierarchy Process
(AHP)
Assess risk by quantifying
subjective information in a
systematic manner.
Consequence Assessment and
Cause Consequence Diagrams.
Assess consequences and
scenarios leading to them.
Influence
Diagrams
Diagrammatically represent
sources and possible responses to
risks.
RISK ANALYSIS
Qualitative methods for risk assessment are based on descriptive scales, and are used for describing the likelihood and impact of a risk. These relatively simple techniques apply when quick assessment is required (Cooper et al. 2005) in small and medium size projects (Heldman, 2005). Moreover, this method is often used in case of inadequate, limited or unavailable numerical data as well as limited resources of time and money (Radu, 2009). The main aim is to prioritize potential threats in order to identify those of greatest impact on the project (Cooper et al. 2005), and by focusing on those threats, improve the project‟s overall performance (PMI, 2004).
6.2 Qualitative analysis
As mentioned in the Method section, a questionnaire is prepared based on the major risk identified and classified from the site. The respondents were asked to evaluate the probability of the risk‟s occurrence as well as the impact of that risk on time, cost and quality. The scale used for this assessment was adapted from the PMI (2008) book and is
presented in Table 6 and Table 7 for probability and impact respectively.
Table 6.1: Probability
Probability Very low
Low Medium High Very high Risk A 0.1 0.3 0.5 0.7 0.9
Table 6.2: Impact on time cost and quality
Iden tifie d risk Proj ect obje ctiv e Very low
Low Medi um
High Very high
Risk A
Cost Insign ificant cost increa se <10 perce ntage cost increa se 10- 20 perce ntage cost incre ase 20 – 40 percen tage cost increa se >40 perce ntage cost incre ase Tim e Insign ificant time increa se <5 perce ntage time increa se 5 - 10 perce ntage time incre ase 10 – 20 percen tage time increa se >20 perce ntage time incre ase Qua lity Qualit y degra dation barely notice able Only very dema nding applic ations are affect ed Quali ty reduc tion requi res spon sor appr oval Qualit y reduct ion unacc eptabl e to spons or Proje ct end item is effec tivel y usele ss
13 the risks with the greatest negative impact on the project performance. On the other hand, risks marked in the left bottom corner are categorized with low influence on the project. The remaining risks in the middle of the matrix are classified as a moderate level where the risks in the middle of the matrix are classified as a moderate level where the risks should be concerned, but not as extreme as the most negative risks. From this matrix, it is easy to reflect over which action to take against an evaluated risk.
Table 6.3: Matrix
0,80 0,08
0
0,24 0
0,40 0
0,50 0
0,72 0
0,40 0,04
0
0,12 0
0,20 0
0,28 0
0,36 0
0,20 0,02
0
0,06 0
0,10 0
0,14 0
0,18 0
0,10 0,01
0
0,03 0
0,05 0
0,07 0
0,09 0
0,05 0,00
5
0,01 5
0,02 5
0,03 5
0,04 5 IMPACT
PROBABILITY
0,1 0,3 0,5 0,7 0,9
6.3. Mitigation options
Figure 6.1. Risk impact quadrant
In order to suggest the mitigation options, the risk impact matrix has been divided into four quadrants.
Risks identified in the top-right quadrant are with high possibility and major impact – They should be incorporated into the response plan from the start.
Risks in the bottom-right quadrant require contingency plans.
Risk in the top-left quadrant shall not be tackled individually, but can be grouped with overall protection against their joint impact.
Risks in the bottom-left quadrant shall not be tackled straightaway, but should be monitored.
Critical risks that affect the cost aspect include construction delay, changes in work, delayed site access, inaccurate quantities of work, time constraint, productivity of equipment, inflation, delayed payment, price escalation, government acts and regulation etc. If there is no attention paid to these risks means that they could result in additional costs for the project.
The risk that challenge the time of project include Construction delay, Changes in work, Delayed site access, Inaccurate quantities of work, Time constraint, Productivity of equipment, Price escalation etc. As soon as they are under control, the time delays can be prevented. This is one major benefit while doing such a risk assessment, it shows where to put focus on in order to keep the project running without interrupting and to have control.
14 affect the project to a large extent. Therefore, it is important to deal with the risks when they are still manageable in order to deliver what the client wants and within the project objectives. If is the reason for why the three objectives – cost, time and quality – have been inspected and evaluated in this case study. Of course, there are many other risks that can occur in this project, but due to the limited research, only these risks in the matrixes have been brought up.
6.4. Mitigation measures
The purpose of mitigation measures is to avoid, minimize or remedy adverse impacts. The various risks and their mitigation options which were obtained from literature survey are discussed below.
Table 6.4. Mitigation measures
Sources of risks Author Mitigation options Design and
specifications Risks
(Kochi et al. 2008)
Transfer by allocating risk on engineering consultant for errors created by his negligence Leadership,
Co-ordination and Organisational Risks
(Kochi et al. 2008)
Reduce by managing HR effectively Employ
experienced operational personnel Allow staff
training and development Committed
project leader Cost Overrun
risks
(Simon 2000)
Prepare contingency Plan Ensure
performance guarantees
Time Overruns (Simon 2000)
Select an experienced Sub Contractor Use Proven
technology Political and
legal risks
(Kochi et al. 2008)
Allow an extension time to the contractor for extra time if a public disorder occurs Reduce by
educating the affected public of the benefits of the project Force Majeure (Simon
2000)
Transfer risk to Insurers.
Financial and Economic risks
(Kochi et al. 2008)
Accept/ share if the project duration is greater than 12 months by making price escalation provisions or inflation sharing mechanism in contracts. Maintain quality
standards and make bids competitive. Some of the mitigation options were from expert interviews. They are summarized below.
Physical Resources Mobilization and Utilizationrisks: Reduce by negotiating long term supply, Use of local sub-contractors. Technology Changes risks: Reduce by using
Proven technology.
15 work and use quality materials, Use trained man power.
Radar diagrams
Figure 6.9. Radar diagram for contractual and legal risks
Figure 6.10.Radar diagram for political and societal risks.
CASE 1 – TRIANGULAR MEMBERSHIP
FUNCTION
7.5.1. Constructing fuzzy membership function
For triangular fuzzy membership function
shape, the membership parameters used are three
values.
Figure 7.2.Triangular membership function for input
variable RS.
Figure 7.3. Triangular membership function for output
variable RM.
7.5.2. Specifying fuzzy rules Risk
Likelihood
(RL)
Risk severity (RS)
VL L M H VH
VL VL L M H VH
L VL L M H VH
M VL L M H VH
H VL L M H VH
16 Fuzzy rule base is the basis of the composition
or reasoning process of the fuzzy system model. Any
fuzzy if-then rule is composed of two parts: a premise
and a conclusion. The premise considers different
combinations of input variables, while the conclusion
represents the output given the selected interaction
between the input variables. Since we have two inputs
RL and RS, and each one is represented with five
linguistic terms, 52=25 rules can be generated t cover
all of the possible input combinations.
In general, fuzzy rule base is represented using
IF (antecedent)-THEN (consequent). The five sets of
rule bases used for the model analysis are described
below. The rules can be interpreted in the following
manner. „If RL is H and RS is statements that comprise
fuzzy logic, in general, fuzzy rule base is represented
using IF (antecedent)-THEN (consequent). Here the
antecedent parts are RL and RS and the consequent
part is RM. AND is the fuzzy operator used to connect
both parts.
The first set of rule base gives more preference
to risk severity (RS) than risk likelihood (RL).
Table 7.1: Rule 1
The second set of rule base gives more preference to
risk likelihood (RL) than risk severity (RS).
The third set of rule base takes the worst scenario into
consideration. RM depends on the maximum value
among RL and RS.
Table 7.3: Rule 3
In the fourth set of rule base, RM depends on the
minimum value among RL and RS.
Table 7.4: Rule 4
Risk
Likelihood
(RL)
Risk severity (RS)
VL L M H VH
VL VL VL VL VL VL
L VL L L L L
M VL L M M M
H VL L M H H
VH VL L M H VH
The fifth set of rule base slightly optimistic by giving
RL and RS equal importance.
Table 7.5: Rule 5
Risk
Likelihood
(RL)
Risk severity (RS)
VL L M H VH
VL VL VL L L M
L VL L L M M
M VL L M M H
H VL L M H H
VH VL L M H VH
Risk
Likelihood
(RL)
Risk severity (RS)
VL L M H VH
VL VL L M H VH
L L L M H VH
M M M M H VH
H H H H H VH
17 Here, risk magnitude can be expressed in terms of
chance of occurrence of risk (RL and if effect on total
project cost RS). RL is just a probability and it can be a
number between 0 and 100 expressed in percentage.
RS varies according to different projects. Generally it
is a percentage increase of budgeted cost that happens
when the risk occurs.
8.1. CONCLUSION
A list of 37 major risks in high rise building
and their impact on time, cost and quality has to be
found out using qualitative technique. Generalizing the
risks in projects would be helpful for executing similar
type of projects in the future. A model is developed to
estimate cost contingency used the fuzzy interference
system (FIS) concept. According to Idrus et al. (2010)
as cited by Asworth (1998) and Idrus (2001), an error
of less than ± 20 % is considered acceptable for the
purpose of costing in the construction business. Here 2
models (triangular and Gaussian) are discussed.
Among the two models, triangular model with the third
set of rule base is found to be more accurate with the
following scenario were considered.
Implication – minimum
Aggregation- maximum
Defuzzification- Centroid of area (COA)
Moreover the development of a model for the
estimation of cost contingency using risk analysis and
fuzzy interference system proves to be one of the best
models as their error can be limited within 15%
8.2. LIMITATIONS
Due to lack of time, the model has been tested
using three sets of reading and validated using one
project risk data.
8.3. RECOMMENDATIONS FOR FUTURE
WORK
Based on the findings of this research work
and the knowledge gained through literature surveys,
following recommendations are suggested for future
research work.
The error in the model analysis can be further
reduced by changing the shape of membership
function to customized ones. This may decrease
the error to a level within 10 percentages.
Similarly the error can also be reduced by
increasing the number of rules and changing the
properties of fuzzy interference system.
REFERENCES
1. JiahaoZeng a, Min An a,*, Nigel John Smith
“Application of a fuzzy based decision making
methodology to construction project risk
assessment” International Journal of Project
Management 25 (2007) 589 – 600
2. Olga Perminova, Magnus Gustafsson, and
Kim Wikstro “Defining uncertainty in projects – a
new perspective” International Journal of Project
Management 26 (2008) 73 – 79
3. Patrick X.W. Zou, Guomin Zhang, Jiayuan
Wang “Understanding the key risks in construction projects in China” International
Journal of Project Management 25 (2007) 601 –
18 4. Patrick X.W. Zou; Ying Chen; and Tsz-Ying
Chan “Understanding and Improving Your Risk
Management Capability: Assessment Model for
Construction Organizations” journal of
construction engineering and management asce
august 2010
5. SamehMonir El-Sayegh “Risk assessment
and allocation in the UAE construction industry”
International Journal of Project Management 26
(2008) 431 – 438
6. VeredHolzmann, Israel Spiegler “Developing
risk breakdown structure for information
technology organizations” International Journal of
Project Management 29 (2011) 537 – 546
7. “Risk analysis in construction project -
chosen methods” By
AgnieszkaDziadoszMariuszRejment. Institute of
Structural Engineering, Poznan University of
Technology, Piotrowo 5, 60-965 Poznan, Poland.
8. “Fuzzy logic-based risk assessment”By
LÁSZLÓ POKORÁDI University of Debrecen,
Debrecen, Hungary.
9. “Risk Analysis of Construction Projects
using Fuzzy
Logic”ByKattiRhushikeshSiddhappa,B.AKonnur,
Amarsinh B Landage.Department of Civil
Engineering Govt college ogEngineering,Karad
Published on 8&9 jan 2016
10. “Fuzzy Risk Analysis Model for Construction
Projects” Bypejmanrezakhani .Mscstudent
,KyungpookNatioanal University school of civil
and architectural