Dynamic Maps in Humanities Computing
Martyn Jessop, King’s College London
This paper discusses how and why dynamic maps are better suited to the re-quirements of humanities scholars than conventional cartography or GIS systems. It highlights some of the strengths of dynamic maps and shows their value to humanities computing projects. However, there are also a number of weaknesses with existing technology and techniques. These are discussed and possible ways forward are suggested. It illustrates some of the issues by refer-ence to the experirefer-ences of two case study projects that have been conducted at the Centre for Computing in the Humanities at King’s College London.
Keywords: GIS, humanities computing, space, time, maps
The application of computing to research problems in the humanities is not new. Humanities scholars have sought to apply computing tech-niques to their research since the construction of the very first machines. Despite this long association of applied computing with humanities research it is only in recent years that the application of computing tech-niques has become widespread among humanities scholars. The reason for this is almost certainly that it has taken a long time for computing techniques and technology to advance to a state where they can process the myriad complex data sources of the humanities and begin to answer the diverse questions asked by researchers. This has been especially true where the research involves information with an element of spatial data.
of past, and current, human endeavour. These disciplines are rich in potential applications for dynamic maps.
One dictionary definition of ‘dynamic’ is ‘active, potent, energetic, effective, forceful’. These are also words that could be used to describe the actions, effects, and products of human hands and minds that form the source materials studied by humanities scholars.
Those keywords could also be used to describe the desired effective outcome of any form of graphical representation of data. The dictionary defines a map as ‘a chart, plan or diagram’ which emphasises its role as a means of graphical representation. This can be seen in many of the conventional maps used in humanities research. These maps are generally displaying knowledge that is already known. A definition that is more generally applicable to the humanities is that of ‘a diagram or collection of data showing the spatial distribution of something or the relative positions of its components’. It is the study of spatial distributions and relationships that holds the greatest potential for dynamic mapping in the humanities. In many cases this style of map moves away from dis-playing what is already known towards visualisation and discovery of new knowledge, revealing information that was not known before.
This paper discusses why dynamic maps are better suited to the requirements of humanities scholars than conventional cartography or Geographical Information Systems (GIS) applications. It will highlight some of the strengths of dynamic maps and show their value in human-ities computing projects. The nature and characteristics of the data used in humanities research differs significantly from the earth-science data that GIS was designed to work with. This difference exposes a number of weaknesses with existing technology and techniques. These problems are discussed and possible ways forward are suggested. Some of the issues are illustrated by reference to two case study projects that have been con-ducted at the Centre for Computing in the Humanities (CCH) at King’s College London. Illustrations of possible future directions are provided by a discussion of some of the projects under development at CCH.
Cartography and Humanities Research
Dynamic mapping can be highly effective for this style of data present-ation but its full potential becomes apparent when it is used as a visualis-ation tool to gain an insight into the meaning of data and create new knowledge.
Conventional cartography has always been a key tool in archaeology where researchers were quick to apply GIS technology. Initially GIS was used to replicate traditional maps and plans but soon use began to be made of the new tools and techniques that the technology made avail-able. Historians and geographers working in the area of historical social geography are also applying GIS in a variety of ways. However, beyond these isolated disciplines GIS is currently applied to very few areas of humanities research. This is partly because of a lack of awareness as there are very few case studies to show what has been done and, more importantly, what could be done in the future. There is also reluctance among scholars to make the high investment of effort and finance required to achieve outcomes that are often uncertain or ill-defined. There are many researchers that use spatial data but the limitations of current methodologies mean that their data are not suitable for existing GIS technology, or that the large investment of time required to make use of existing mapping tools cannot be justified.
There is considerable scope for a more general interpretation of the meaning of the word ‘Geographical’ in GIS. There is perhaps a need for a broader term of ‘Spatial Information System’, or SIS (Jessop 2005). In a SIS the spatial aspect of the data could describe features such as the relative locations of the compositional elements of a painting or the positions of the fragments of a broken Bronze Age cooking pot re-constructed in 3D space. It could also handle aspects of a further dimension that is of great importance to many humanities scholars, namely time. Time is particularly badly accommodated by the majority of today’s GIS applications, but the study of change through time is at the core of many research agendas.
of a battle. Time also provides a continuum in which past changes continue to influence the present (or lead up to one in the past), e.g. the multiple place names of villages in disputed border regions.
The Centre for Computing in the Humanities (CCH) at King’s College London engages in collaborative research with academics from a wide variety of humanities disciplines in many varied institutions and organisations. The project work at CCH provides many opportunities to explore the use of dynamic maps for the presentation of spatial data or in roles such as web site navigation aids and data organisation tools. Two projects are discussed below to illustrate the value and applications of dy-namic maps that have been explored so far and to suggest avenues for possible future development.
The Dynamic Mapping of Naval Battles
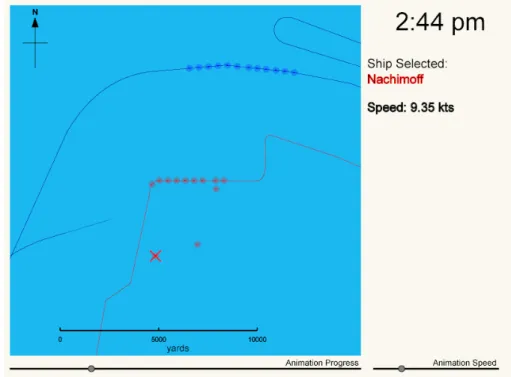
Our students are encouraged to think critically and imaginatively about the application of humanities computing. Students are increasingly using dynamic maps in their final year undergraduate projects or postgraduate dissertations. Christian Losits, a final year student on our ‘Humanities with Applied Computing’ programme at King’s College London, re-searched computer animation as a means of unravelling the complex movements and events of a naval battle during the Russo-Japanese War at Tsushima in 1905. A fuller description of the project is given in an earlier paper (Jessop 2004).
presented graphically as maps. However, it is impossible to clearly represent references to changing positions through time on a single static
Figure 1. Naval battle
both space and time to be combined in a single display showing the movements and events of a battle while maintaining clarity in a comprehensive dynamic map. The animation does this by separating the temporal from the geographical aspect of the data and makes it far easier to interpret the complex movements of a naval engagement.
Many design issues arose during the project. The importance of the quality of the source data in this style of work also became apparent. The occurrence of key events could be determined from original sources, but it was often not possible to represent them accurately in either time or space because of vague, incomplete or conflicting records. For these rea-sons graphical representation of the gunnery at Tsushima (the battle being studied) in 1905 would be crude and of little help in a detailed investigation. As technologies and attitudes changed, so did naval record keeping, and records from subsequent conflicts are much more accurate and suited to this type of work. In this project, what was found to be flawed was not the technique itself but the nature of the sources. The key issue is the confidence one has in the original evidence. This is a valuable general principle in this type of work. What one is investigating is not the battle itself but the observers’, or researchers’, perceptions of it. There is a danger that the use of computing techniques may give these perceptions a stamp of authority that is not warranted. This raised ques-tions concerning methods of dealing with the different levels of confidence that one may have in the accuracy of the information that is being displayed.
2003) frequently have to tackle this problem. Users of these reconstruct-ions can select the level of historical validity used in the virtual reality construction. At the highest level of confidence a user can choose to display data that are only from academically verifiable sources from the original site. The next level of confidence is to add to this those details that can be reliably deduced from the original sources but for which there is no firm evidence from the site itself. The final level of confidence includes features that are largely based on conjecture about how it could have looked. This yields the most complete and life-like model.
The approach used for the Theatre of Pompey works well with a single object, such as a theatre, but a naval battle is a linear sequence of related events. All the events have to be represented even if one is uncertain about the precise location at which they occurred. A simple approach is to produce different animations for each account, ensuring that the viewer is aware of any possible bias or uncertainty. One possible solution for the naval battle project was to produce plots showing the range of variations in the location of a particular event according to different eyewitness accounts. In this way the magnitude of the variations in the recorded locations of each event could be assessed graphically. Unfortunately, the student did not have time to pursue the implement-ation of this approach but it is something that may find an applicimplement-ation elsewhere at a later date.
The Application of GIS to Produce a Cultural Heritage Digital Resource
dynamic maps. For example, it is common practice for place names to be changed as successive rulers try to stamp their authority on the area. The multicultural nature of the area means that each name often has at least three forms, one in each of the different languages of the region. Cartographers from the British army performed the first major survey of the area. On these maps the place names were often anglicised into phonetic versions of their original names, thus giving rise to one more set of names in common usage. The combination of political changes over the last hundred years and the multicultural nature of the community means that in some cases a single village may have had up to sixteen different names during the period being studied. The data are therefore dynamic not just temporally but also ethnically. To display a map of village names one must first select a specific date and then choose an ethnic viewpoint. Although the implementation is challenging, only an electronic map can accommodate the whole range of names and display the changes through time.
For many projects using historical data, there will not be a single map that can be used as a base map, since each published map will only represent a ‘snapshot’ of a particular time viewed from a particular political or racial bias. Physical features such as roads and railways are regarded as fixed objects by the majority of those producing present-day maps. However, from a historian’s viewpoint these features are not fixed but are in a continual state of change and development. For example, the fixed reference points of the transport network of contemporary cartography cannot provide such a stable framework for a historian. In the case of a transport network the development of the framework may itself be the cause or product of changes the historian is seeking to invest-igate. One of the potential attractions of GIS in the humanities is that, although it is weak in this area at the moment, it could be developed to manage and represent these changes via metadata detailing temporal information associated with each feature. This would have far-reaching applications in many disciplines.
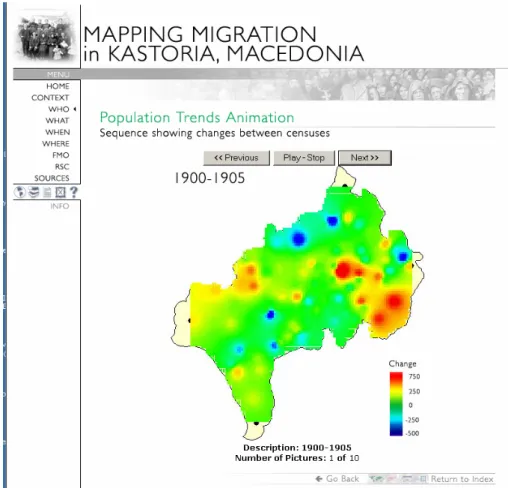
sequence was used to show the distribution of fluctuations in population change across the region throughout the Twentieth Century (Figure 2).
Figure 2. Mapping migration
be-tween different geographical regions via the use of colour coding. There are some fundamental weaknesses inherent in this style of map. Com-puter technology is able to produce an enormous range of colours but the human brain is only capable of distinguishing between a small number of colours used in this way. The coloured areas of the map are often not adjacent and are therefore even more difficult to compare by eye. The problem is exacerbated when plotting a series of maps showing change through time. One must try to keep to a consistent set of colours to allow comparisons to be made between time periods shown on different maps. The categories (or numeric ranges) associated with the colours chosen must encompass the whole range of data across the time period being studied. This is extremely difficult to achieve in practice. For example, a map of population change in the different districts of New York would have to accommodate relatively small variations in the Eighteenth Century but variations of many tens or hundreds of thou-sands in the Nineteenth and Twentieth Centuries. Humanities scholars are often researching complex inter-relationships that affect the develop-ment of communities. This involves the investigation of many influences and the complex interactions between them. The limitations of choro-chromatic and choropleth maps become acute when performing statis-tical analysis of simultaneous relationships among three or more variables across a geographical area using multivariate analysis. The maps produced are too confusing to be of any real value. During the project it became apparent that a completely new style of graphic is required, one that can probably only be provided via a dynamic electronic map. It is hoped that this will provide a focus for our research in the future.
Projects under Consideration or Development
The following projects give an indication of future directions for dynamic mapping in the projects at CCH.
Prosopographies
connections. A prosopography is primarily concerned with the presence and actions of individuals at particular locations and times and the interactions between them, something that lends itself well to dynamic mapping. The prosopographies currently under development at CCH are:
• Prosopography of Anglo-Saxon England (PASE)
• Clergy of the Church of England Database 1540-1835
(CCED)
• Prosopography of the Byzantine World (PBW)
These are highly collaborative projects that require a team of specialists in different fields. The same group of staff from the CCH are working on each of these projects while the collaborating organisations and staff vary from one project to another.
Our collaborators for PASE are the History Department at King’s College London and the Department of Anglo-Saxon, Norse and Celtic at Cambridge. This is a 5-year project to provide a comprehensive biographical register of recorded inhabitants of Anglo-Saxon England (c. 450-1066). The project is funded by The Arts and Humanities Research Council (AHRC). PASE will be accessible in the form of a freely available on-line database and is intended to facilitate further research in many different aspects of Anglo-Saxon studies.
The CCE database project involves CCH and the History depart-ments at King’s College London and the Universities of Kent and Reading. It is a major AHRC funded project to produce a web-based database of all the clergy of the Church of England between 1540 and 1835, which will for the first time permit a serious investigation of the changing dynamics of the clerical profession in England. As the church was highly influential during that period, it will also be an important resource for many scholars studying English history.
individual mentioned in Byzantine textual sources in Greek and Latin, together with as many as possible of the individuals recorded in seal sources, in the period 641-1261.
These three prosopographical projects share a common set of characteristics and requirements as an application for dynamic mapping. The mapping work is still at an early stage but the presence of three similar projects within the same research group should provide eco-nomies of scale and provide sufficiently diverse source material to ensure that an effective generic solution to the dynamic mapping of such information can be developed.
The CCE project also demonstrates the importance of the digital resources produced by earlier unrelated projects. The resources produced by the Historic Parishes of England & Wales project (Kain & Oliver 2001), which was completed in 2001, are of particular importance. Without this resource the mapping of the project could not be contemplated with the funding that is available. A ‘critical mass’ of digital resources is gradually accumulating. Even where a project does not produce a digital resource that can be utilised by others, it may still produce ideas, methodologies or concepts that advance the development of dynamic mapping.
Charter Bounds
The boundary descriptions contained within Anglo-Saxon charters are of interest to scholars in many different disciplines. They provide rich research sources for the linguist and onomatologist, archaeologist, histo-rical geographer, agrarian historian and many others. The questions asked by scholars in these disciplines often require the bounds to be seen in relation to each other. This offers many opportunities for different styles and applications of mapping and graphical presentation. The mapping aspect of this project, Langscape, is at a very early stage of development but offers many challenges and possibilities.
Conclusion
recent emergence of suitable technology to support digital humanities methodologies has led to a situation where many researchers are as yet unaware of the possibilities of digital scholarship in their work. This is particularly true of those computer applications and methods utilising data types other than the ‘conventional’ data of text or numbers. Projects involving spatial data were seen as requiring specialised knowledge and software or hardware. However, the research work that is now emerging, together with publications such as this, will do much to raise the profile of mapping and spatial analysis. The study of the dynamism of human activity that is at the heart of humanities scholarship provides many potential applications for dynamic mapping. It provides a means of un-ravelling and visualising complex sequences of events, moving from displaying that which is already known to providing new insights and knowledge. An increasing number of projects will be proposed as aware-ness of what is possible spreads to a wider academic community.
Temporal data are central to many humanities disciplines. Dynamic maps are a highly effective means of representing the passage of time and presenting knowledge that is already known. One of the case studies here shows how they can be used to handle time, separating it from space, to allow the complex sequences of movements and events that make up a naval battle to be more easily understood. They have the potential to allow us to visualise temporal data in ways that were not possible before and enable new understanding and insights to be gained.
of representation and consider new styles of maps that are better suited to their purpose.
It is significant that we use the phrase ‘I see’ when what we mean is ‘I understand’. This is the primary principle behind visualisation tech-niques – we often need to ‘see’ the data graphically before we can under-stand it. The development of methods and techniques for exploring and displaying spatial data in the humanities disciplines, as dynamic maps or otherwise, offers many opportunities for original and creative thought and discovery of new knowledge. The case studies described in this paper have shown some of the strengths of dynamic mapping and highlighted some of the challenges and opportunities facing workers in this field. The limiting factors, such as lack of historical digital map data, are gradually being overcome as digital resources are produced which benefit subse-quent, sometimes unrelated, projects. Even where a project does not produce a digital resource that can be utilised by others, it may still produce methodologies or concepts that advance the development of dy-namic mapping in the emerging discipline of humanities computing.
Martyn Jessop is a senior analyst at the Centre for Computing in the Humanities at King’s College London. He teaches on the College’s digital humanities and digital culture programmes. His research interests include the application of visualisation techniques to spatial and temporal data in the humanities.
References
beacham, richard & hugh denard (2003). “The Pompey Project: Digital
Re-search and Virtual Reconstruction of Rome's First Theatre.” Computers and the
Human-ities 37.1: 129-139.
jessop, martyn (2004). “The Visualization of Spatial Data in the Humanities.”
Lite-rary & Linguistic Computing 19.3: 335-350.
jessop, martyn (2005). “The Application of a Geographical Information System to
the Creation of a Cultural Heritage Digital Resource.” Literary & Linguistic Computing
20.1: 71-90.
kain, roger & richard oliver (2001). Historic Parishes of England & Wales: An
Electronic Map of Boundaries before 1850 with a Gazetteer and Metadata. Colchester:
History Data Service.
losits, christian (2003). Animating Naval Battles from the Russo-Japanese War (1905). Third year project for Humanities with Applied Computing programme at King’s
College London. London: King’s College. <http://www.kcl.ac.uk/cch/m_jessop/losits>