© FECAP
Review of Business Management
DOI: 10.7819/rbgn.v18i61.2471
436
Received on 04/24/2015 Approved on 06/09/2016
Responsible editor:
Prof. Dr. Guilherme Shiraishi
Evaluation process: Double Blind Review
The advertising value of Twitter Ads:
a study among Mexican Millennials
Enrique Murillo¹
María Merino¹
¹ITAM, Department of Business Administration, Mexico City, Mexico
Adriana Núñez
Independent Business & IT Consultant, Mexico City, Mexico
Abstract
Purpose – This study set out to measure the perceived Advertising Value of Twitter ads on a large sample of Mexican Millennials. Design/methodology/approach – An online survey was used to collect data among 630 university students. The hypothesized antecedents of Advertising Value were Informativeness, Entertainment, Irritation and Credibility. The model was estimated using Partial Least Squares. Findings – Results indicate Informativeness and Entertainment were the strongest predictors, with Credibility in third place. In addition, Credibility displayed gender effects: it was significant for female respondents but not for males. Irritation failed to reach statistical significance in most subsamples, suggesting Twitter ads are more acceptable to Millennials than other advertising formats.
Originality/value – Millennials tend to dismiss traditional advertising formats. At the same time they are heavy users of Social Networking Sites. This research provides the first empirical estimation of the Ducoffe model of Advertising Value in the microblogging service Twitter, and the first application of this robust model of web advertising to a Latin American sample. Our results have important implications for both regional and global brands targeting Millennials.
1
Introduction
Despite being ranked among the top destinations on the Internet, Social Networking sites (SNS) often struggle to generate revenues commensurate to their large operating costs. Typical revenue models used by SNS are advertising, subscription and transaction (Enders, Hungenberg, Denker, & Mauch,
2008). Among them, the advertising model, which includes text and banner ads, affiliate ads, and sponsorships, is the most commonly used by SNS (Enders et al., 2008; Nogueira-Cortimiglia, Ghezzi, & Renga, 2011). This model depends on a large user base, with monthly active users as the key metric, because most advertisers will require several million unique visitors to consider a particular SNS as a feasible option to invest their advertising budgets.
Twitter is among the most popular SNS; it claims 310 million monthly users, with 79% of them outside the US (Twitter, 2016). In Latin America, Brazil and Mexico have the largest number of users, expected to reach 27.7 and 23.5 million by 2016 (Emarketer, 2016a). Moreover, Twitter users in the region are mostly teenagers and young adults, which suggest Twitter advertising would be an attractive option for brands targeting Millennials.
However, companies have struggled to connect with the Millennial generation, because many of the traditional methods of advertising have proven ineffective at capturing their attention. Only 1% of Millennials surveyed in a recent study said that a compelling advertisement would increase their trust in a brand. Millennials believe that advertising is all spin and not authentic (Schawbel, 2015).
Therefore, it is imperative to better understand the opinions and attitudes of young Latin American consumers toward Twitter ads. In particular, establishing to what extent factors such as the perceived Credibility of the ad, or the Irritation attached to it, affect users’ attitudes toward Twitter advertising, and whether this should encourage or discourage brands from such
practices. This study provides a clear empirical answer to these questions using the model of Advertising Value proposed by Ducoffe (1996). Our findings are thus relevant to global and regional brands targeting young consumers in Latin America.
2
Twitter Features and Ad Formats
The microblogging service Twitter was launched in 2006, and has grown to become one of the most popular SNS in the world. An independent forecast from Emarketer (2016b) estimated that worldwide active Twitter users, defined as those who enter their account at least monthly, will reach 291 million in 2016, with most of the growth coming from emerging markets.
Like other SNS, users can post status updates to their connections (called Followers in Twitter), and in turn can read the updates of the people or companies they are following. These posts were originally limited to 140 plain-text characters, thereby allowing the service to operate over mobile phone networks as SMS messages. This native ability to run both over the Internet and cell-phone networks greatly contributed to Twitter’s rapid diffusion.
Like most other SNS, Twitter provides its service free to users, and relies on an advertising revenue model (Enders et al., 2008). Twitter began paid advertising in 2010, and has seen its ad revenues grow steadily, particularly in the mobile platform which currently comprises 90% of ad revenues (Emarketer, 2016c). However, Twitter has been careful to protect its user experience, and to avoid overloading users with ads (Copeland, 2012). Ad clutter on Twitter is perceived as lower than other popular Internet platforms, such as Google Search or Facebook (Tassi, 2013).
The rapid growth of SNS advertising budgets is strong justification for researching consumer attitudes toward the ads they encounter on these platforms (Saxena & Khanna, 2013; Taylor, Lewin , & Strutton, 2011). Previous studies have examined advertising in SNS in general (Chandra, Goswami, & Chouhan, 2013; Saxena & Khanna, 2013; Taylor et al., 2011) or in Facebook, the current SNS leader (Dao, Le, Cheng, & Chen, 2014; Logan, Bright, & Gangadharbatla, 2012; Méndiz-Noguero, Victoria-Mas, & Arroyo-Almaraz, 2013). There are also numerous studies on the use of Twitter as a platform for engaging with consumers, in areas such as customer service (Coyle, Smith, & Platt,
2012; Sreenivasan, Lee, & Goh, 2012), brand engagement (Kwon & Sung, 2011; Li & Li, 2014; Logan, 2014; Sandoval-Almazán & Nava-Rogel, 2012), and electronic Word of Mouth (Jansen, Zhang, Sobel, & Chowdury, 2009; Kim, Sung, &
Kang, 2014; Zhang Jansen, & Chowdhury, 2011). These studies fall under the rubric of engagement marketing, whereby companies publish branded content on their SNS, usually without any cost, in the hopes that their followers will engage with this content by “liking” it, adding a comment,
or in the best of cases forwarding it to their own social contacts (Henry & Harte, 2012).
The other use of Twitter as a marketing platform is targeted advertising, whereby Twitter places “promoted” posts in front of selected users and charges advertisers according to the actions users take. However, tech-savvy Millennials may recognize these posts as paid advertising, and may react to them unfavorably (Schawbel, 2015). This is where Ducoffe (1996) robust model of Advertising Value can provide valuable insights, because it explicitly considers consumer irritation with ads as a predictor of perceived Advertising Value. However, a direct application of this model to Twitter ads has yet to be attempted. Given the growing popularity of Twitter in Latin America, and potential advertiser concerns about user irritation with ads, our study provides the first estimation of Advertising Value for Twitter ads in a Latin American context, with Spanish-translated scales.
Figure 1. Twitter advertising formats. Source: www.serps-invaders.com. Note. used with permission.
Next, there are Promoted Accounts, which appear on the Who to Follow section of the user’s homepage, again marked as Promoted. The Twitter algorithm analyzes the brand’s followers and determines other brands those users tend to follow. When it detects a user that follows those brands, but not the advertiser’s account, the algorithm recommends the advertiser’s Promoted Account to that user (Twitter, 2014b). The advertiser pays for the number of new followers it gains.
Third, there are Promoted Trends, which appear at the top of the Trending Topics list on Twitter and are also labeled as Promoted. They are visible to all users of Twitter while they are being promoted (Twitte, 2014c).
With the exception of the “Promoted” label, these ad formats look just like as ordinary tweets, trends and suggested accounts. Therefore, they display natively in the Twitter desktop and
mobile user interface, as well as the various Apps Twitter provides for all mobile operating systems: iPhone, Android, Blackberry, Windows, Symbian, etc. Given the growing importance of mobile advertising, this compatibility between desktop and mobile screens has become an important advantage for Twitter in the ongoing shift of digital advertising budgets toward mobile platforms (Emarketer, 2015; Koh, 2014).
3
Consumer Attitudes Toward SNS
Advertising
worth or utility of advertising to consumers” (Ducoffe, 1995, p. 1). This evaluation is conceived as a thoughtful “cognitive assessment of the extent to which advertising gives consumers what they want” (Ducoffe, 1996, p. 24).
This model is based on the theory of media Uses and Gratifications (McQuail, 1983), which argues that media users expose themselves selectively to media based on their needs and gratification-seeking motives, and thus satisfy their utilitarian and/or hedonic
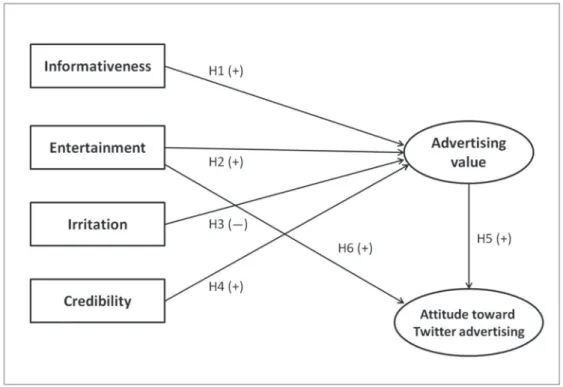
needs. Accordingly, Ducoffe (1996) proposed Informativeness, Entertainment and Irritation as antecedents of Advertising Value, and proposed a positive association between Advertising Value and Attitude toward web advertising. Credibility was later included in the model as a fourth antecedent of Advertising Value, again in the context of cyberspace advertising (Brackett & Carr, 2001). Figure 2 displays the model and the associated hypotheses. Next, we provide construct definition and formulate our hypotheses.
Figure 2. Advertising Value model.
Informativeness. Marketing theorists generally agree that the primary function of advertising is to convey information about products and services to allow consumers to make the best possible purchase decisions. If an ad provides useful, timely and relevant information consumers are more likely to perceive the ad as valuable. Hence our first hypothesis:
H1: The perceived Informativeness of the Twitter ad is positively associated with its perceived Advertising Value.
in both ad copy and the multimedia material that Twitter currently allows. Therefore, we propose:
H2: The perceived Entertainment of the Twitter ad is positively associated with its perceived Advertising Value.
Irritation. Consumers can be irritated by advertising tactics they find annoying, offensive or overly manipulative (Ducoffe, 1996). The excessive amount of advertising that users find on some sites, or ad clutter, can also be a source of irritation (Kim & Sundar, 2010). This leads to our third hypothesis:
H3:The perceived Irritation of the Twitter ad is negatively associated with its perceived Advertising Value.
Credibility. Brackett and Carr (2001) proposed Credibility as a valid extension to the Ducoffe model, citing its prevalence in other models (Eighmey, 1997; MacKenzie & Lutz, 1989). In their study of web advertising value among college students, they found that using Credibility as an antecedent of Advertising Value increased the predictive power of the original model. Therefore, we postulate:
H4: The perceived Credibility of the Twitter ad is positively associated with its perceived Advertising Value.
In Ducoffe’s (1996) original formulation, Advertising Value positively influenced Attitude toward web advertising, with an estimated
correlation of 0.70. Furthermore, he proposed that Entertainment also had a direct and positive effect on attitude toward web advertising because “both these constructs possess affective dimensions that are not captured by Advertising Value” (Ducoffe, 1996, p. 30), the latter being conceived mainly as a cognitive construct. We capture these two hypothesized relationships as follows:
H5: The perceived value of the Twitter ad is positively associated with the Attitude toward Twitter advertising.
H6: The perceived Entertainment of the Twitter ad is positively associated with the Attitude toward Twitter advertising.
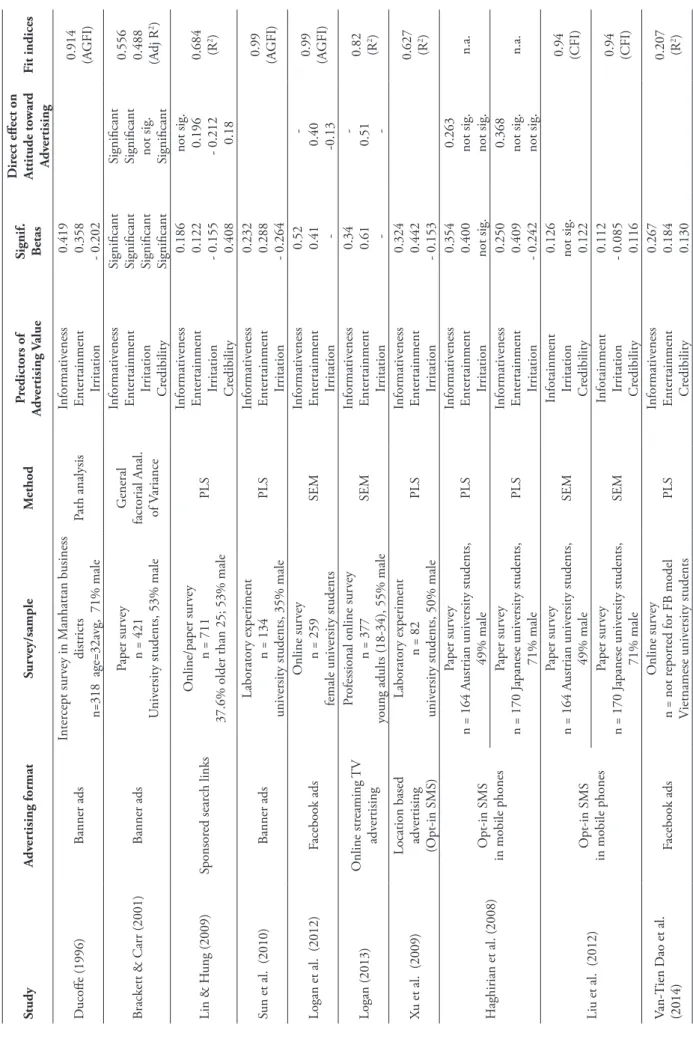
T able 1 Previous applications of A
dv er tising V alue model Study A dv er tising for mat Sur ve y/sample M ethod Pr edictors of A dv er tising V alue Signif. Betas D ir
ect effect on
A ttitude to war d A dv er tising Fit indices D ucoffe (1996) Banner ads Inter cept sur
vey in M
anhattan business
districts
n=318 age=32avg, 71% male
Path analysis Informativ eness Enter tainment Irritation
0.419 0.358 - 0.202 0.914 (AGFI)
Brackett & Carr (2001)
Banner ads
Paper sur
vey
n = 421
U
niv
ersity students, 53% male
G
eneral
factorial Anal. of V
ariance
Informativ
eness
Enter
tainment
Irritation Credibility Significant Significant Significant Significant Significant Significant not sig. Significant 0.556 0.488 (Adj R
2)
Lin & H
ung (2009) Sponsor ed sear ch links O nline/paper sur vey
n = 711
37.6% older than 25; 53% male
PLS
Informativ
eness
Enter
tainment
Irritation Credibility 0.186 0.122 - 0.155 0.408 not sig. 0.196 - 0.212 0.18
0.684 (R
2)
Sun et al. (2010)
Banner ads
Laborator
y experiment
n = 134
univ
ersity students, 35% male
PLS Informativ eness Enter tainment Irritation
0.232 0.288 - 0.264 0.99 (AGFI)
Logan et al. (2012)
Facebook ads
O
nline sur
vey
n = 259
female univ ersity students SEM Informativ eness Enter tainment Irritation
0.52 0.41 - - 0.40 -0.13 0.99 (AGFI)
Logan (2013) O nline str eaming TV adv er tising Pr
ofessional online sur
vey
n = 377
young adults (18-34), 55% male
SEM Informativ eness Enter tainment Irritation
0.34 0.61 - 0.51 - 0.82 (R2
)
Xu et al. (2009)
Location based adv
er
tising
(O
pt-in SMS)
Laborator
y experiment n = 82
univ
ersity students, 50% male
PLS Informativ eness Enter tainment Irritation
0.324 0.442 - 0.153 0.627 (R
2)
H
aghirian et al. (2008)
O
pt-in SMS
in mobile phones
Paper sur
vey
n = 164 A
ustrian univ ersity students, 49% male PLS Informativ eness Enter tainment Irritation
0.354 0.400 not sig. 0.263 not sig. not sig.
n.a.
Paper sur
vey
n = 170 J
apanese univ ersity students, 71% male PLS Informativ eness Enter tainment Irritation
0.250 0.409 - 0.242 0.368 not sig. not sig.
n.a.
Liu et al. (2012)
O
pt-in SMS
in mobile phones
Paper sur
vey
n = 164 A
ustrian univ
ersity students,
49% male
SEM
Infotainment Irritation Cr
edibility
0.126 not sig. 0.122 0.94 (CFI)
Paper sur
vey
n = 170 J
apanese univ
ersity students,
71% male
SEM
Infotainment Irritation Cr
edibility
0.112 - 0.085 0.116 0.94 (CFI)
Van-T
ien D
ao et al.
(2014)
Facebook ads
O
nline sur
vey
n = not r
epor
ted for FB model
V ietnamese univ ersity students PLS Informativ eness Enter tainment C redibility
0.267 0.184 0.130 0.207 (R
4
Instrument Development and
Data Collection
Scales for Informativeness, Entertainment, Irritation and Advertising Value were adapted from Ducoffe (1996) in order for respondents to evaluate Twitter ads. Following Bracket and Carr (2001), we based our scale for Credibility on the items proposed by MacKenzie and Lutz (1989). The measure for Attitude toward Twitter advertising was adapted from Alwitt and Prabhaker’s (1994) scale of attitudes toward TV advertising. Published scales were translated to Spanish by two native English speakers (none of the authors), and differences were reconciled. Spanish scales were then translated back to English by a third English speaker. Original and translated scales are provided in Appendix.
The survey was built and posted online using Google Forms, which afforded the important advantage of displaying correctly in both desktop and smartphone. We reasoned many potential respondents would first see the invitation in their cell phone, and we wanted to make it very quick and easy for them to respond to the survey from their mobile. We piloted the survey with twelve graduate Marketing students, and their suggestions were used to refine some items and improve the invitation and the layout of the survey in desktop/mobile screens.
We recruited participants for the study using a snowball sample. We enrolled two sections of business students (55 total students) in a class exercise to measure the reach and their ability to mobilize their personal social networks. Students first answered a brief survey with their name, age, gender, e-mail and number of Twitter followers and Facebook friends. Later, each student was given a personalized URL for an individual online copy of the Twitter survey created with Google Forms. Students were instructed to send their personalized URL through their personal social networks using whatever personal message they deemed most effective to viralize the invitation to take the survey among their first-order contacts,
and the second order-contacts of their contacts. No class credit was awarded for participating. The process ran for ten days and students were then shown the results of their recruiting efforts (656 total surveys completed, with the top recruiter obtaining 85 surveys, and 17 recruiters obtaining 0).
In addition, three research assistants (from the same major and age group as the previous students), who worked with one of the authors, sent the survey URL to their own personal networks, and obtained 110 completed surveys. Finally, 30 additional surveys were answered by students participating in a separate paper survey on mobile search advertising who volunteered their Twitter handle and were sent the URL for the survey. In all, 796 surveys were filled online between October and November 2013.
Careful examination of captured surveys revealed some respondents answered more than one survey, probably because they received invitations from several friends. These repetitions were discarded and only the first survey (according to the timestamp) was retained. Some surveys were completed by users whose age and workplace indicated they were no longer university students, and these too were discarded because they did not fit the target demographic for this research. We also discarded a few invalid surveys (n = 15) which had the same answer on all items. Given the socio-economic profile of our recruiters, the sample was heavily biased toward private university students, but the age and gender profile was appropriate for our study. A few (n = 12) students currently in high school also completed the survey and we retained their responses. In the end, 630 surveys were deemed usable.
SNS in general, and of Twitter in particular, is heavily loaded toward teen and young adult users, as reported in a recent nationwide study in Mexico (Asociación Mexicana de Internet [AMIPCI], 2013) shown in Table 2. By comparison, final sample characteristics are displayed in Table 3.
Table 2
Demographics of twitter versus Facebook users in Mexico
Twitter Facebook Percentage of internet
users who have opened an
account 69% 96%
Percentage accessing
through a smartphone 55% 56%
Female
Male 56%44% 55%45%
18-24 25-34 35-44 45-54 55+
48% 26% 14% 8% 4%
39% 26% 16% 13% 6% Note. Source: Adapted from “Estudio de marketing digital y social media 2013”, by AMIPCI, 2013.
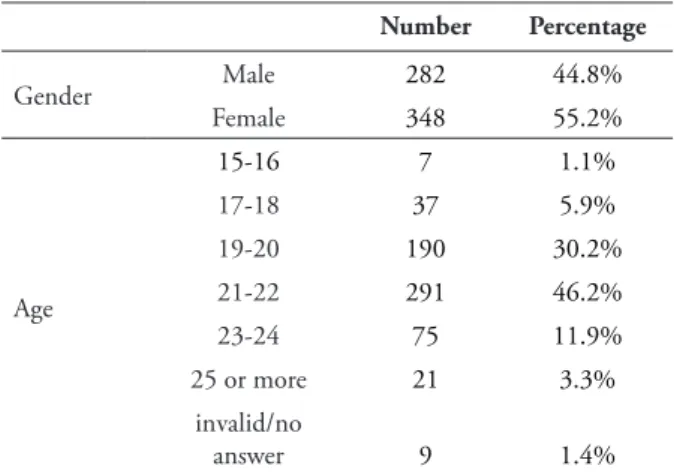
Table 3
Sample characteristics
Number Percentage
Gender Male 282 44.8%
Female 348 55.2%
Age
15-16 7 1.1%
17-18 37 5.9%
19-20 190 30.2%
21-22 291 46.2%
23-24 75 11.9%
25 or more 21 3.3%
invalid/no
answer 9 1.4%
5 Model Estimation
The hypothesized model was tested using the Partial Least Squares (PLS) method of structural equation modeling, which is suitable for exploratory research and is not subject to the normality assumption of covariance based SEM (Hair, Sarstedt, Ringle, & Mena, 2012). Estimation was carried out using SmartPLS version 2.0 (Ringle, Wende, & Will, 2005). We first evaluated the measurement or outer model, which involves examining indicator reliability, internal consistency reliability, convergent validity and discriminant validity (Hair et al., 2012).
Table 4 shows the outer model loadings, Cronbach alphas and composite reliabilities. Item irr1 was discarded because its loading was well below the 0.70 threshold suggested by Hulland (1999). All other items had acceptable loadings (numbers shown in Table 4 are after removing item irr1). In addition, composite reliabilities for all scales are well above the suggested threshold of 0.70 (Bagozzi & Yi, 1988), indicating good internal consistency.
Table 4
Indicator loadings, scale Cronbach alphas and Composite reliabilities
Scale Indicator loading Cronbach alpha Composite reliability
Informativeness 0.7843 0.8741
inf1 0.8355
inf2 0.8549
inf3 0.8162
Entertainment 0.8494 0.9088
ent1 0.8594
ent2 0.8862
ent3 0.8842
Irritation 0.8434 0.9274
irr1* 0.5647
irr2 0.9283
irr3 0.9313
Credibility 0.7925 0.8756
cred1 0.8416
cred2 0.7950
cred3 0.8740
Advertising Value 0.8377 0.9023
adval1 0.8546
adval2 0.8781
adval3 0.8736
Attitude toward Twitter Advertising 0.7781 0.8712
atoat1 0.8121
atoat2 0.8449
atoat3 0.8395
Note. * This item was dropped from the analysis, loading < 0.70. Adapted from “Use of partial least squares (PLS) in strategic
management research: A review of four recent studies”, by J. Hulland, 1999, Strategic Management Journal, 20, 195-204.
Table 5
Average variance extracted and inter-construct correlations
AVE INFORM ENTERT IRRIT CREDIB ADVALUE ATOAT
INFORM 0.6983 0.8356
ENTERT 0.7685 0.6713 0.8766
IRRIT 0.8646 -0.4484 -0.5485 0.9298
CREDIB 0.7014 0.6190 0.5972 -0.4758 0.8375
ADVALUE 0.7548 0.7797 0.7352 -0.4874 0.6164 0.8688
The cross loadings of the indicators provide a complementary check for discriminant validity, this time at the indicator level (Henseler et al., 2009). The loading of each indicator should be greater than all of its cross-loadings, and this was indeed the case. In sum, the measurement model displays adequate indicator and internal consistency reliability, as well as convergent and discriminant validity.
Figure 3 displays hypothesized model estimation for the full sample. The R2 values
indicate that the hypothesized predictors explain
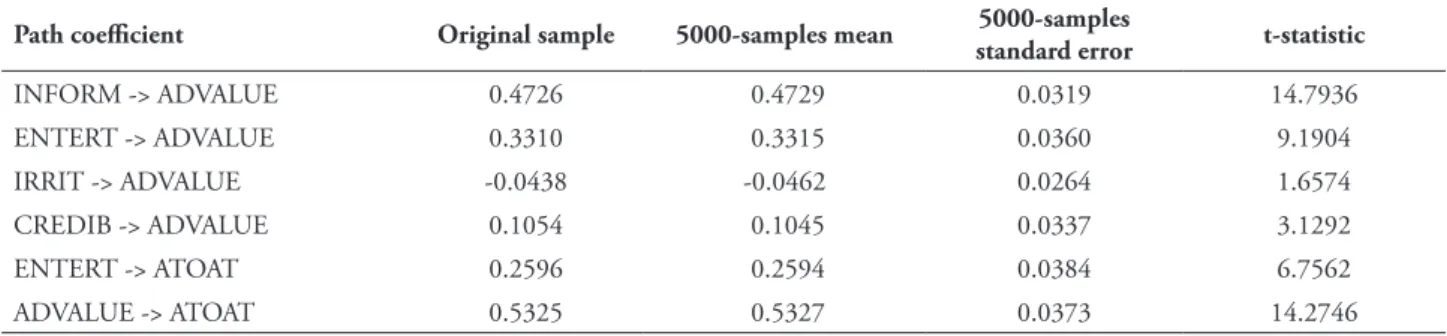
70% of the variance of Advertising Value and 55% of the variance of Attitude toward Twitter advertising. With the exception of the path for Irritation, all coefficients had the expected signs and were statistically significant. Because normality is not assumed for PLS studies, tests of significance rely on bootstrapping (Hair et al., 2012). The t-values for the path coefficients are shown in Table 6. In this case, all coefficients are significant at the 5% level (critical value 1.96 for two-tailed tests), with the exception of Irritation, which falls short of significance.
Table 6
Path coefficients for original sample (n = 630) and 5000 bootstraping samples
Path coefficient Original sample 5000-samples mean standard error5000-samples t-statistic
INFORM -> ADVALUE 0.4726 0.4729 0.0319 14.7936
ENTERT -> ADVALUE 0.3310 0.3315 0.0360 9.1904
IRRIT -> ADVALUE -0.0438 -0.0462 0.0264 1.6574
CREDIB -> ADVALUE 0.1054 0.1045 0.0337 3.1292
ENTERT -> ATOAT 0.2596 0.2594 0.0384 6.7562
ADVALUE -> ATOAT 0.5325 0.5327 0.0373 14.2746
Overall, the hypothesized model shows very good fit to the Twitter survey data, and explains a substantial amount of the variance of the endogenous latent variables.
The results for the structural model estimation using the full sample are displayed on Table 7a as Model 1. These results support all hypothesized relationships with their expected signs, except for the path coefficient of Irritation, which came out as non-significant (although significant at the 10% level, critical value 1.650).
The minimum sample size for PLS is ten times the largest number of structural paths directed at a particular latent construct in the structural model (Hair, Ringle, & Sarstedt, 2011). In this case, the maximum is four paths directed toward Advertising Value, hence requiring a minimum sample size of 40. Therefore, with a sample large enough to support a more detailed
analysis, we decided to test the hypothesized model on a number of relevant subsamples. In every case we rechecked the outer model loadings, AVE, composite reliability, and the Fornell-Larcker criterion to make sure model reliability and validity remained acceptable despite the smaller subsample and/or different model specification (such as Models 6, 7, 18 and 19 where Irritation was not included). These test results are available as an Attachment Document. The survey asked respondents how often they clicked on Twitter ads, reported frequencies are shown in Table 8. Respondents are approximately evenly split between those who have never clicked on an ad (41%) and those who have (59%). We tested the basic model among these two subsamples. Results are displayed side by side on Table 7a as Models 2 and 3.
Table 7a
Model estimation for full sample, click and non-click, female and male subsamples
Model 1 Model 2 Model 3 Model 4 Model 5 Model 6 Model 7
Full sample n = 630
Click n = 372
No-click n = 258
Female n = 348
Male n = 282
Female click n = 203
Male click n = 169
INFORM → ADVAL (14.794)0.473** (9.044)0.420** (11.643)0.521** (11.448)0.502** (9.189)0.443** (7.495)0.467** (5.158)0.371**
ENTERT → ADVAL (9.190)0.331** (7.694)0.381** (4.851)0.250** (6.134)0.292** (7.057)0.372** (5.504)0.331** (6.045)0.451**
IRRIT → ADVAL (1.657)-0.044 (0.076)0.002 (2.285)-0.097* (1.401)-0.047 (1.072)-0.037 --
--CREDIB → ADVAL (3.129)0.105** (2.309)0.106* (2.451)0.124* (2.782)0.126** (1.799)0.084 (2.584)0.145** (0.893)0.042
R2 (ADVAL) 0.698 0.630 0.697 0.729 0.664 0.680 0.586
ENTERT → ATOAT (6.756)0.260** (4.352)0.255** (4.149)0.214** (5.209)0.265** (4.046)0.242** (2.611)0.192** (3.249)0.304**
ADVAL → ATOAT (14.275)0.533** (7.803)0.444** (12.342)0.607** (10.931)0.525** (9.554)0.549** (7.064)0.499** (4.436)0.391**
R2 (ATOAT) 0.554 0.421 0.590 0.554 0.552 0.420 0.412
Table 8
Do you frequently click on Twitter ads?
Female Male Total Percentage
I never have 145 113 258 41.0%
I have clicked a few times 177 142 319 50.6%
I click often 19 26 45 7.1%
I click (nearly) every time I log in 7 1 8 1.3%
Total 348 282 630 100.0%
For participants who have never clicked on a Twitter ad, the Irritation variable becomes significant with the expected negative effect on Advertising Value. By contrast, for participants who do click on ads, the path coefficient of Irritation drops nearly to zero, and the t-statistic remains non-significant.
Next we tested the model on the male and female subsamples, results are displayed on Table 7a as Models 4 and 5. In both cases, Irritation comes out as non-significant, which is the same result as Model 1. However, an interesting difference appears for Credibility. For female respondents, Credibility retains the significance it had in the full sample, whereas for male respondents Credibility fails the significance test.
To perform a more detailed analysis of participants who click on ads, for whom it is already established that Irritation is not significant, the sample is next split into female (Model 6) and male (Model 7) respondents who have clicked on Twitter ads. The results reveal that Credibility is significant for female respondents, but not for males, the same conclusion derived earlier from Models 4 and 5.
At this point, we questioned whether there would be significant differences between users with low versus high levels of posting activity and between those who recently joined the SNS versus those who are more experienced. We did not measure these variables in our survey, but since over 90% of our survey respondents did provide their Twitter username, we complemented user
survey data with two statistics we obtained from their public profile: tenure and total number of tweets. We then split the sample on the median of these two variables and tested the basic model on these new subsamples. We examined first whether users differed on account of their level of posting activity; the results are displayed on Table 7b as Model 8 and Model 11. For both subsamples there were important differences with respect to the basic Model 1.
For respondents with the lower number of total tweets, the Irritation path coefficient became significant; whereas for those with the higher number of total tweets, both Irritation and Credibility became non-significant. Moreover, when the first group is further partitioned into female and male subsamples (Models 9 and 10), Irritation became non-significant for males but significant for females, whereas Credibility became non-significant for both males and females. On the other subsample, among users with the higher number of tweets, the comparison between females and males (Models 12 and 13) yielded no gender differences. These results indicate that as both male and female users gain more experience with the Twitter platform, Irritation and Credibility become less important in their assessment of Advertising Value.
Table 7b
Model estimation low and high total tweets, female and males subsamples
Model 8 Model 9 Model 10 Model 11 Model12 Model13
Low tweets n = 282
Low tweets female n = 149
Low tweets male n = 133
High tweets n = 283
High tweets female n = 171
High tweets male n = 112
INFORM → ADVAL (9.567)0.463** (6.670)0.470** (6.854)0.458** (10.993)0.524** (9.719)0.571** (5.803)0.469**
ENTERT → ADVAL (5.630)0.295** (3.535)0.281** (4.201)0.308** (6.789)0.337** (5.771)0.333** (4.234)0.347**
IRRIT → ADVAL (2.501)-0.112* (2.321)-0.148* (1.332)-0.067 (0.577) 0.016 (1.270)-0.056 (0.272)-0.013
CREDIB → ADVAL (2.075)0.106* (1.414)0.091 (1.921)0.131 (1.719)0.078 (1.643)0.095 (0.961)0.058
R2 (ADVAL) 0.671 0.667 0.680 0.710 0.772 0.617
ENTERT → ATOAT (4.986)0.300** (3.732)0.264** (3.206)0.328** (4.592)0.245** (3.388)0.265** (3.197)0.218**
ADVAL → ATOAT (7.940)0.447** (7.854)0.516** (4.010)0.373** (11.114)0.572** (7.294)0.536** (9.489)0.629**
R2 (ATOAT) 0.477 0.525 0.419 0.595 0.577 0.631
Note. * significant 95%, ** significant 99% (two-tailed tests)
Table 7c
Model estimation for low and high tenure, female and male subsamples
Model 14 Model 15 Model 16 Model 17 Model 18 Model 19
Low tenure n = 264
Low tenure female n = 145
Low tenure male n = 119
High tenure n = 265
High tenure female n = 154
High tenure male n = 111
INFORM → ADVAL (11.169)0.489** (7.142)0.456** (8.035)0.520** (9.876)0.523** (9.936)0.608** (4.345)0.386**
ENTERT → ADVAL (7.082)0.333** (5.690)0.366** (3.610)0.277** (5.797)0.327** (4.171)0.276** (5.244)0.420**
IRRIT → ADVAL (1.838)-0.081 (1.755)-0.086 (1.197)-0.075 (0.467)-0.015 --
--CREDIB → ADVAL (1.968)0.087* (2.334)0.110* (1.216)0.083 (0.721)0.028 (0.285)0.013 (1.279)0.086
R2 (ADVAL) 0.746 0.805 0.673 0.635 0.665 0.621
ENTERT → ATOAT (4.220)0.300** (2.915)0.310* (2.802)0.272** (4.702)0.251** (3.994)0.261** (2.434)0.222*
ADVAL → ATOAT (6.610)0.446** (4.343)0.440** (5.174)0.465** (11.105)0.565** (8.927)0.559** (6.739)0.588**
R2 (ATOAT) 0.492 0.512 0.463 0.575 0.572 0.581
Note. * significant 95%, ** significant 99% (two-tailed tests)
Low tenure users did not significantly differ from the basic Model 1. However, for high tenure respondents, the path coefficient for Credibility became non-significant. When we further split each subsample into male and
not detect any gender differences (Models 18 and 19). Again, these results suggest that as Twitter users of both genders become more experienced, Irritation and Credibility lose their initial significance for assessing Advertising Value, and only Informativeness and Entertainment retain their relevance.
6
Conclusions
This research contributes to our understanding of perceptions of Advertising Value among users of SNS, where there are as yet few published studies (e.g. Dao et al., 2014; Hassan, Fatima, Akram, Abbas, & Hasnain, 2013; Logan et al., 2012; Saxena & Khanna, 2013). Specifically, we found that perceived Informativeness, Entertainment and Credibility significantly influence perceptions of Advertising Value and Attitudes toward advertising in the Twitter platform. Four of our six research hypotheses were supported in all samples, one was supported in the full sample and some subsamples, and only one hypothesis received limited support. This shows the applicability of the Ducoffe model on SNS and in a Latin American context.
The results from the main sample and various subsamples indicate that Informativeness has the strongest effect on Advertising Value for Twitter ads; only in two of the subsamples did it narrowly take second place to Entertainment. The magnitude of the Informativeness path estimates is consistent with the results from the study of web advertising by Ducoffe (1996) and Brackett and Carr (2001), and the more recent study of Facebook ads by Logan et al. (2012), as shown in Table 1. Hence, Hypothesis 1 is strongly supported in all samples.
Entertainment had the second strongest effect on Advertising Value, with statistically significant effects in every sample. Furthermore, Entertainment was found to have a direct effect on Attitude toward Twitter advertising; the effect was substantial and significant across all subsamples. Thus we find strong support for both Hypothesis 2 and Hypothesis 6.
Credibility came in third for the size of its effect on Advertising Value. In addition, we found statistically significant gender effects for this predictor. Specifically, when the full sample was split into male and female respondents, Credibility was significant only among females. This finding was repeated when both the clicking subsample and the low-tenure subsample were split by gender: in both cases Credibility mattered to women but not to men. Therefore, Hypothesis 4 receives qualified support.
Lastly, Irritation came out as the weakest predictor of Advertising Value in this study, failing to reach the significance level in nearly all subsamples. A possible explanation would be that nearly half of our Millennial sample find Twitter ads irritating and refrain from clicking on them; for this subsample (Model 3) Irritation came out as a significant predictor of Advertising Value. However, slightly over half of the sample are less annoyed by Twitter ads, have clicked on them at some point, and for these, the path estimate for Irritation came out as non-significant.
In every case where Irritation was significant, the magnitude of the path coefficient took fourth place after Informativeness, Entertainment and Credibility. We would argue that Twitter’s policy of protecting the user experience (Copeland, 2012), and placing relatively few ads in users’ newsfeed has resulted in Irritation not being a major concern for Millennial Twitter users. Therefore, Hypothesis 3 receives only limited support. A summary of study conclusions regarding the research hypotheses is provided in Table 9.
be enhanced by increasing the personalization of messages the targeting options Twitter provides
(such as personal interests, keywords and behavioral targeting).
Table 9
Summary of hypotheses
Hypothesis Model conclusion
H1 - Informativeness (+) on AdValue Supported in all samples
H2 - Entertainment (+) on AdValue Supported in all samples
H3 - Irritation (-) on AdValue Limited support: among non-clicking respondentsand among females with low total tweets
H4 - Credibility (+) on AdValue Supported in full sampleSupported also among female respondents, females
who click on ads, and females with low tenure
H5 - AdValue (+) on Attitude Supported in all samples
H6 - Entertainment (+) on Attitude Supported in all samples
Entertainment had the second strongest influence on Advertising Value. Moreover, the direct effect of Entertainment on Attitude was significant and remarkably consistent across all subsamples. The implication is that writing witty, funny or entertaining promoted tweets positively influences users’ assessment of Twitter ads and their general attitude toward Twitter advertising.
Irritation had a statistically significant effect only among respondents who reported never clicking on a Twitter ad, and users with low total tweets, although Model 9 showed it was really only a concern for female users. Hence, the majority of our Millennial sample did not take issue with Twitter ads, which suggests the platform provides an interesting opportunity to advertisers, particularly in light of recent industry reports of user fatigue with Facebook ads (Tassi, 2013) and some research studies where Irritation has been a significant antecedent of Advertising Value (Hassan et al., 2013). Another relevant finding is that as users gain more experience with Twitter, measured as both tenure and total posted tweets, Irritation becomes non-significant as a predictor of Advertising Value. This suggests that users’ initial concerns with advertising tend to diminish as they make more use of Twitter, presumably because of a positive user experience.
Finally, the study found that Credibility is significant only among females and users with
lower total tweets. The implication for advertisers, particularly those catering to women, is that writing copy that reinforces the Credibility of the promoted tweet (say by mentioning independent reviews or money-back guarantees) will make the ad more effective among female users. Given concerns about Millennial scepticism toward conventional advertising (Schawbel, 2015), this finding is welcome news for brands.
our contacting behavior. Facing this restriction, we decided to invite respondents through their Twitter contacts, in effect a snowball sample, using our own students as recruiters.
Although precluded from using a probabilistic sample, a survey of university students is still relevant for this research. Millennials are a key segment for many brands, and industry surveys report that the age distribution of Twitter participants strongly favors teen and young adults (AMIPCI, 2013). Still, some caution must be exercised when generalizing results from this study.
First, for brands advertising in Mexico and Latin America, Twitter is among the largest and fastest-growing SNS. Second, the results of this study, and other industry reports (Tassi, 2013), suggest user irritation with ads is lower than on Facebook, the leading SNS. Third, by targeting Millennials this study contributes to our knowledge of a key demographic, not only in Mexico but around the world (Smith, 2011). Moore (2012, p. 436) has pointed out that “technology drives global homogeneity among worldwide population within the Millennial age group”. Fourth, this research extends results from previous studies of Internet advertising perceptions among Hispanic consumers, a key market segment in the U.S. (Korgaonkar, Silverblatt, & O’Leary, 2001).
Two important implications for the Twitter platform itself should be mentioned. First, we would argue that the company’s policy of protecting the user experience, and avoiding excessive advertising, could explain why 59% of users in our sample had clicked on ads at some point and did not have Irritation as a significant predictor of Advertising Value. It is very likely that our survey respondents had experience with Facebook ads, and were able to compare advertising clutter among both platforms.
Second, the fact that smartphone penetration is very high among our Millennial sample implies a positive outlook for mobile Twitter advertising, which has grown rapidly
in the last year and now makes up 90% of ad revenues (Emarketer, 2016c).
As for future research, the authors would welcome opportunities to extend and contrast these results with Spanish-speaking Millennial samples from other Latin American countries or even to develop and validate a Portuguese translation of the Ducoffe scales. The fact that the survey can be delivered through Google Forms, in both desktop and smartphone screen sizes makes such studies fairly straightforward, and research on user perceptions of social media advertising is still in its infancy.
References
Alwitt, L. F., & Prabhaker, P. R. (1994). Identifying who dislikes television advertising: Not by demographics alone. Journal of Advertising Research, 34(6), 17-29.
Asociación Mexicana de Internet. (2013). Estudio de marketing digital y social media 2013. Retrieved from https://www.amipci.org.mx/es/estudios
Bagozzi, R. P., & Yi, Y. (1988). On the evaluation of structural equation models. Journal of the Academy of Marketing Science, 16(1), 74-94.
Blanco, C. F., Blasco, M. G., & Azorín, I. I. (2010). Entertainment and informativeness as precursory factors of successful mobile advertising messages. Communications of the
IBIMA, 2010(2010), 1-11
Brackett, L. K., & Carr, B. N. J. (2001). Cyberspace advertising vs. other media: Consumer vs. mature student attitudes. Journal of Advertising Research, 41(1), 23-32.
Chandra, B., Goswami, S., & Chouhan, V. (2013). Investigating attitude towards online advertising on social media: An empirical study. Management Insight, 8(1), 1-14.
Copeland, M. (2012). Dick Costolo doesn’t want you to worry about Twitter’s business. Retrieved from http://www.wired.com/2012/05/dick-costolo-twitter-business/
Coyle, J. R., Smith, T., & Platt, G. (2012). “I’m here to help” how companies’ microblog responses to consumer problems influence brand perceptions. Journal of Research in Interactive
Marketing, 6(1), 27-41.
Dao, W. V-T., Le, A. N. H., Cheng, J. M.-S., & Chao, D. C. (2014). Social media advertising value: The case of transitional economies in Southeast Asia. International Journal of
Advertising, 33(2), 271-294.
Ducoffe, R. H. (1995). How consumers assess the value of advertising. Journal of Current Issues & Research in Advertising, 17(1), 1-18.
Ducoffe, R. H. (1996). Advertising Value and advertising on the web. Journal of Advertising Research, 36(1), 21-36.
Eighmey, J. (1997). Profiling user responses to commercial websites. Journal of Advertising Research 37(3), 59-66.
Emarketer. (2015). Mobile ad spend to top $100 billion worldwide in 2016, 51% of digital market. Retrieved from http://www.emarketer.com/ Article/Mobile-Ad-Spend-Top-100-Billion-Worldwide-2016-51-of-Digital-Market/1012299
Emarketer. (2016a). Twitter’s user base in Latin America Continues to grow. Retrieved from http:// www.emarketer.com/Article/Twitters-User-Base-Latin-America-Continues-Grow/1013924
Emarketer. (2016b). Twitter ad revenues expected to continue robust growth. Retrieved from http://www.emarketer.com/Article/Twitter- Ad-Revenues-Expected-Continue-Robust-Growth/1013571
Emarketer. (2016c). eMarketer growth outlook for Twitter. Retrieved from http://www.emarketer.
com/Article/eMarketer-Lowers-Growth-Outlook-Twitter/1013714
Enders, A., Hungenberg, H., Denker, H. P., & Mauch, S. (2008). The long tail of social networking: Revenue models of social networking sites. European
Management Journal, 26(3), 199-211.
Hair, J. F., Ringle, C. M., & Sarstedt, M. (2011). PLS-SEM: Indeed a silver bullet. The Journal of Marketing Theory and Practice, 19(2), 139-152.
Hair, J. F., Sarstedt, M., Ringle, C. M., & Mena, J. A. (2012). An assessment of the use of partial least squares structural equation modeling in marketing research. Journal of the Academy of Marketing Science, 40(3), 414-433.
Haghirian, P., Madlberger, M., & Inoue, A. (2008, January). Mobile advertising in different stages of development: A cross-country comparison of consumer attitudes. Proceedings of the Annual Hawaii International Conference on System Sciences, Waikoloa, Hawaii, USA, 41.
Hassan, M. U., Fatima, S., Akram, A., Abbas, J., & Hasnain, A. (2013). Determinants of consumer attitude towards social-networking sites advertisement: Testing the mediating role of advertising value. Middle East Journal of Scientific Research, 16(3), 319-330.
Henry, M., & Harte, B. (2012). A new model for assessing the value of social media activity. Journal of Brand Strategy, 1(3), 234-239.
Henseler, J., Ringle, C. M., & Sinkovics, R. R. (2009). The use of partial least squares path modeling in international marketing. Advances in International Marketing, 20(1), 277-319.
Hulland, J. (1999). Use of partial least squares (PLS) in strategic management research: A review of four recent studies. Strategic Management Journal, 20(2), 195-204.
Jansen, B. J., Zhang, M., Sobel, K., & Chowdury, A. (2009). Twitter power: Tweets as electronic word of mouth. Journal of the American society for information science and technology, 60(11), 2169-2188.
Kim, N. Y., & Sundar, S. S. (2010). Relevance to the rescue: Can “Smart Ads” reduce negative response to online ad clutter? Journalism & Mass Communication Quarterly, 87(2), 346-362.
Kim, E., Sung, Y., & Kang, H. (2014). Brand followers’ retweeting behavior on Twitter: How brand relationships influence brand electronic word-of-mouth. Computers in Human Behavior, 37(1), 18-25.
Koh, Y. (2014). Twitter results silence naysayers. Retrieved from http://online.wsj.com/articles/ twitters-user-growth-picks-up-1406664889
Korgaonkar, P., Silverblatt, R., & O’Leary, B. (2001). Web advertising and Hispanics. Journal of Consumer Marketing, 18(2), 134-152.
Kwon, E. S., & Sung, Y. (2011). Follow me! Global marketers’ Twitter use. Journal of Interactive Advertising, 12(1), 4-16.
Li, Z., & Li, C. (2014). Twitter as a social actor: How consumers evaluate brands differently on Twitter based on relationship norms. Computers
in Human Behavior, 39(1), 187-196.
Lin, F. H., & Hung, Y. F. (2009). The value of and attitude toward sponsored links for internet information searchers. Journal of Electronic Commerce Research, 10(4), 235-251.
Liu, C. L. E., Sinkovics, R. R., Pezderka, N., & Haghirian, P. (2012). Determinants of consumer perceptions toward mobile advertising: A comparison between Japan and Austria. Journal of Interactive Marketing, 26(1), 21-32.
Logan, K. (2013). And now a word from our sponsor: Do consumers perceive advertising on
traditional television and online streaming video differently? Journal of Marketing Communications, 19(4), 258-276.
Logan, K. (2014). Why isn’t everyone doing it? A comparison of antecedents to following brands on Twitter and Facebook. Journal of Interactive Advertising, 14(2), 60-72.
Logan, K., Bright, L. F., Gangadharbatla, H. (2012). Facebook versus television: Advertising value perceptions among females. Journal of Research in Interactive Marketing, 6(3), 164-179.
MacKenzie, S. B., & Lutz, R. J. (1989). An empirical examination of the structural antecedents of attitude toward the ad in an advertising pretesting context. The Journal of Marketing, 53(2), 48-65.
McQuail, D. (1983). Mass Communication Theory: An Introduction. London: Sage.
Méndiz-Noguero, A., Victoria-Mas, J. S., & Arroyo-Almaraz, I. (2013). La eficacia de la publicidad social en las redes sociales: Un experimento online con usuarios jóvenes. Razón y palabra, 18(82), 31-19.
Moore, M. (2012). Interactive media usage among millennial consumers. Journal of Consumer Marketing, 29(6), 436-444.
Nogueira-Cortimiglia, M., Ghezzi, A., & Renga, F. (2011). Social applications: Revenue models, delivery channels, and critical success factors-An exploratory study and evidence from the spanish-speaking market. Journal of Theoretical and Applied Electronic Commerce Research, 6(2), 108-122.
Núñez, A. (2013). Análisis de mensajes en redes sociales para la detección de eventos de impacto (Unpublished Master’s thesis). Instituto Tecnológico Autónomo de México, Mexico City.
Ringle, C., Wende, S., & Will, A. (2005). Smart PLS 2.0 (Beta). Retrieved from www.smartpls.de
Sandoval-Almazán, R., & Nava-Rogel, R. M. (2012). Uso de Twitter en la empresa mexicana: Un modelo de análisis. Razón y palabra, 17(80), 43-28. Saxena, A., & Khanna, U. (2013). Advertising on social network sites: A structural equation modelling approach. Vision: The Journal of Business Perspective, 17(1), 17-25.
Schawbel, D. (2015). 10 new findings about the millennial consumer. Retrieved from http://www. forbes.com/sites/danschawbel/2015/01/20/10-new-findings-about-the-millennial-consumer/
Smith, K. T. (2011). Digital marketing strategies that Millennials find appealing, motivating, or just annoying. Journal of Strategic Marketing, 19(6), 489-499.
Sreenivasan, N. D., Lee, C. S., & Goh, H-L. D. (2012). Tweeting the friendly skies: Investigating information exchange among Twitter users about airlines. Program, 46(1), 21-42
Sun, Y., Lim, K. H., Jiang, C., Peng, J. Z., & Chen, X. (2010). Do males and females think in the same way? An empirical investigation on the gender differences in Web advertising evaluation. Computers in Human Behavior, 26(6), 1614-1624.
Tassi, P. (2013). Facebook’s advertising is starting to spiral out of control. Retrieved from http://
www.forbes.com/sites/insertcoin/2013/07/01/ facebooks-advertising-is-starting-to-spiral-out-of-control/
Taylor, D. G., Lewin, J. E., & Strutton, D. (2011). Friends, fans, and followers: do ads work on social networks? Journal of Advertising Research, 51(1), 258-275.
Twitter. (2014a). What are promoted tweets? Retrieved from https://support.twitter.com/ articles/142101
Twitter. (2014b). What are promoted accounts? Retrieved from https://support.twitter.com/ articles/282154
Twitter. (2014c). What are promoted trends? Retrieved from https://support.twitter.com/ articles/282142
Twitter. (2016). About us. Retrieved from https:// about.twitter.com/company
Xu, H., Oh, L. B., & Teo, H. H. (2009). Perceived effectiveness of text vs. multimedia location-based advertising messaging. International Journal of Mobile Communications, 7(2), 154-177.
Appendix: Original and Translated Scale Items for Measures
Twitter advertising… La publicidad en Twitter…
Informativeness (Ducoffe, 1996)
is a good source of product information es una buena fuente de información de productos y servicios
supplies relevant product/service information proporciona información relevante de productos y servicios
provides timely information proporciona información oportuna
Entertainment (Ducoffe, 1996)
is entertaining es entretenida
is enjoyable es agradable
is fun to use es divertida de usar
Irritation (Ducoffe, 1996)
is too insistent* es demasiado insistente*
is annoying es molesta
is irritating es irritante
Credibility (Brackett & Carr, 2001; MacKenzie & Lutz, 1989)
is trustworthy es confiable
is believable / is credible es creíble
is convincing es convincente
Advertising Value (Ducoffe, 1996)
is useful es útil
is valuable es valiosa
is important es importante
Attitude toward Twitter advertising (Alwitt & Prabhaker, 1994) helps me to find products/services that match my
person-ality and interests me ayuda a encontrar productos y servicios que coinciden con mi personalidad e intereses
helps me know which brands have the features I am
look-ing for me ayuda a conocer qué marcas tienen las características que yo busco
is a good way to learn about what products/services are
available es una buena manera de enterarse de los productos y servicios disponibles
*new item irr1, eventually discard
Supporting agencies:
The authors gratefully acknowledge the support of Asociación Mexicana de Cultura, A.C.
About the authors:
1. Enrique Murillo, PhD in Management, ITAM, Mexico City, Mexico. Email: emurillo@itam.mx 2.María Merino, PhD in Marketing, ITAM, Mexico City, Mexico. Email: mmerino@itam.mx
3.Adriana Núñez, MSc in Management, Independent Business & IT Consultant, Mexico City, Mexico Email: adriana.nunez@gmail.com
Contribution of each author:
Contribution Enrique Murillo María Merino Adriana Núñez
1. Definition of research problem √ √ √
2. Development of hypotheses or research questions (empirical
studies) √ √
3. Development of theoretical propositions (theoretical work) √ √
4. Theoretical foundation /Literature review √ √
5. Definition of methodological procedures √ √ √
6. Data collection √ √
7. Statistical analysis √
8. Analysis and interpretation of data √ √
9. Critical revision of the manuscript √ √